GPU Benchmarks & Performance Hierarchy
Our GPU benchmarks hierarchy ranks all the current and previous generation graphics cards by performance, and Tom’s Hardware exhaustively benchmarks current and previous generation GPUs, including all of the best graphics cards. Whether it’s playing games, running artificial intelligence workloads like Stable Diffusion, or doing professional video editing, your graphics card typically plays the biggest role in determining performance — even the best CPUs for Gaming take a secondary role.
With 2025, the new GPU releases have been coming fast and furious. Intel kicked things off with the Arc B580 at the end of 2024, followed by Arc B570 in January. Nvidia announced its Blackwell RTX 50-series architecture at CES 2025, then launched the RTX 5090 and RTX 5080 in late January, the RTX 5070 Ti in February. The biggest problem with nearly all of those GPUs? You can’t buy them at MSRP, or sometimes even at all.
The AMD RX 9070 XT at $599 and RX 9070 at $549 arrived on March 6, one day after Nvidia’s RTX 5070 at $549 launched. We’ve tested those cards as well and have updated the GPU hierarchy. Naturally, they sold out as well. It’s not that we don’t want more affordable graphics cards; it’s that AI is all the rage, commanding billions of dollars in sales. It accounted for nearly 90% of Nvidia’s record-setting $130 billion in annual revenue for last fiscal year. Gaming was just under 9% of the total.
A big part of the problem is also that Nvidia and AMD seemingly made some planning errors with the transitions from the prior generation to the new / upcoming hardware. Demand for the prior generation didn’t dry up, and basically all the RTX 40-series GPUs and RX 7000-series GPUs went out of stock, with the exception of the base model RTX 4060 and RX 7600. That started to happen several months ago, leaving a gaping hole of demand for the new GPUs.
Inventory ran out before the new GPUs were ready, creating a backlog of people wanting to upgrade GPUs. Couple that with an inadequate supply of Nvidia’s RTX 50-series cards that have launched and you basically can’t find a reasonably priced graphics card. And then there are new tariffs coming into effect that could further impact prices and availability. It’s a perfect storm hitting the graphics market yet again.
The good news? Some of the latest graphics cards are starting to become available at prices closer to their respective MSRPs. We’ve seen the RTX 5070 stay in stock for hours (yeah, that’s all) at its $549 base price. In fact, as we write this, you can buy the MSI RTX 5070 Shadow 2X OC for $549, direct from MSI. Or you can pay for shipping and get the MSI RTX 5070 Ventus 2X OC from Newegg for $549. Two cards isn’t a habit, but it does represent at least a minor change in availability. The competing AMD RX 9070 by contrast starts at $779 at the time of writing — 42% above the base MSRP, which is more in line with what we’re seeing on a lot of GPUs.
UPDATES IN PROGRESS! CHECK BACK LATER! (IF YOU SEE THIS MESSAGE, WE’RE NOT FINISHED.)
April 2025 Update
We’re in the process of fleshing out the full update with all the latest graphics cards. We’ve swapped over the main page to the latest generation GPUs, with some prior generation parts, moving 2024 and earlier results to “legacy” status on the following pages. We’re starting to test older GPUs with the latest test suite as well.
We’re also working on revamping our GPU test suite. We’ve upgraded the test PC to an AMD Ryzen 7 9800X3D and socket AM5 platform, and we’re now in the process of retesting… well, everything, as much as possible. Our latest reviews use the new test suite and test PC, and we now have enough of the latest and previous generation GPUs to swap over to the new data for the hierarchy. There are still a few gaps to fill in (4070 Super, 4060 Ti 16GB/8GB, 7900 GRE, and 7700 XT), but we’ll get those done soon enough — and then start looking toward testing the next older GPUs (RTX 30-series and RX 6000-series).
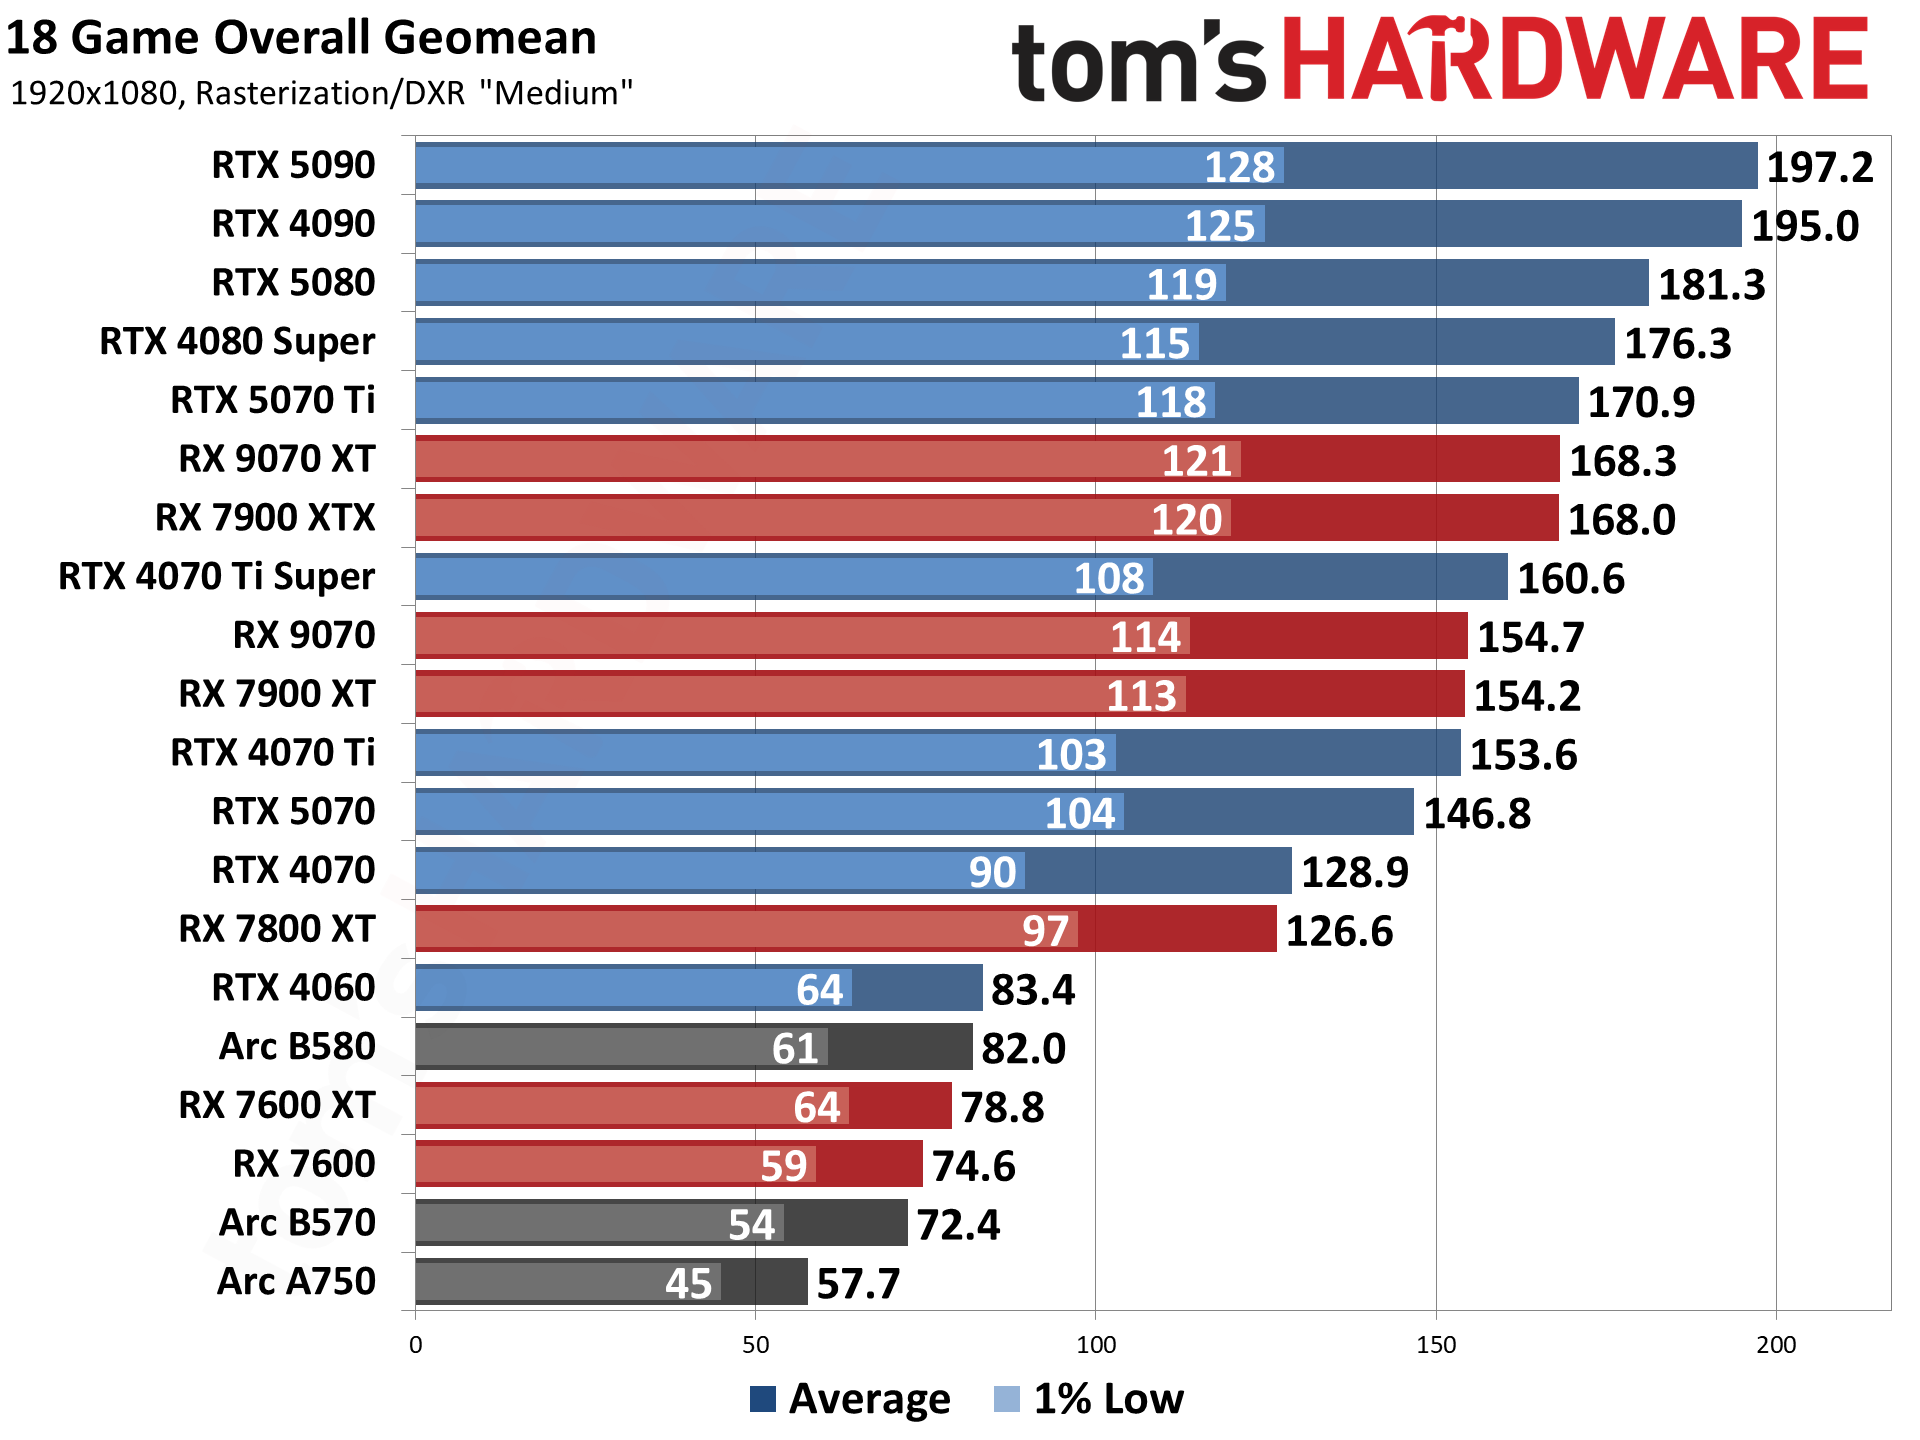
Our full GPU hierarchy using traditional rendering (aka, rasterization) comes first, and below that we have our ray tracing GPU benchmarks hierarchy. Those of course require a ray tracing capable GPU so only AMD’s RX 7000/6000-series, Intel’s Arc, and Nvidia’s RTX cards are present. The results are all at native resolution, without enabling DLSS, FSR, or XeSS upscaling or frame generation.
Nvidia’s Ada Lovelace architecture powers its previous generation RTX 40-series, with new features like DLSS 3 Frame Generation — with DLSS 4 upgrading the quality of both upscaling and ray reconstruction, plus adding MFG (Multi Frame Generation) on the 50-series GPUs. AMD’s RDNA 3 architecture powers the RX 7000-series, with seven desktop cards filling out the product stack. Intel’s Arc Alchemist architecture brings a third player into the dedicated GPU party, even if it’s more of a competitor to the earlier generation midrange offerings (i.e. RTX 3060 and RX 6650 XT).
On page two, you’ll find our 2024–2022 benchmark suite, which has all the previous generation GPUs running an older test suite and a Core i9-12900K. Page three has an even older 2020–2021 test suite with only rasterization games, running on a Core i9-9900K testbed. The legacy tables are no longer being actively updated. There’s also the “Ancient Legacy GPU hierarchy” (without benchmarks, sorted by theoretical performance) for reference purposes on page three.
The following tables sort everything solely by our performance-based GPU gaming benchmarks, at 1080p “ultra” for the main suite and at 1080p “medium” for the DXR suite. Factors including real-world pricing, graphics card power consumption, overall efficiency, and features aren’t factored into the rankings here. The latest 2025 results use an AMD Ryzen 7 9800X3D testbed. Here are tables and benchmark results.
Rasterization GPU Benchmarks Ranking 2025
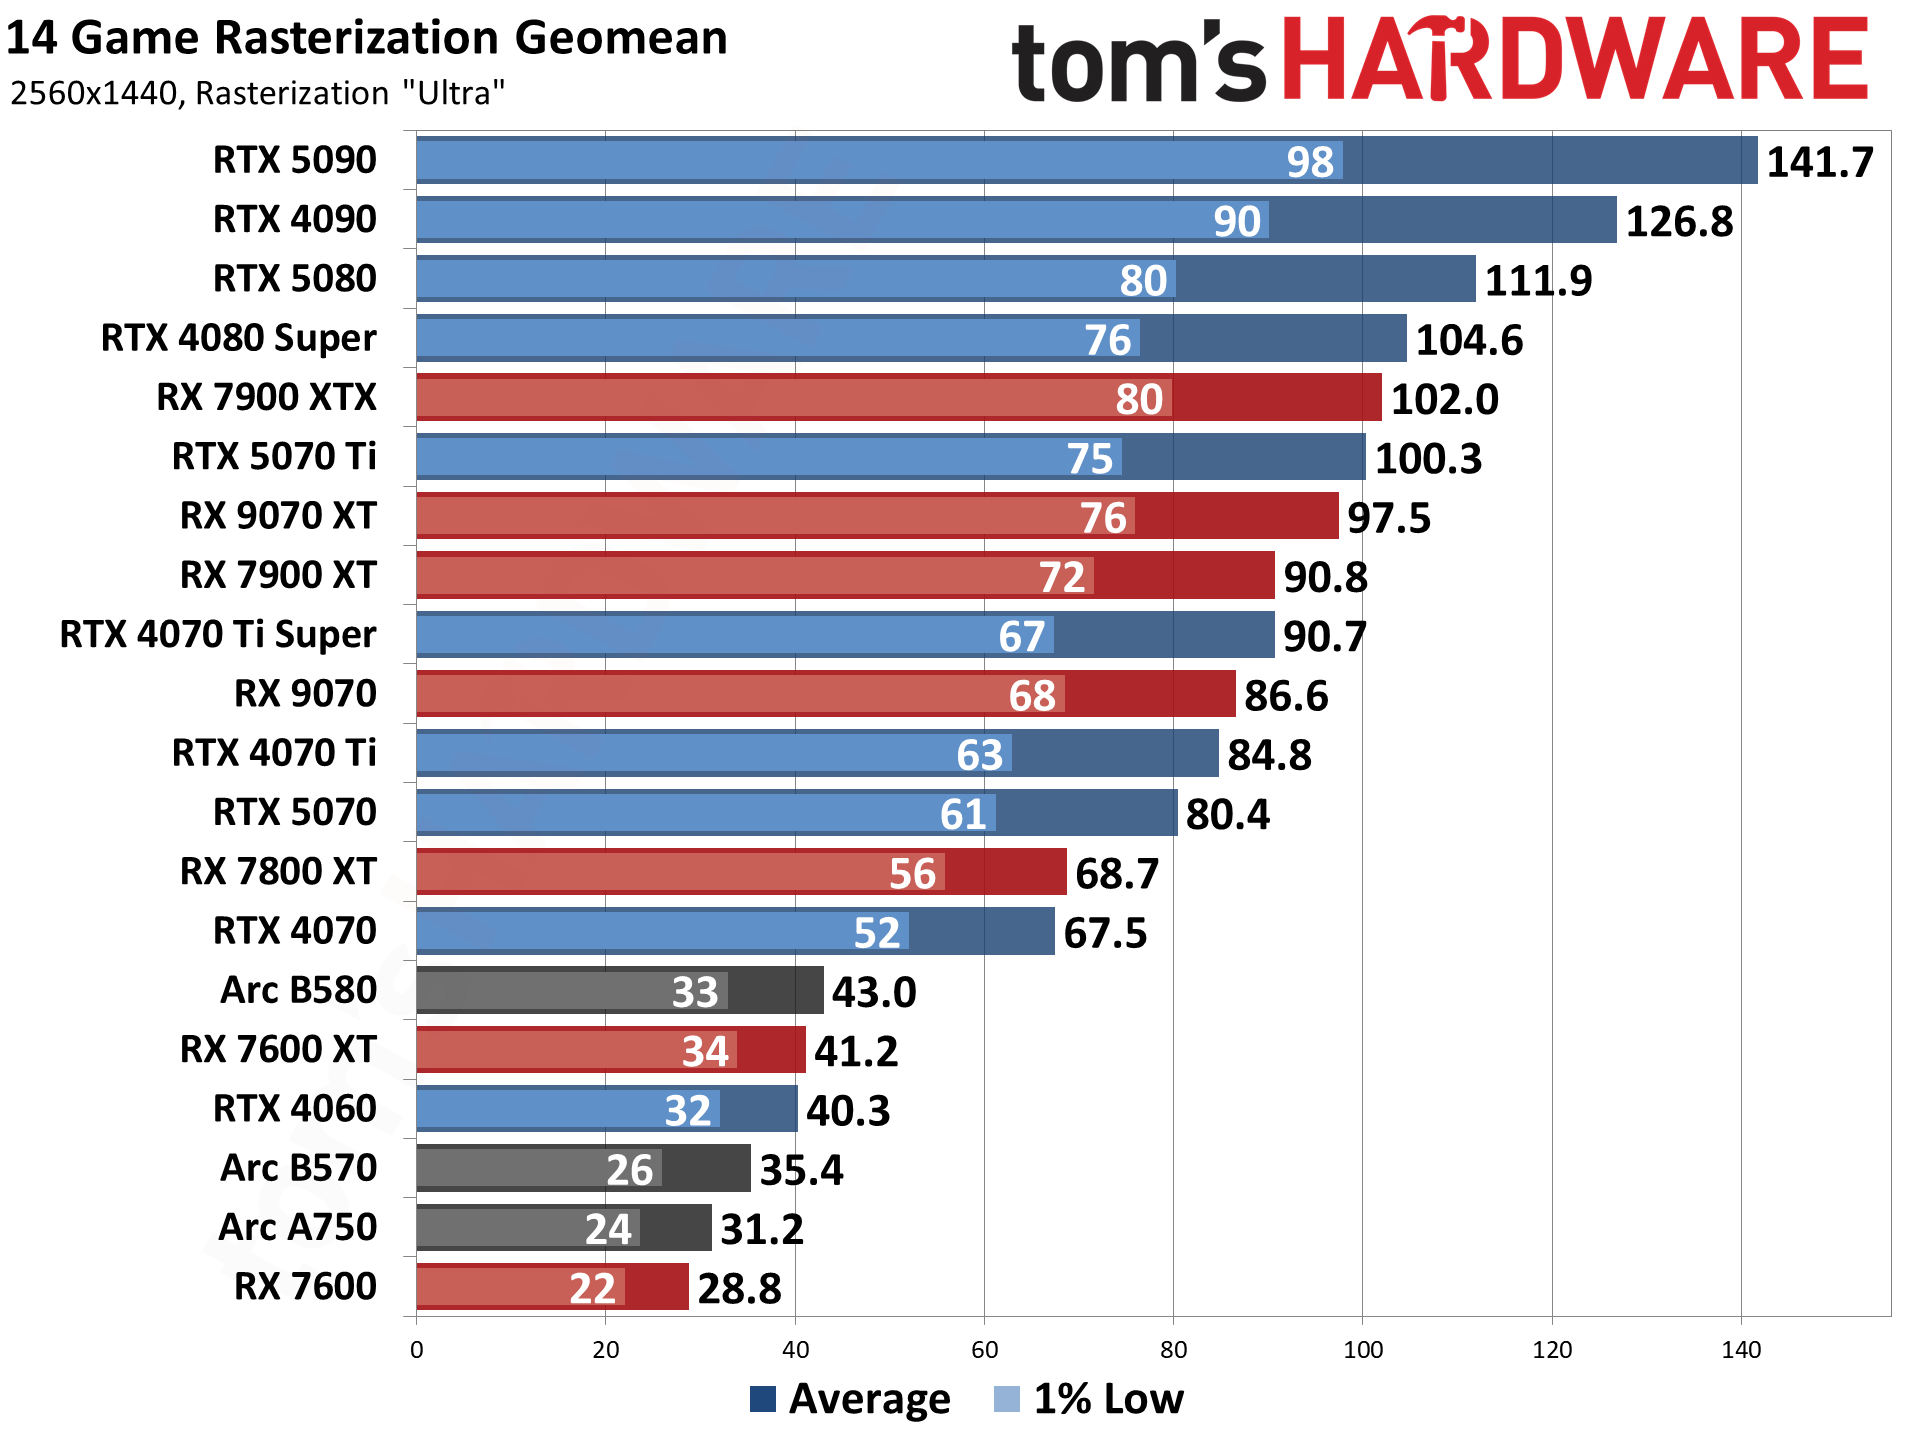
For our latest GPU benchmarks, we’re planning on testing nearly every GPU released in the past seven years (the start of the RTX / ray tracing era), and perhaps we’ll extend that even further — depending on how things progress. We test every card at 1080p medium and 1080p ultra, and sort the table by the 1080p ultra results. Where it makes sense, we also test at 1440p ultra and 4K ultra.
All the scores are scaled relative to the top-ranking 1080p ultra card, which is the GeForce RTX 5090. What else would you expect from a GPU that costs two grand, and often sells at far higher prices?
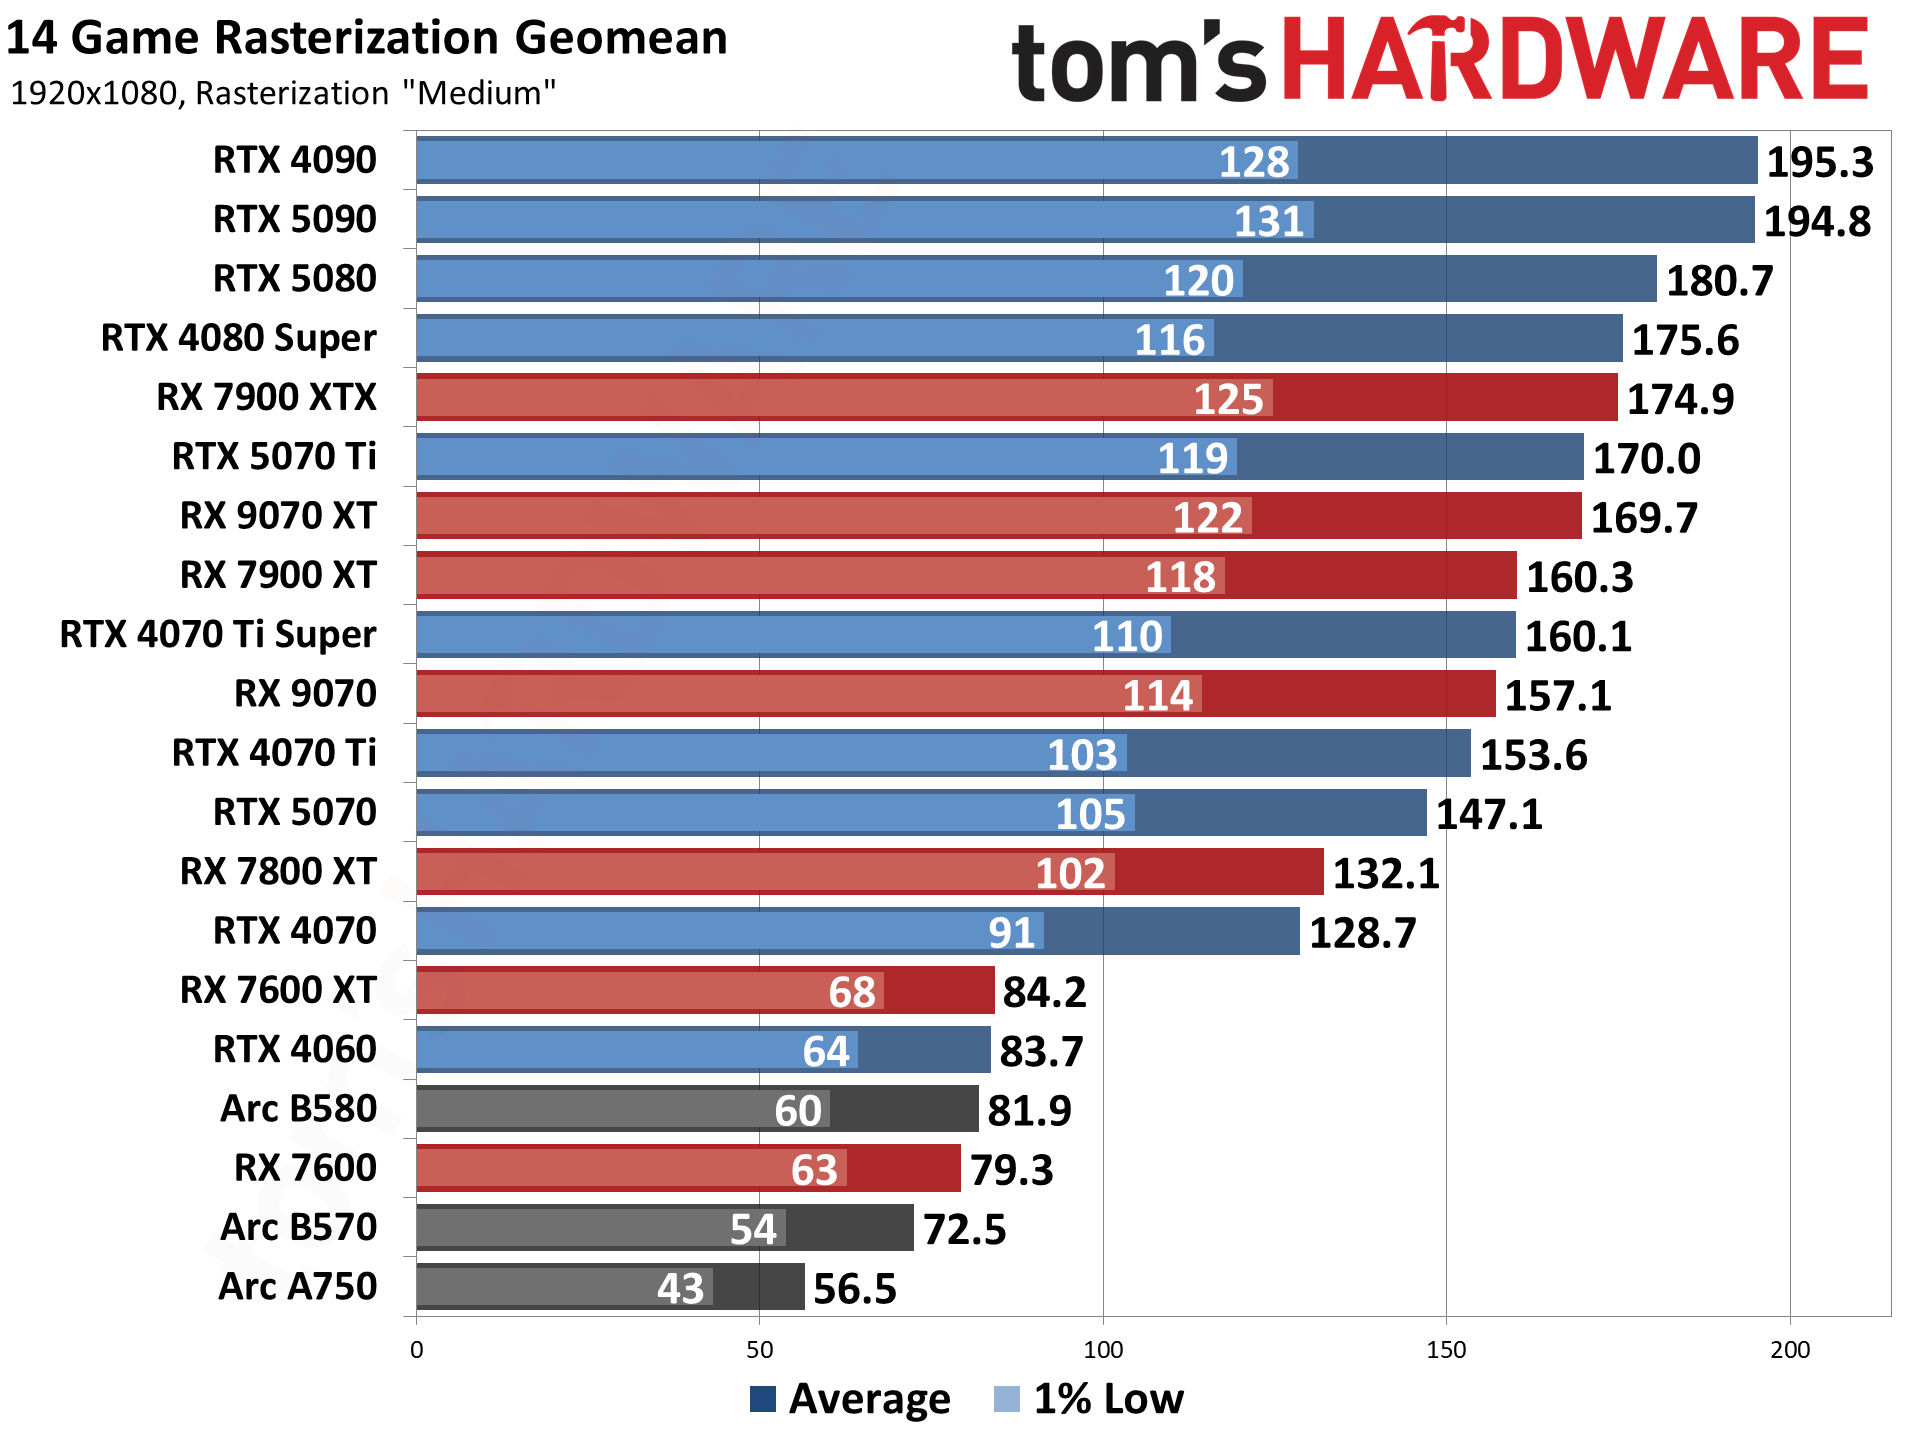
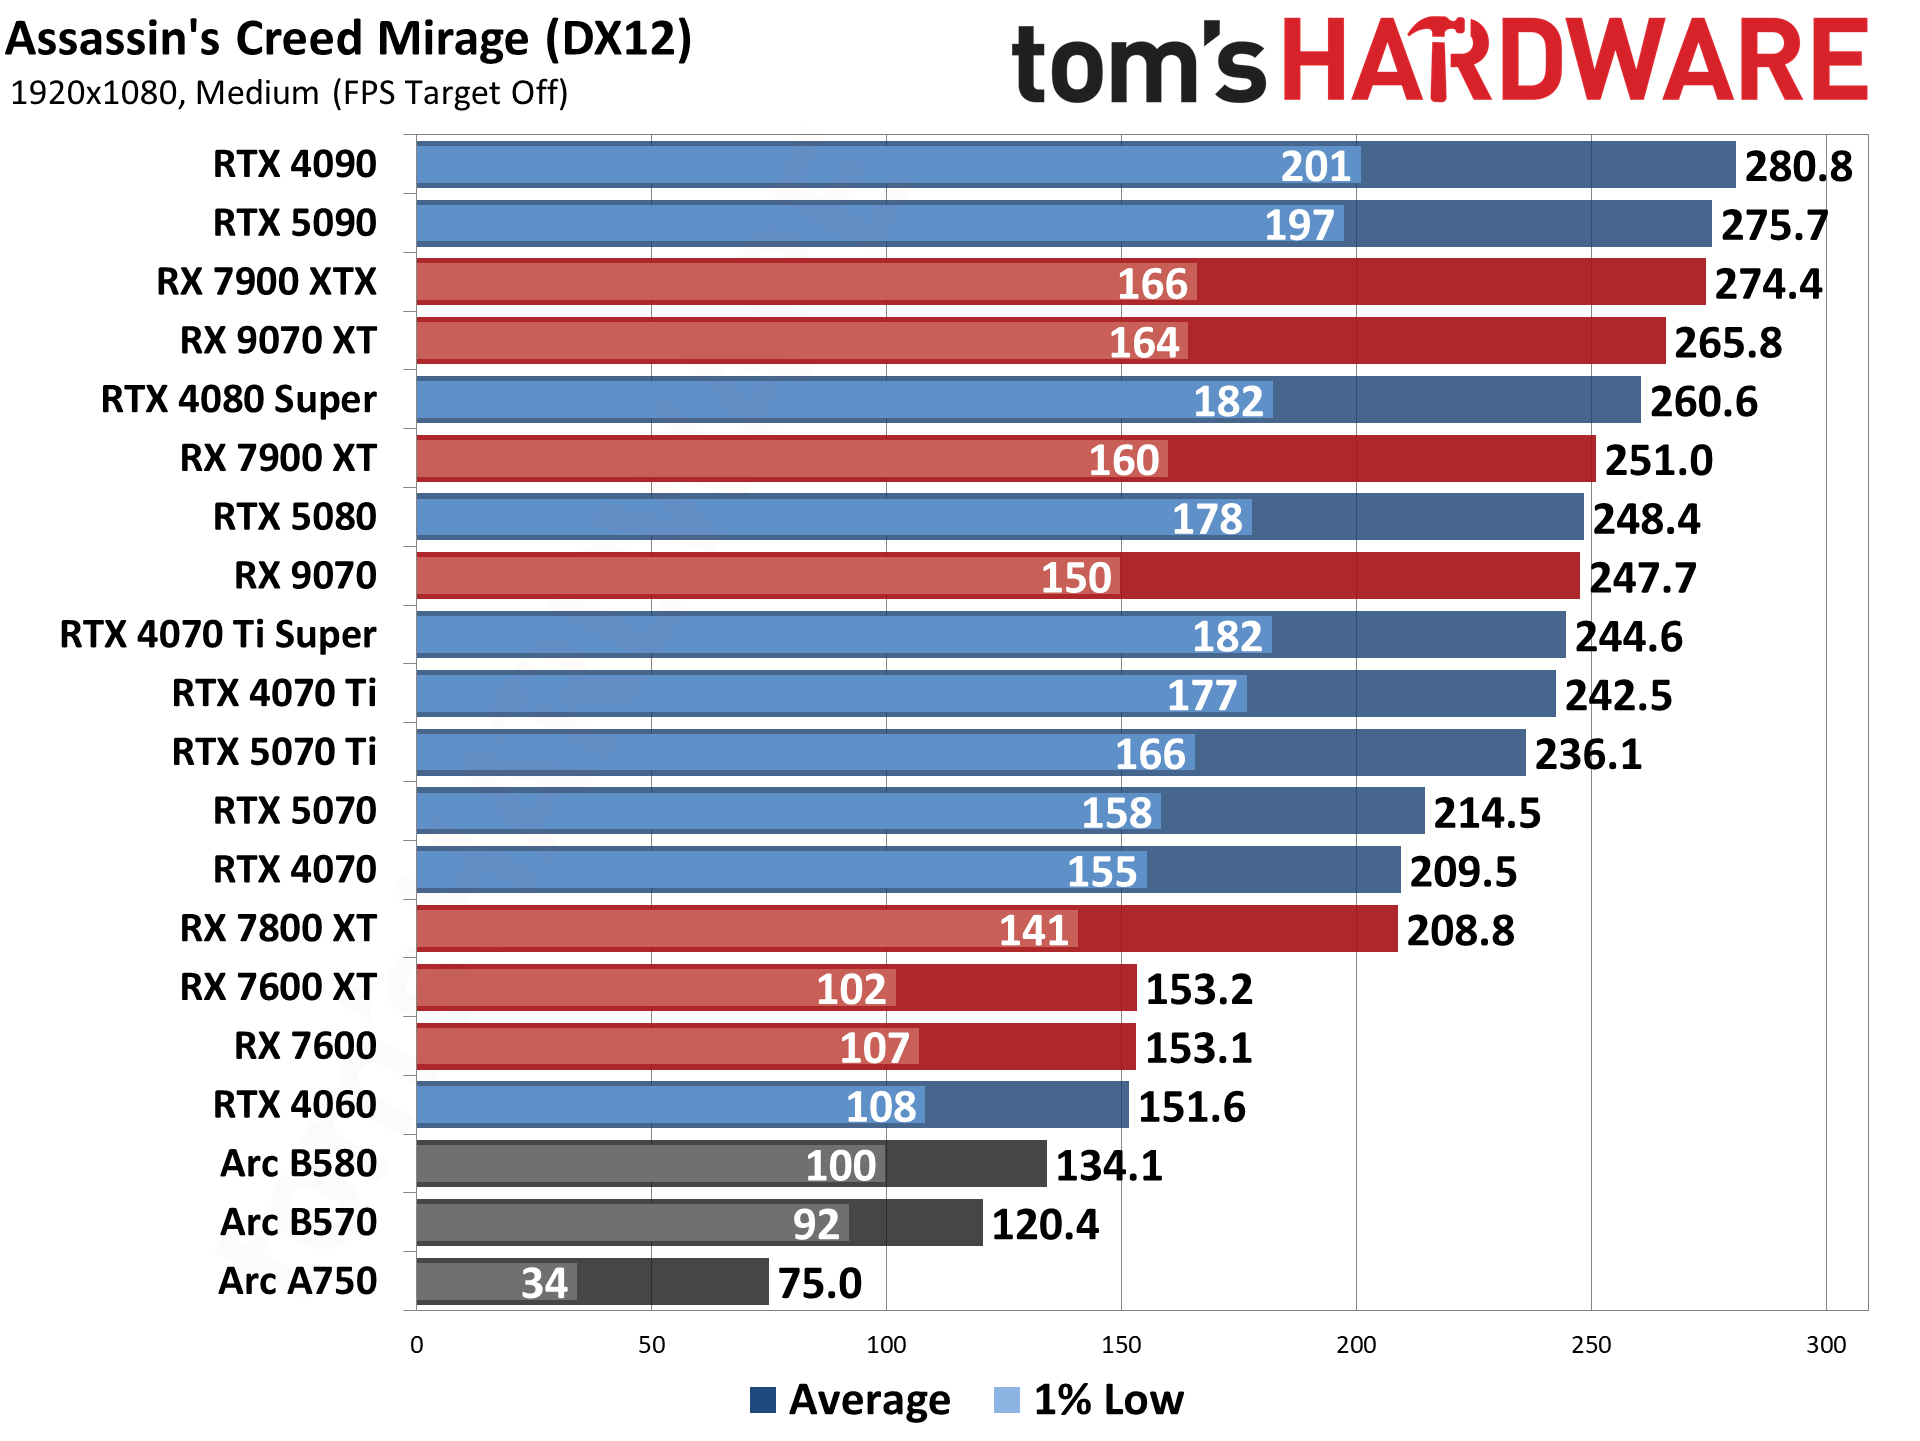
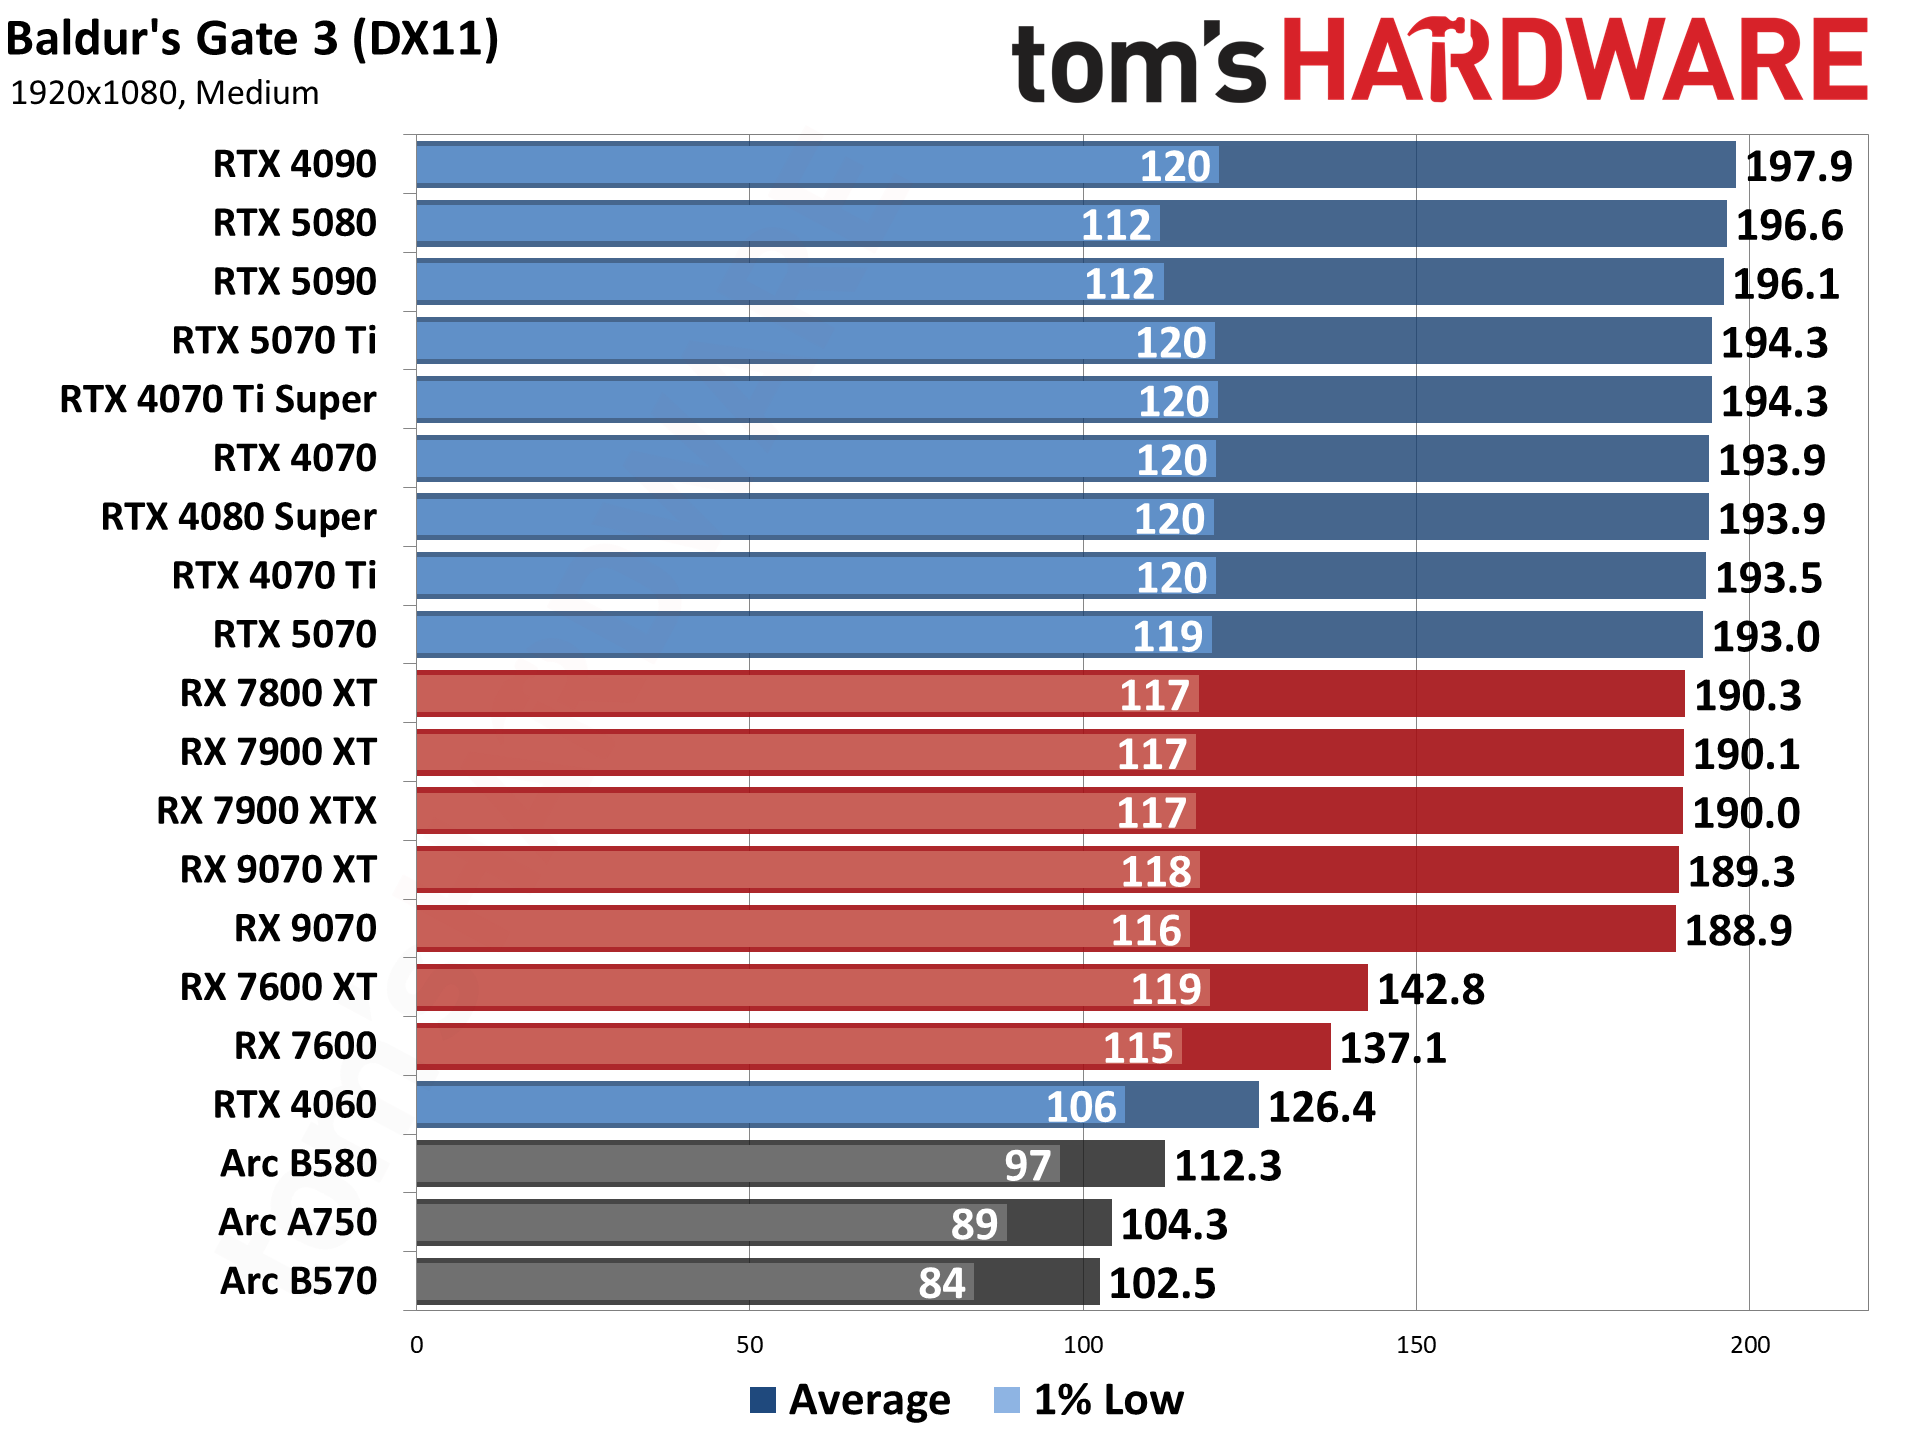
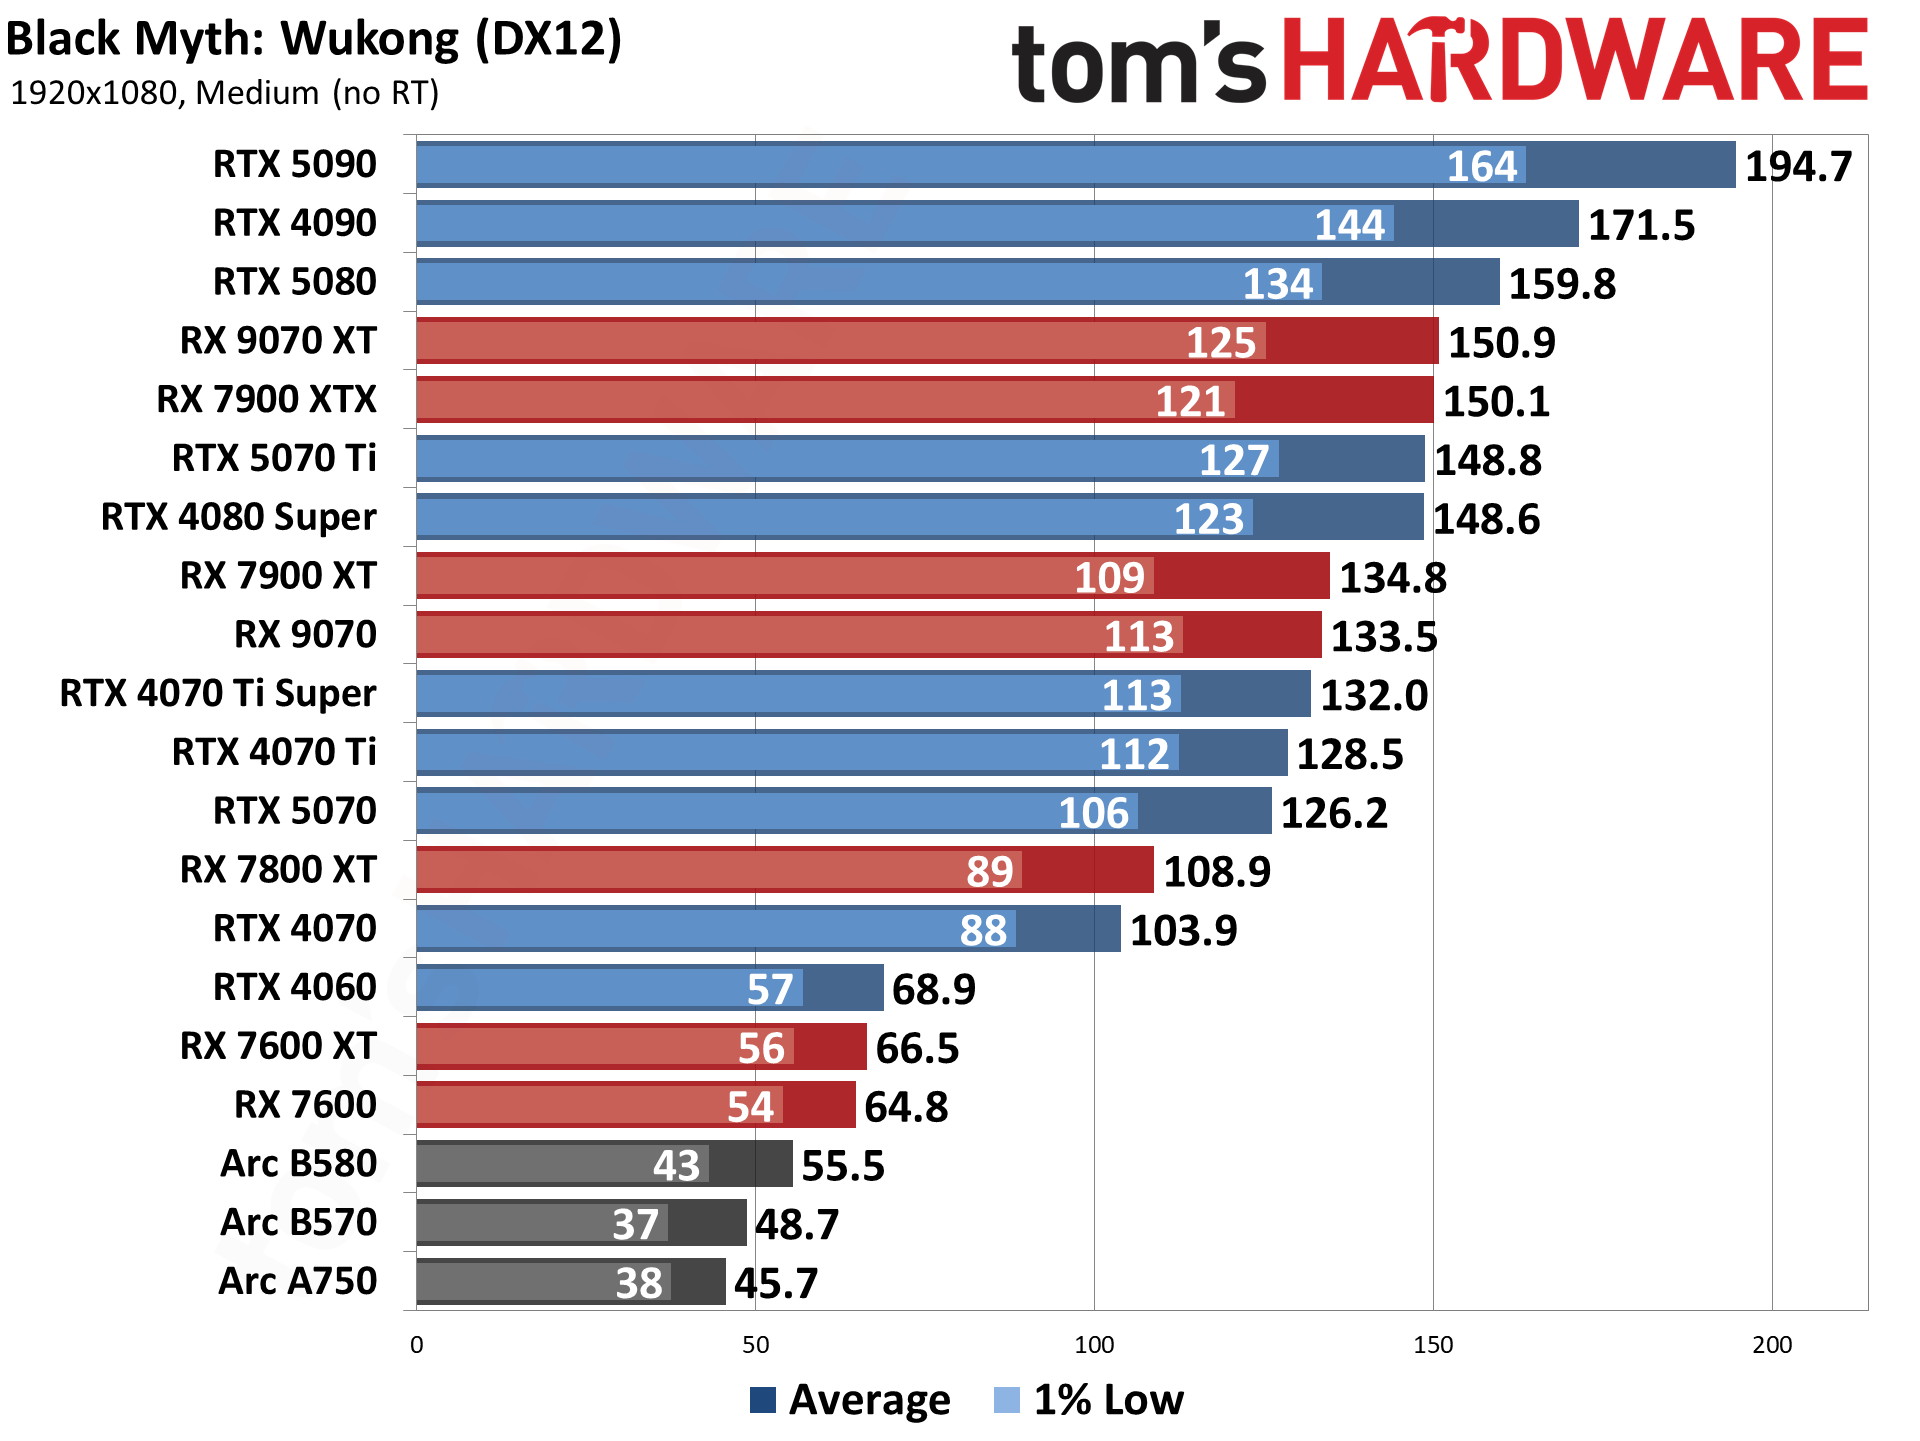
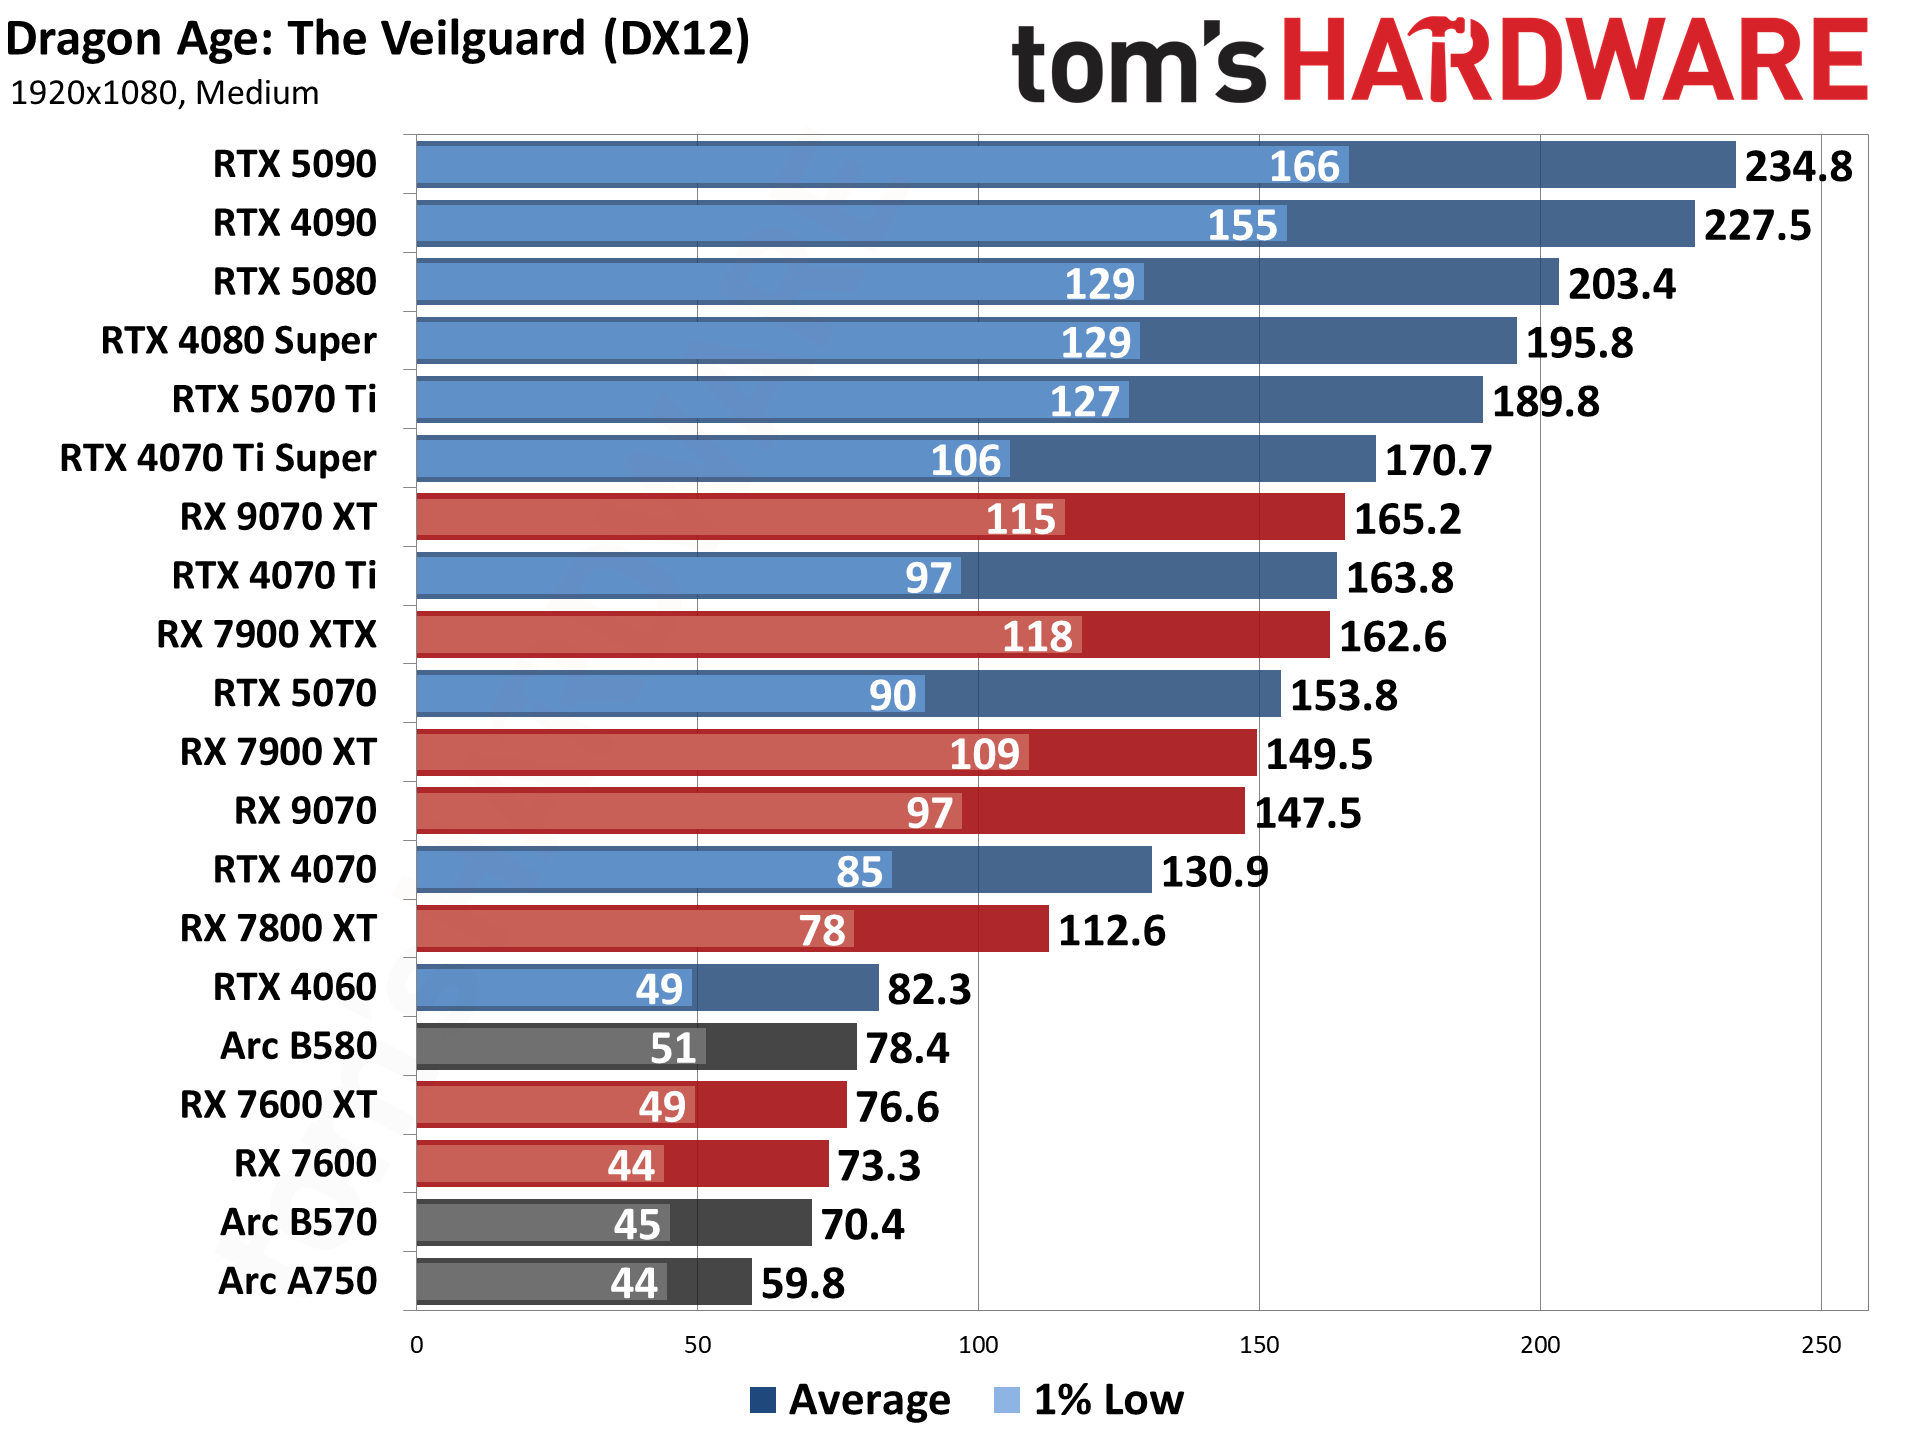
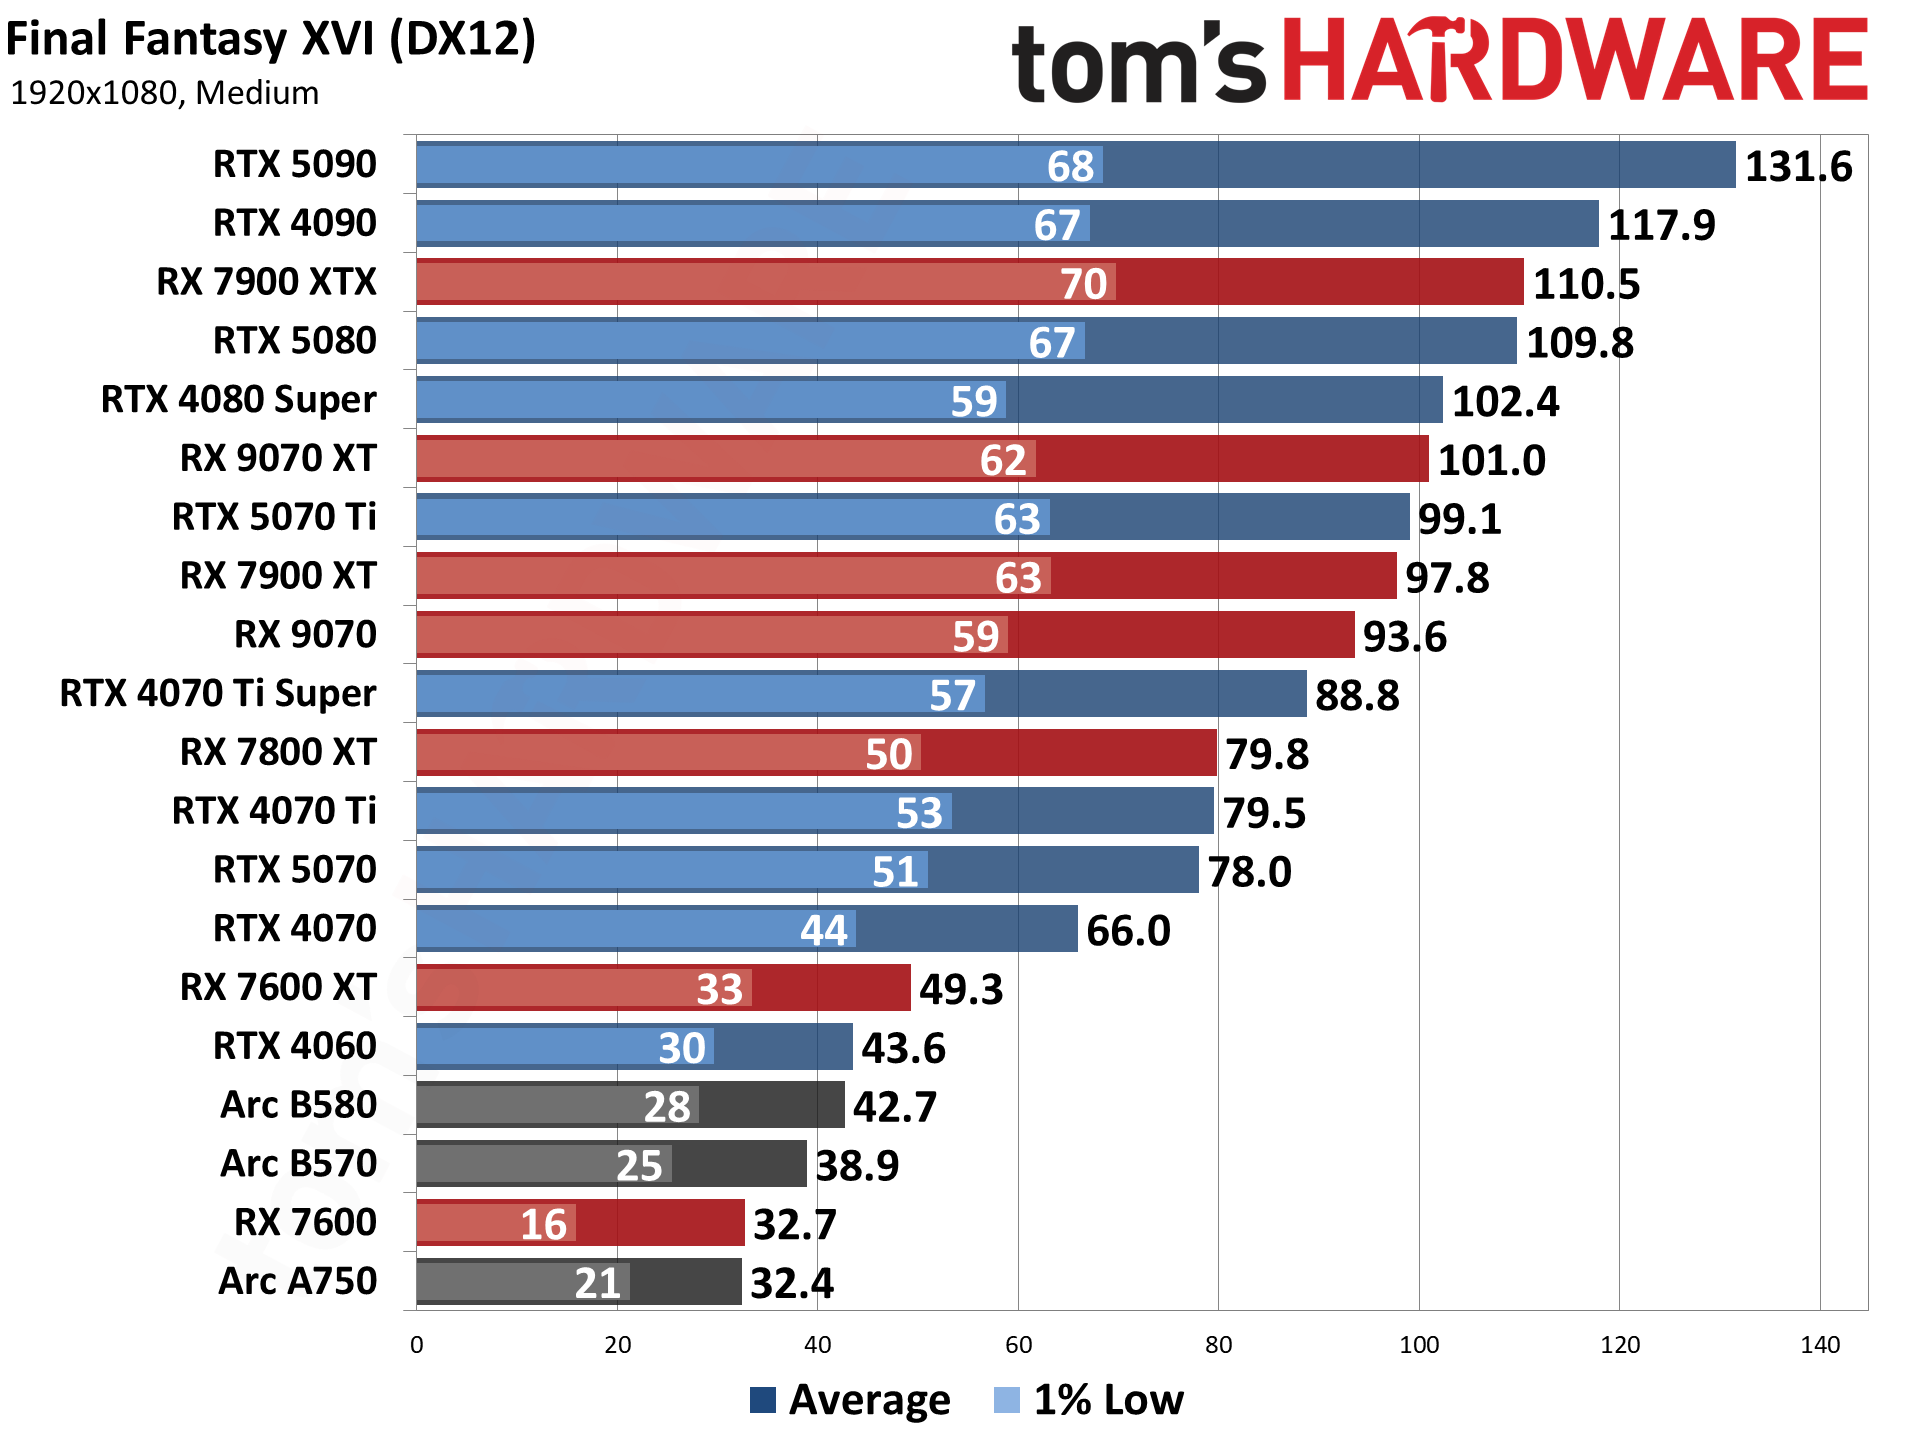
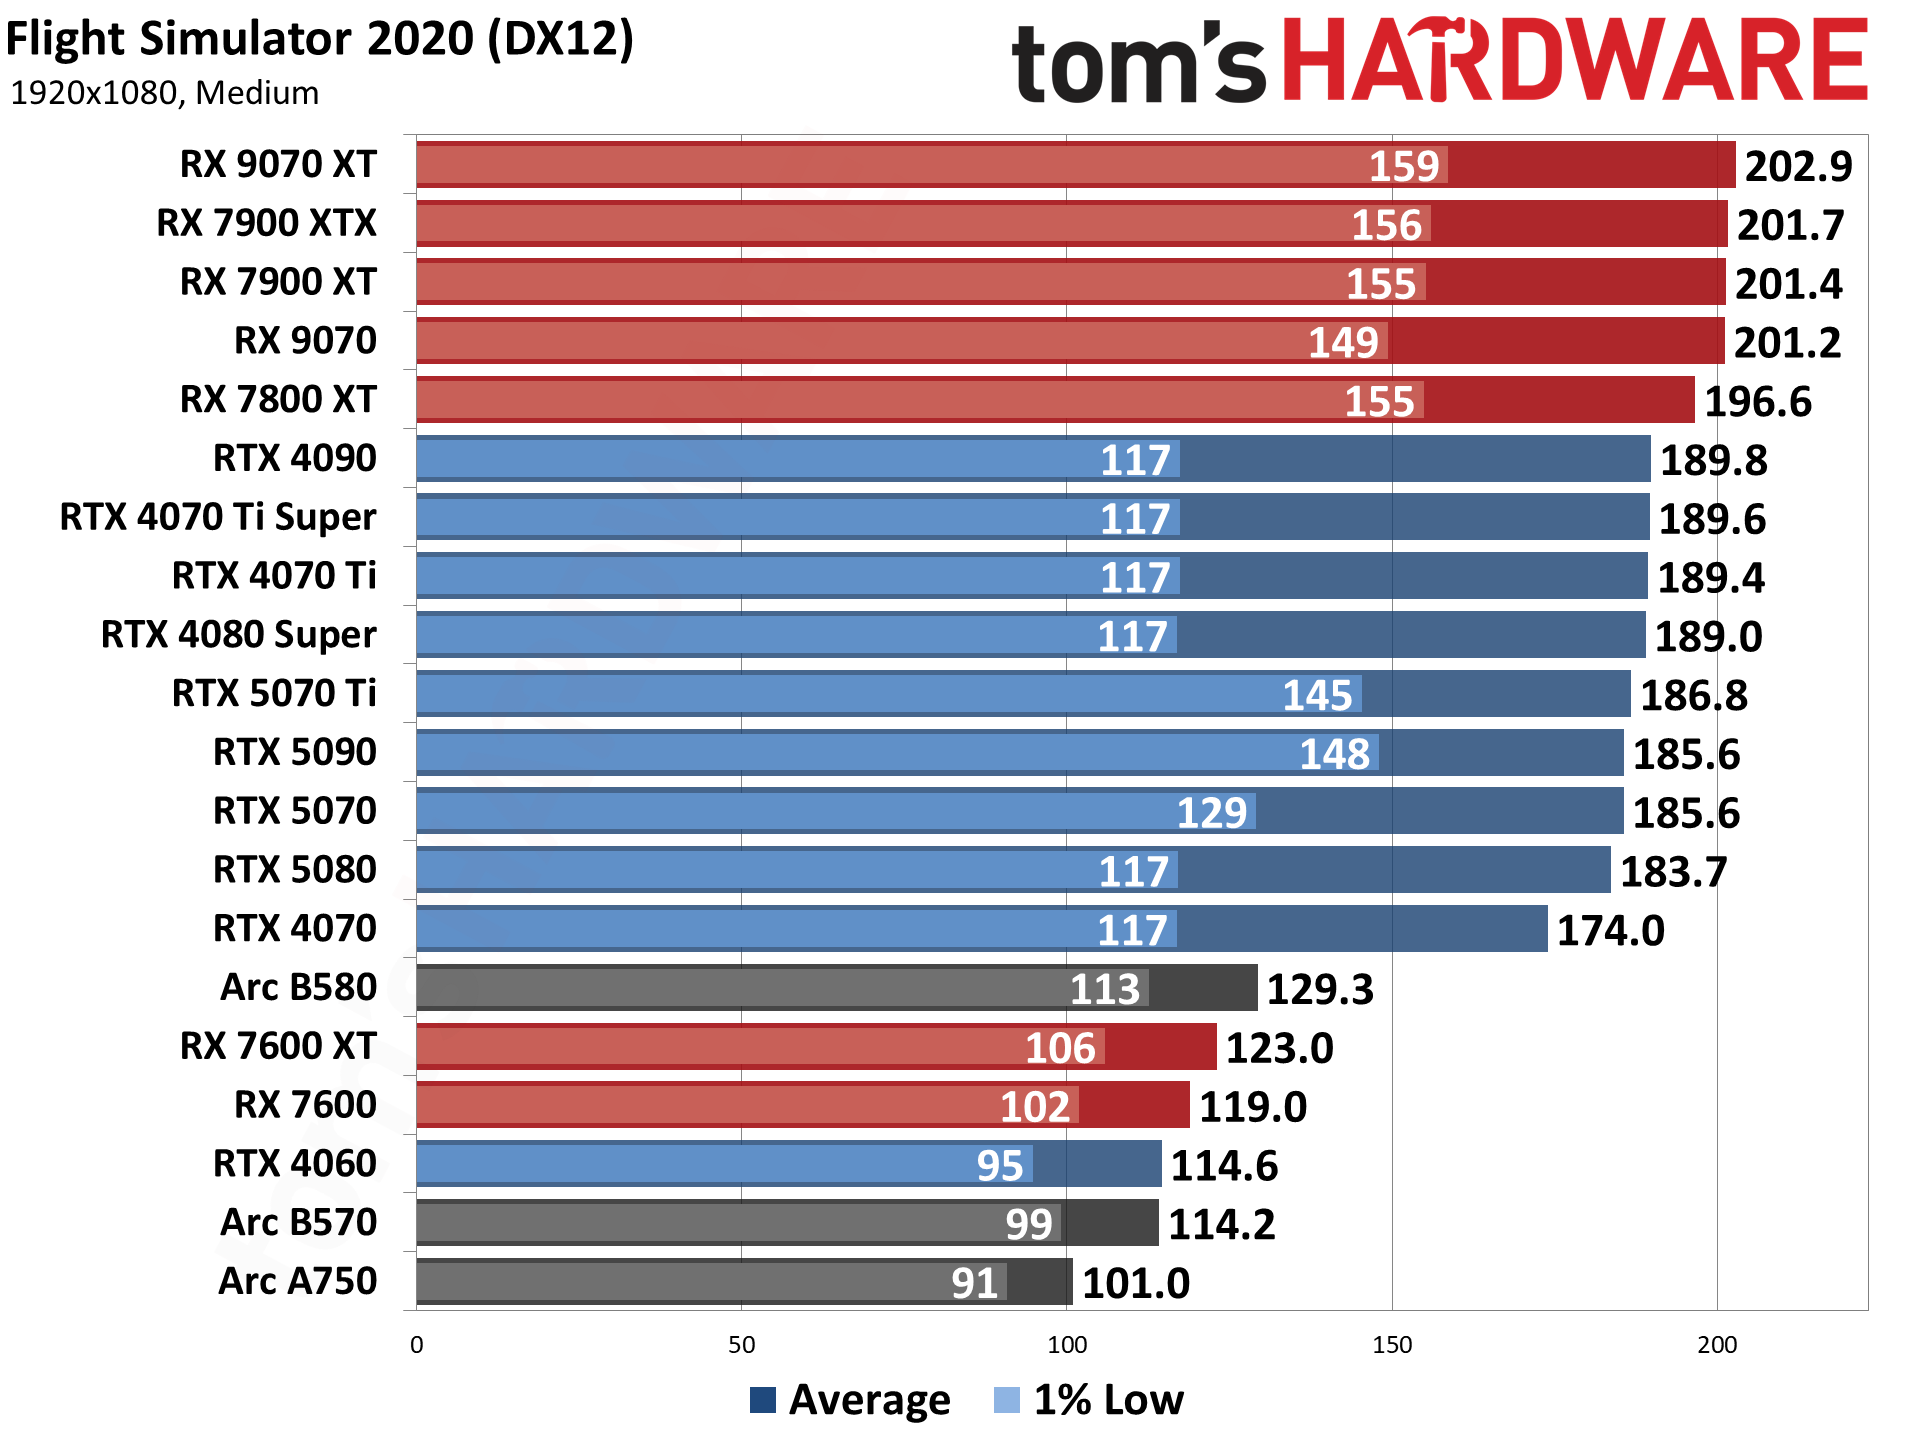
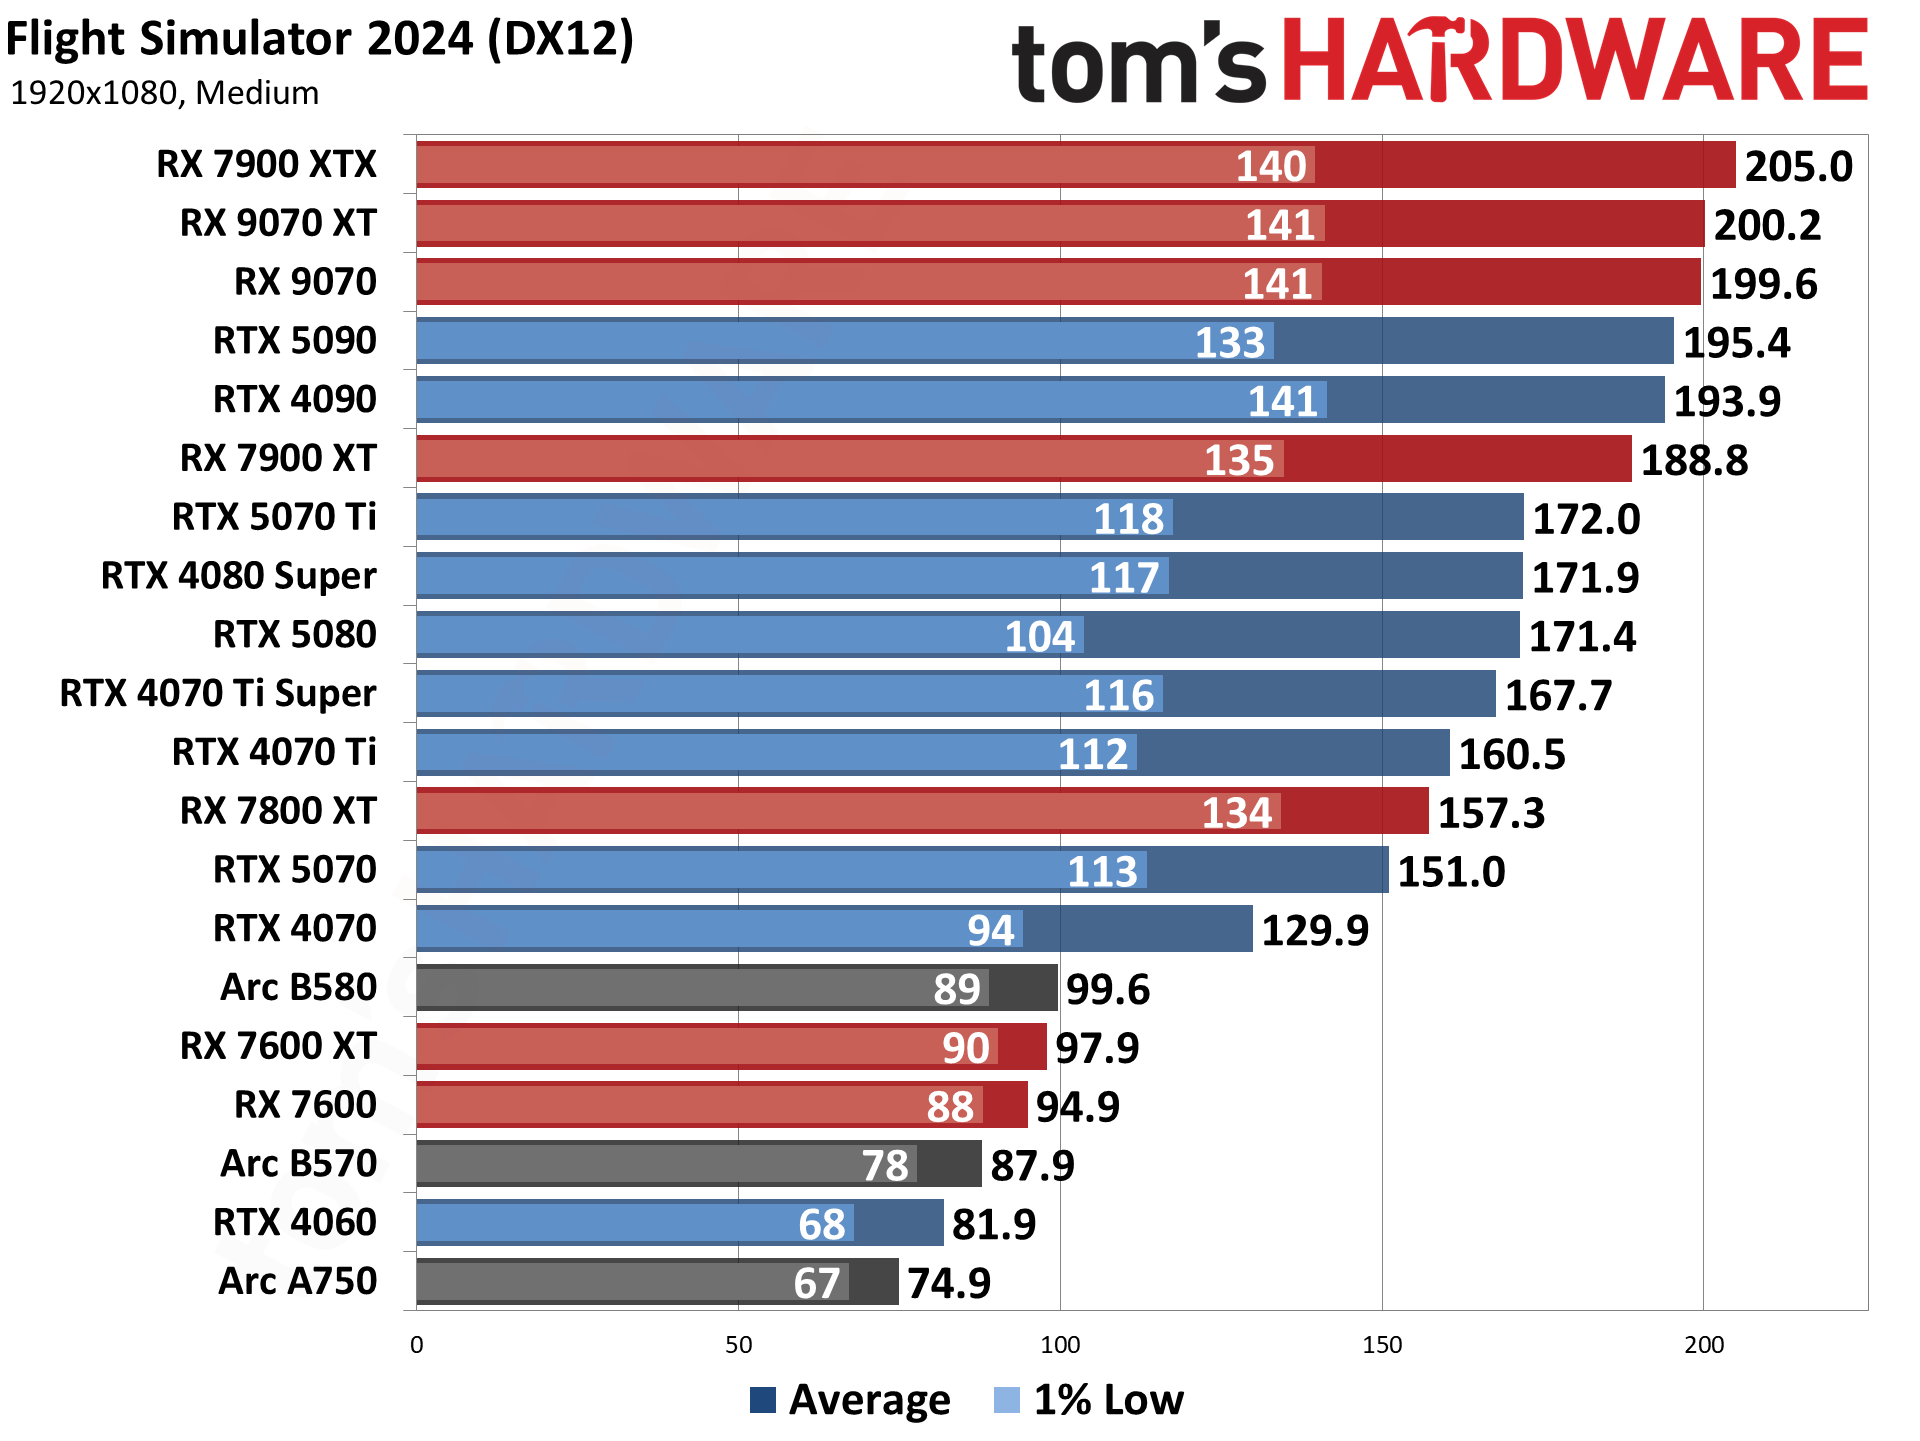
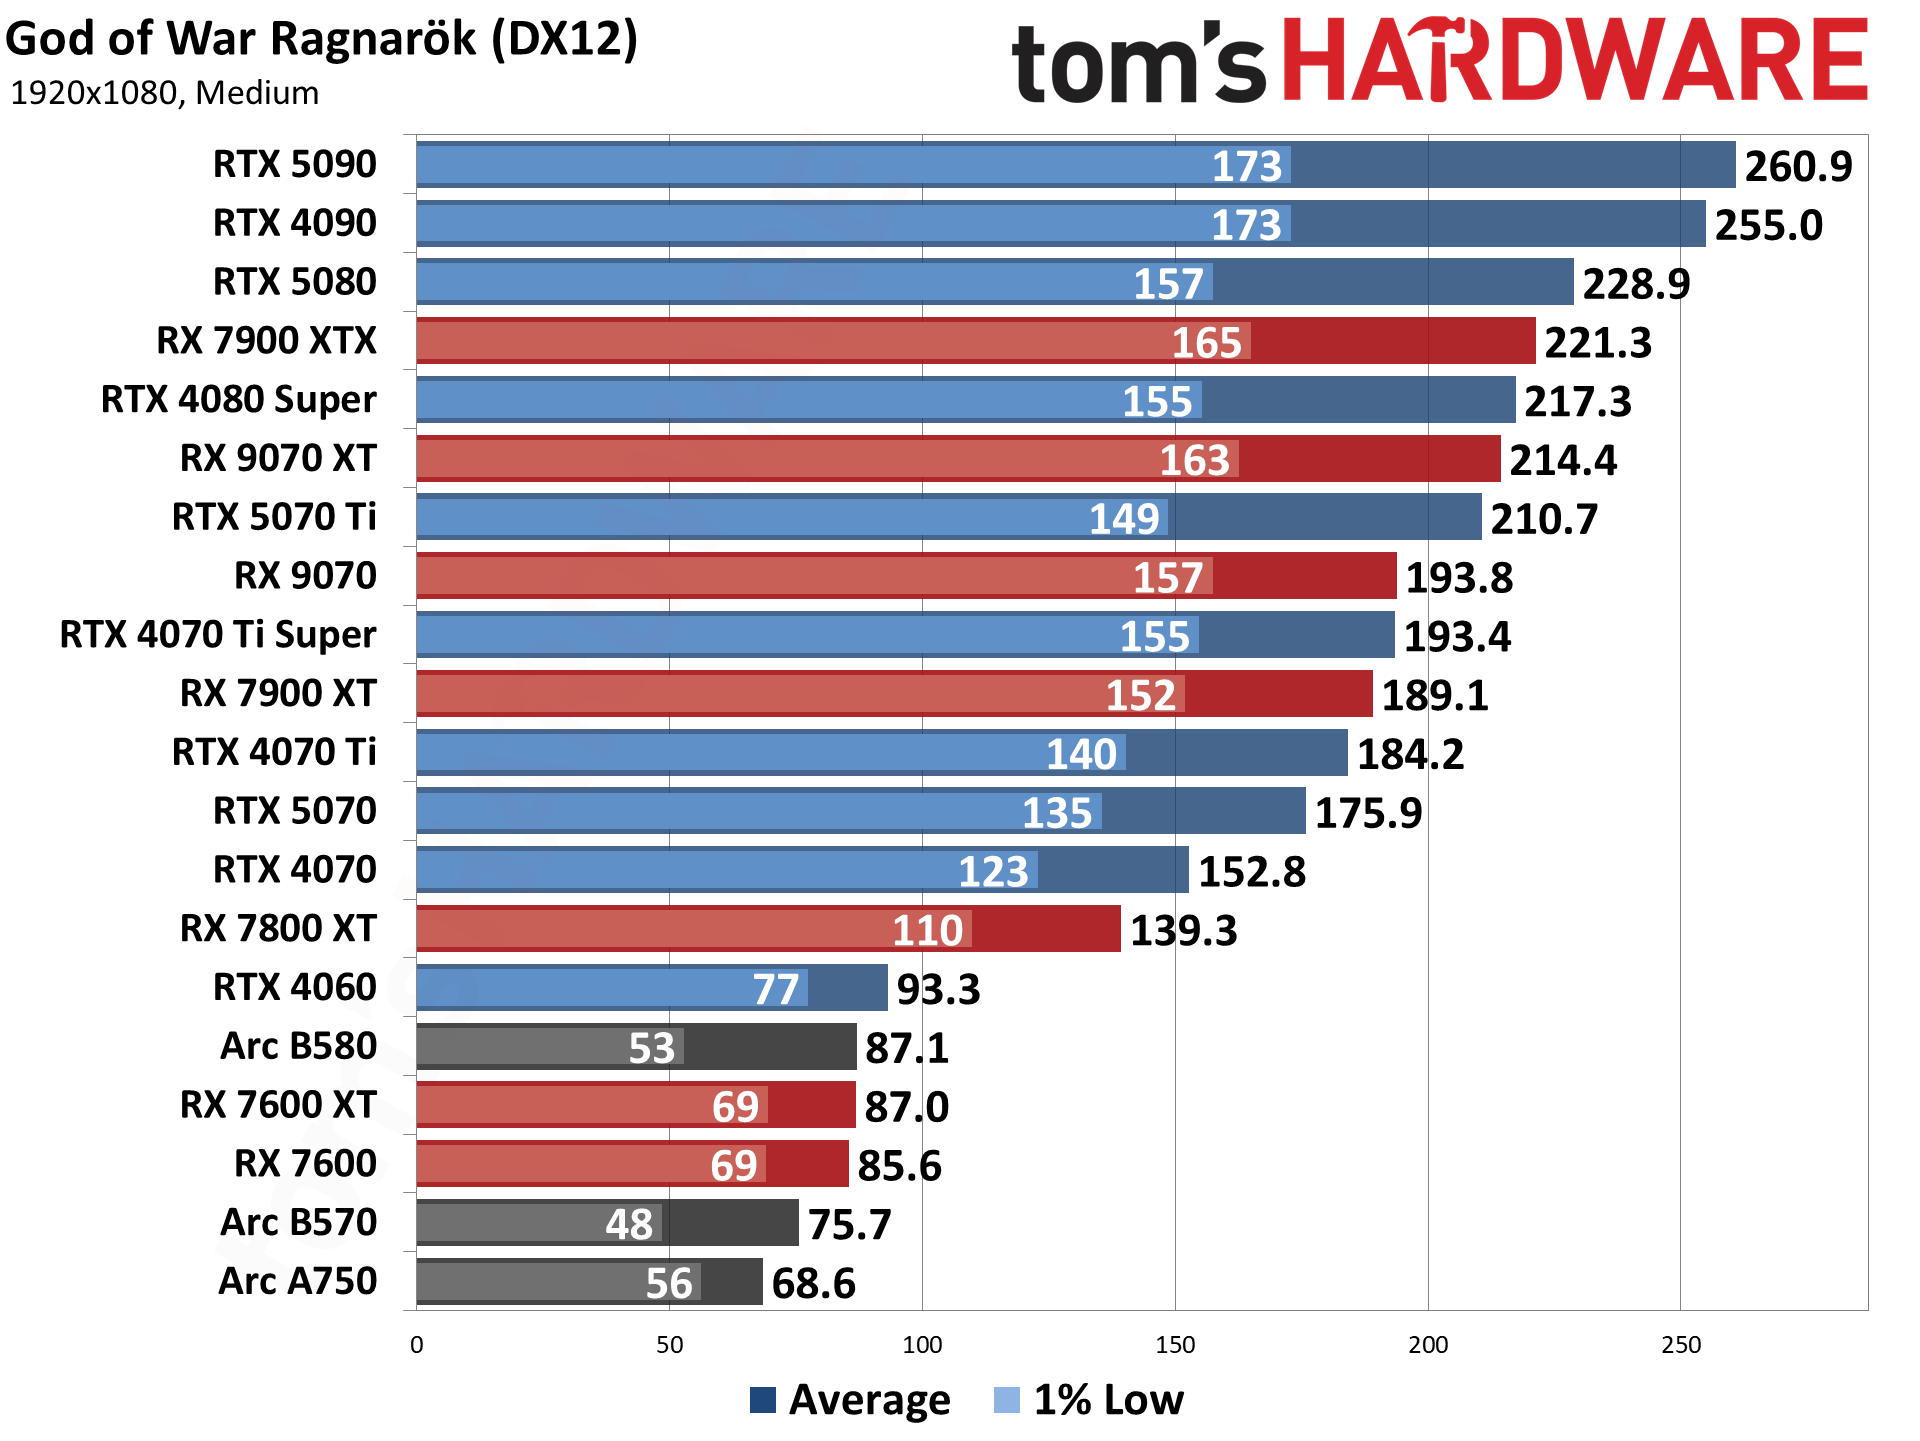
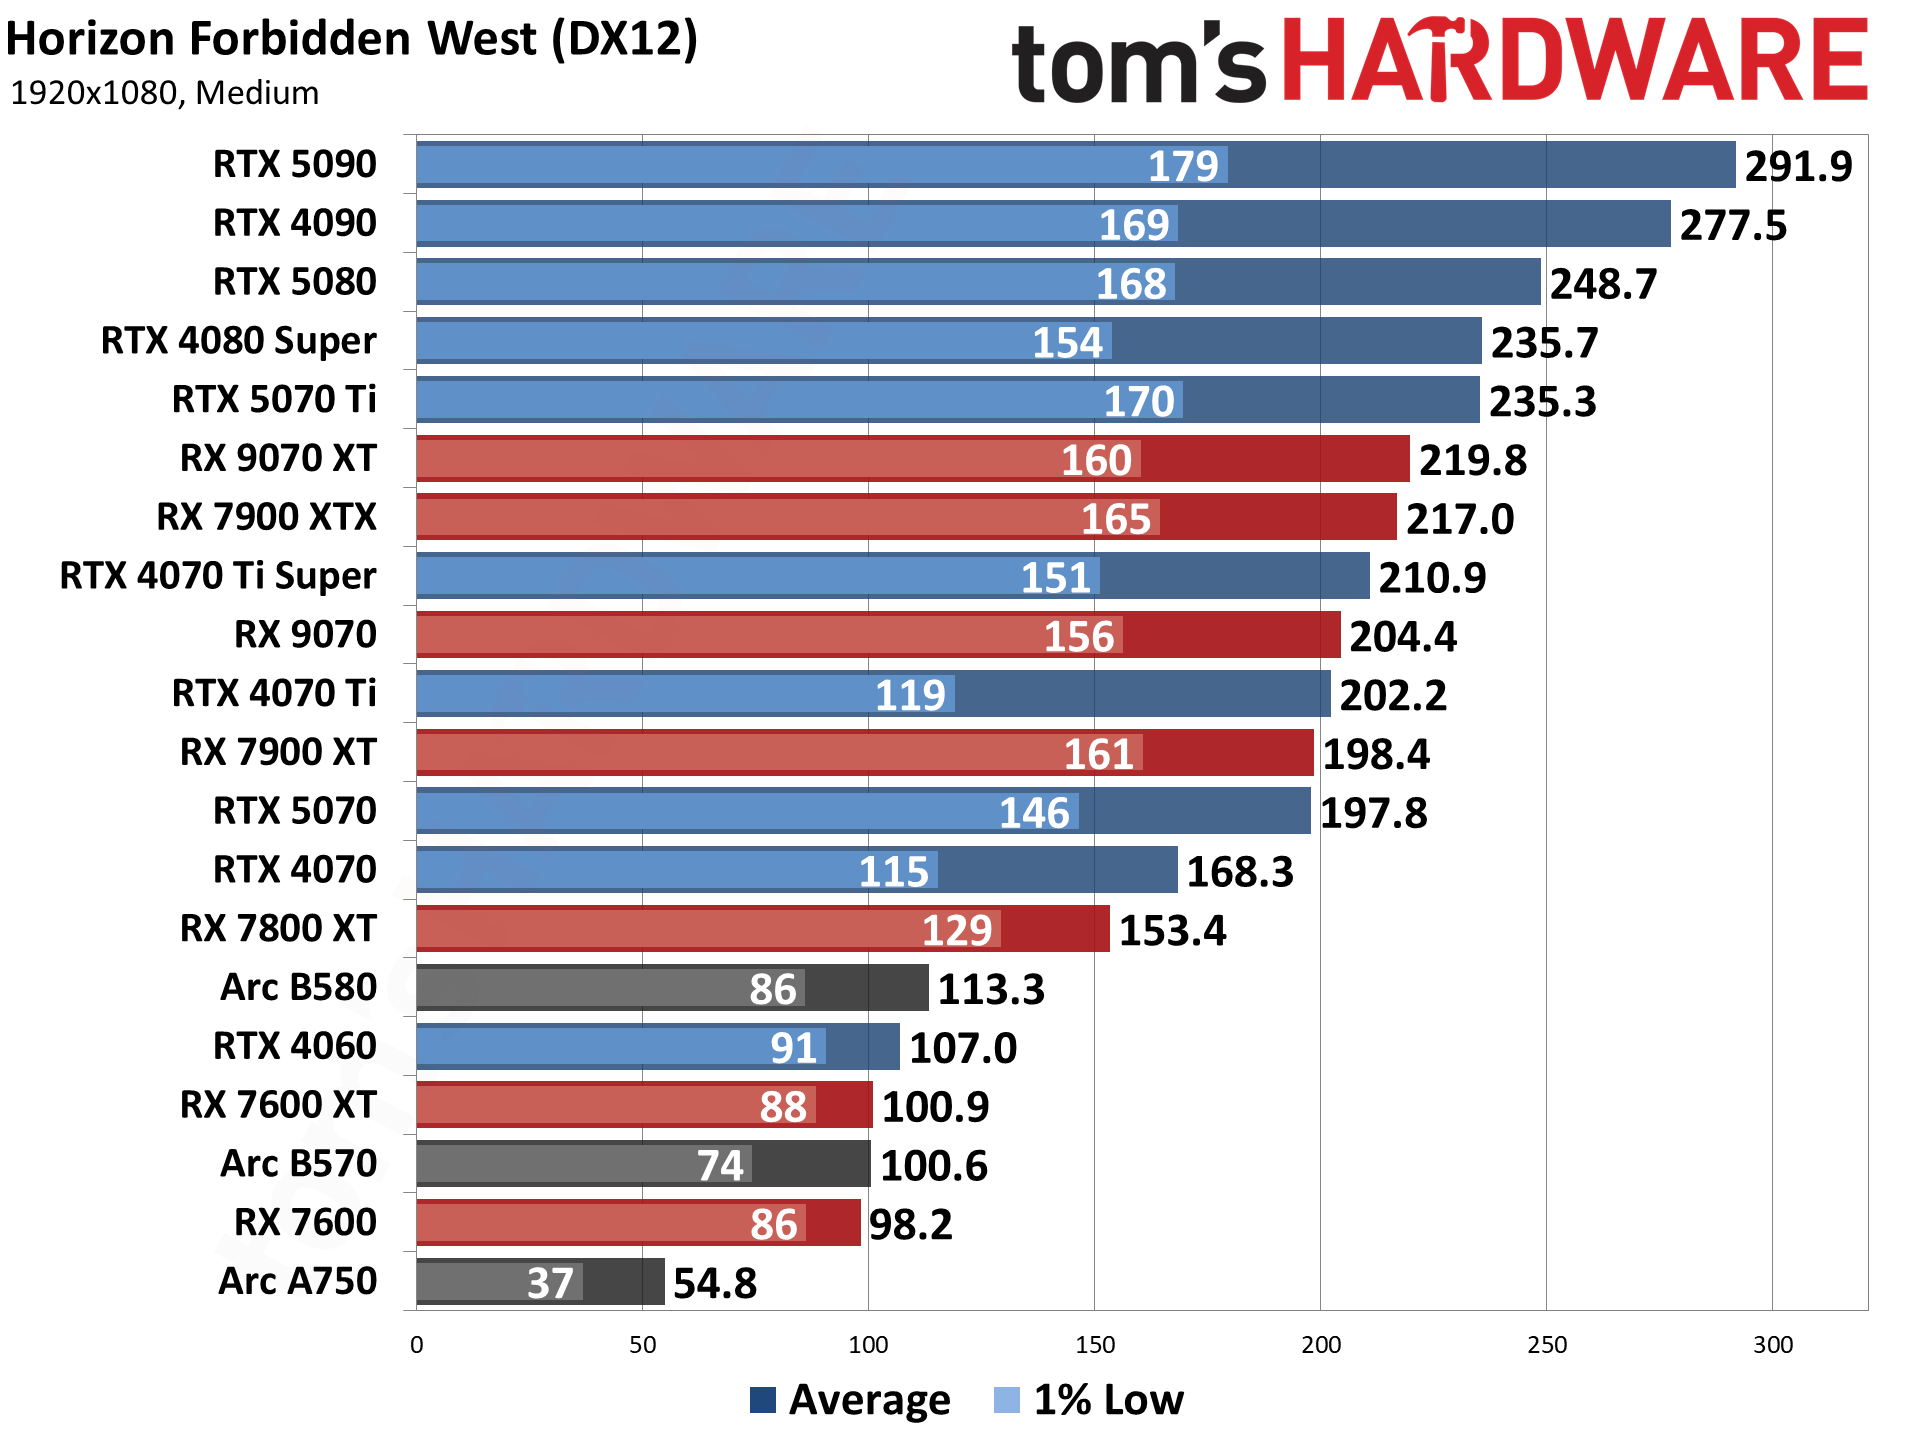
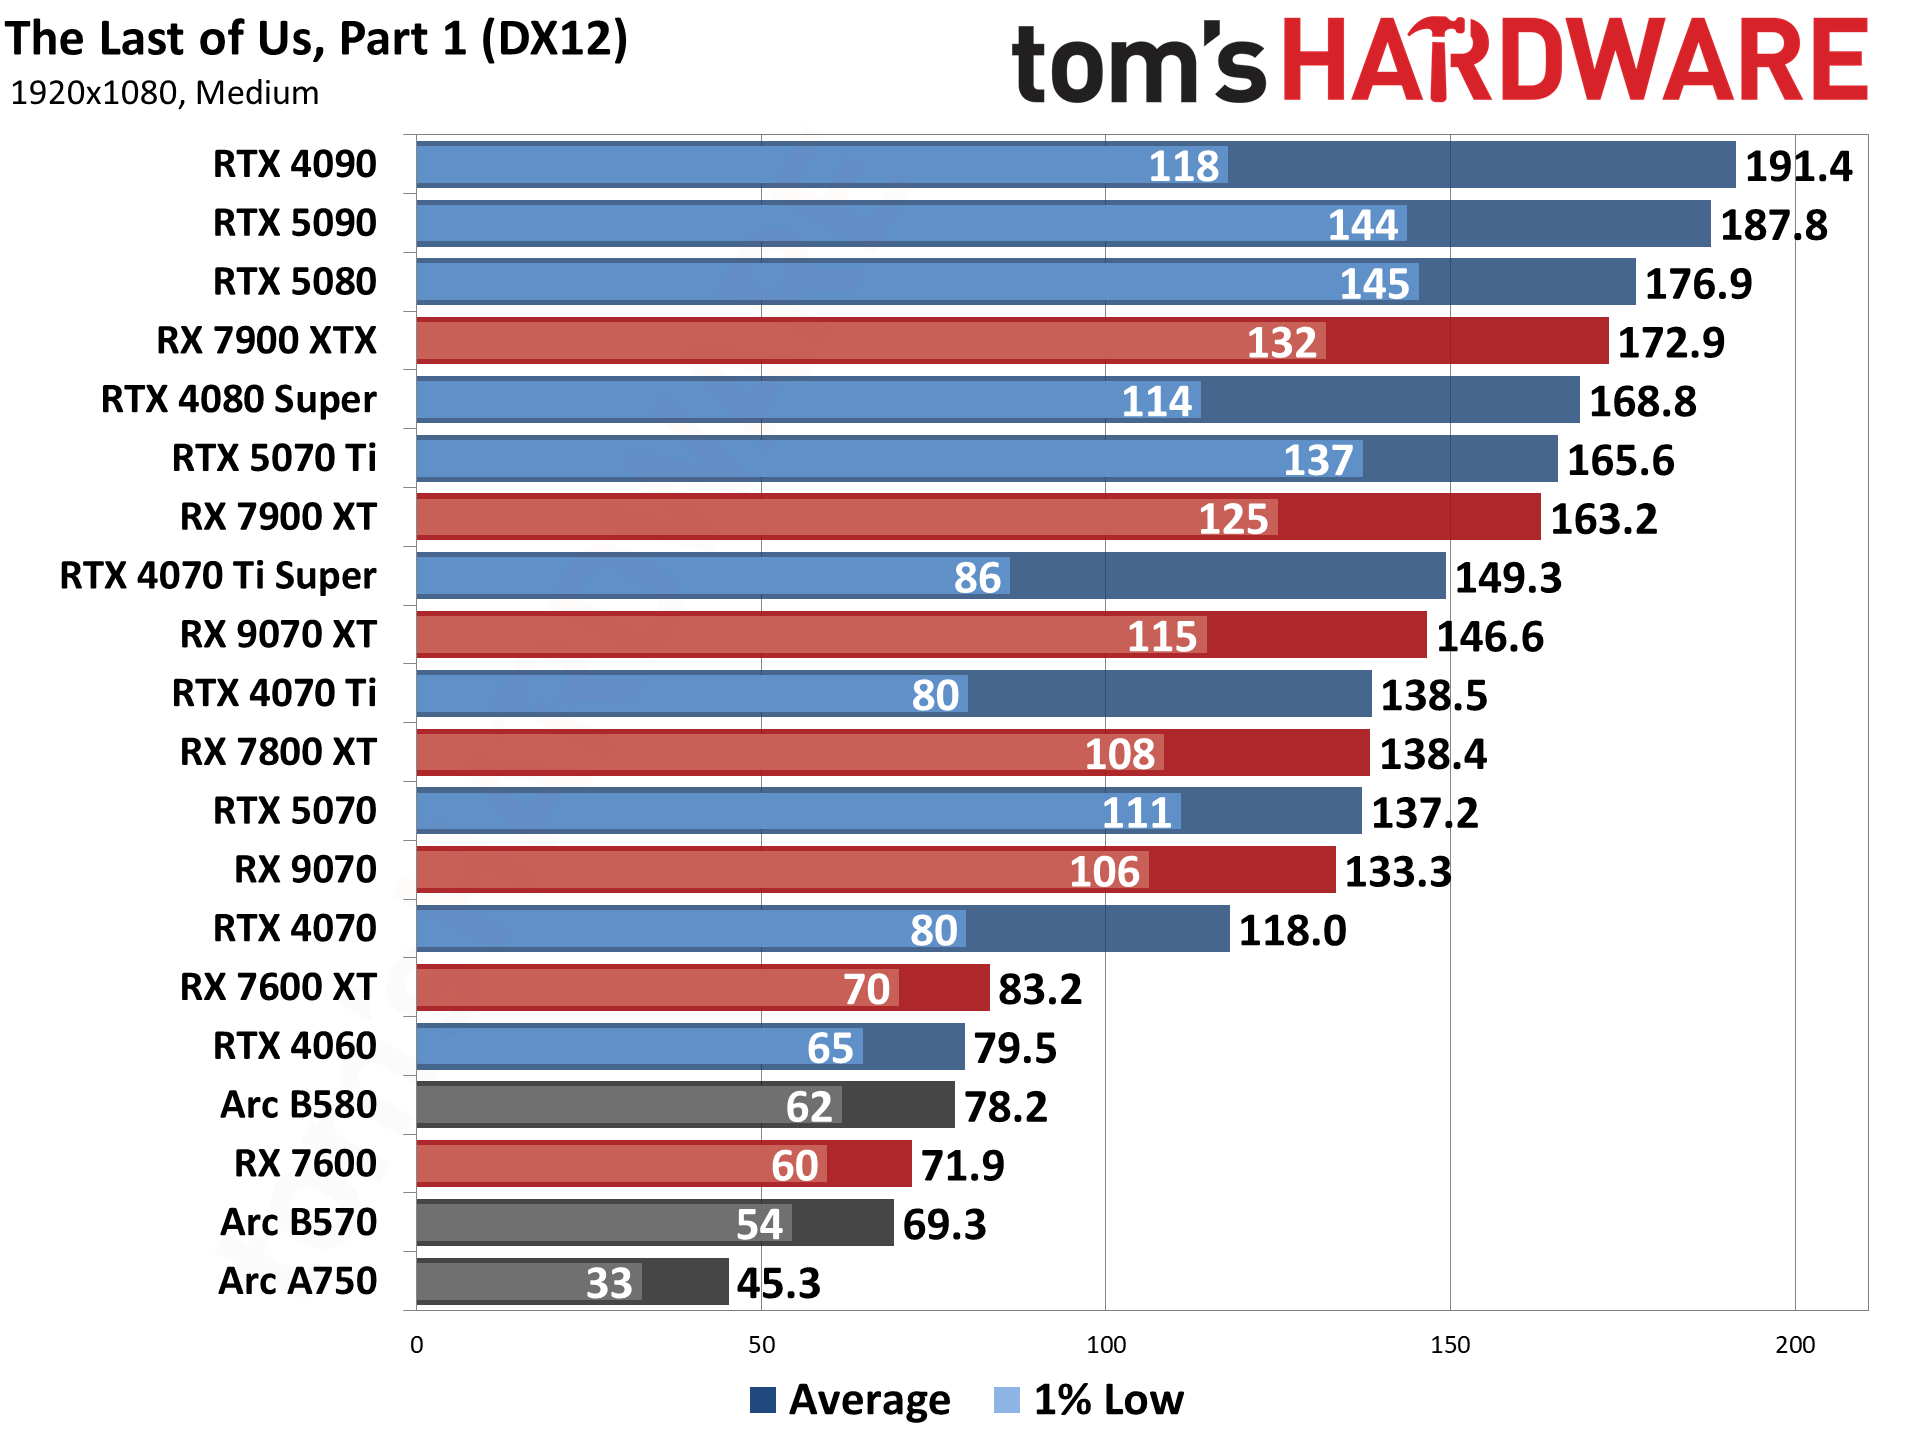
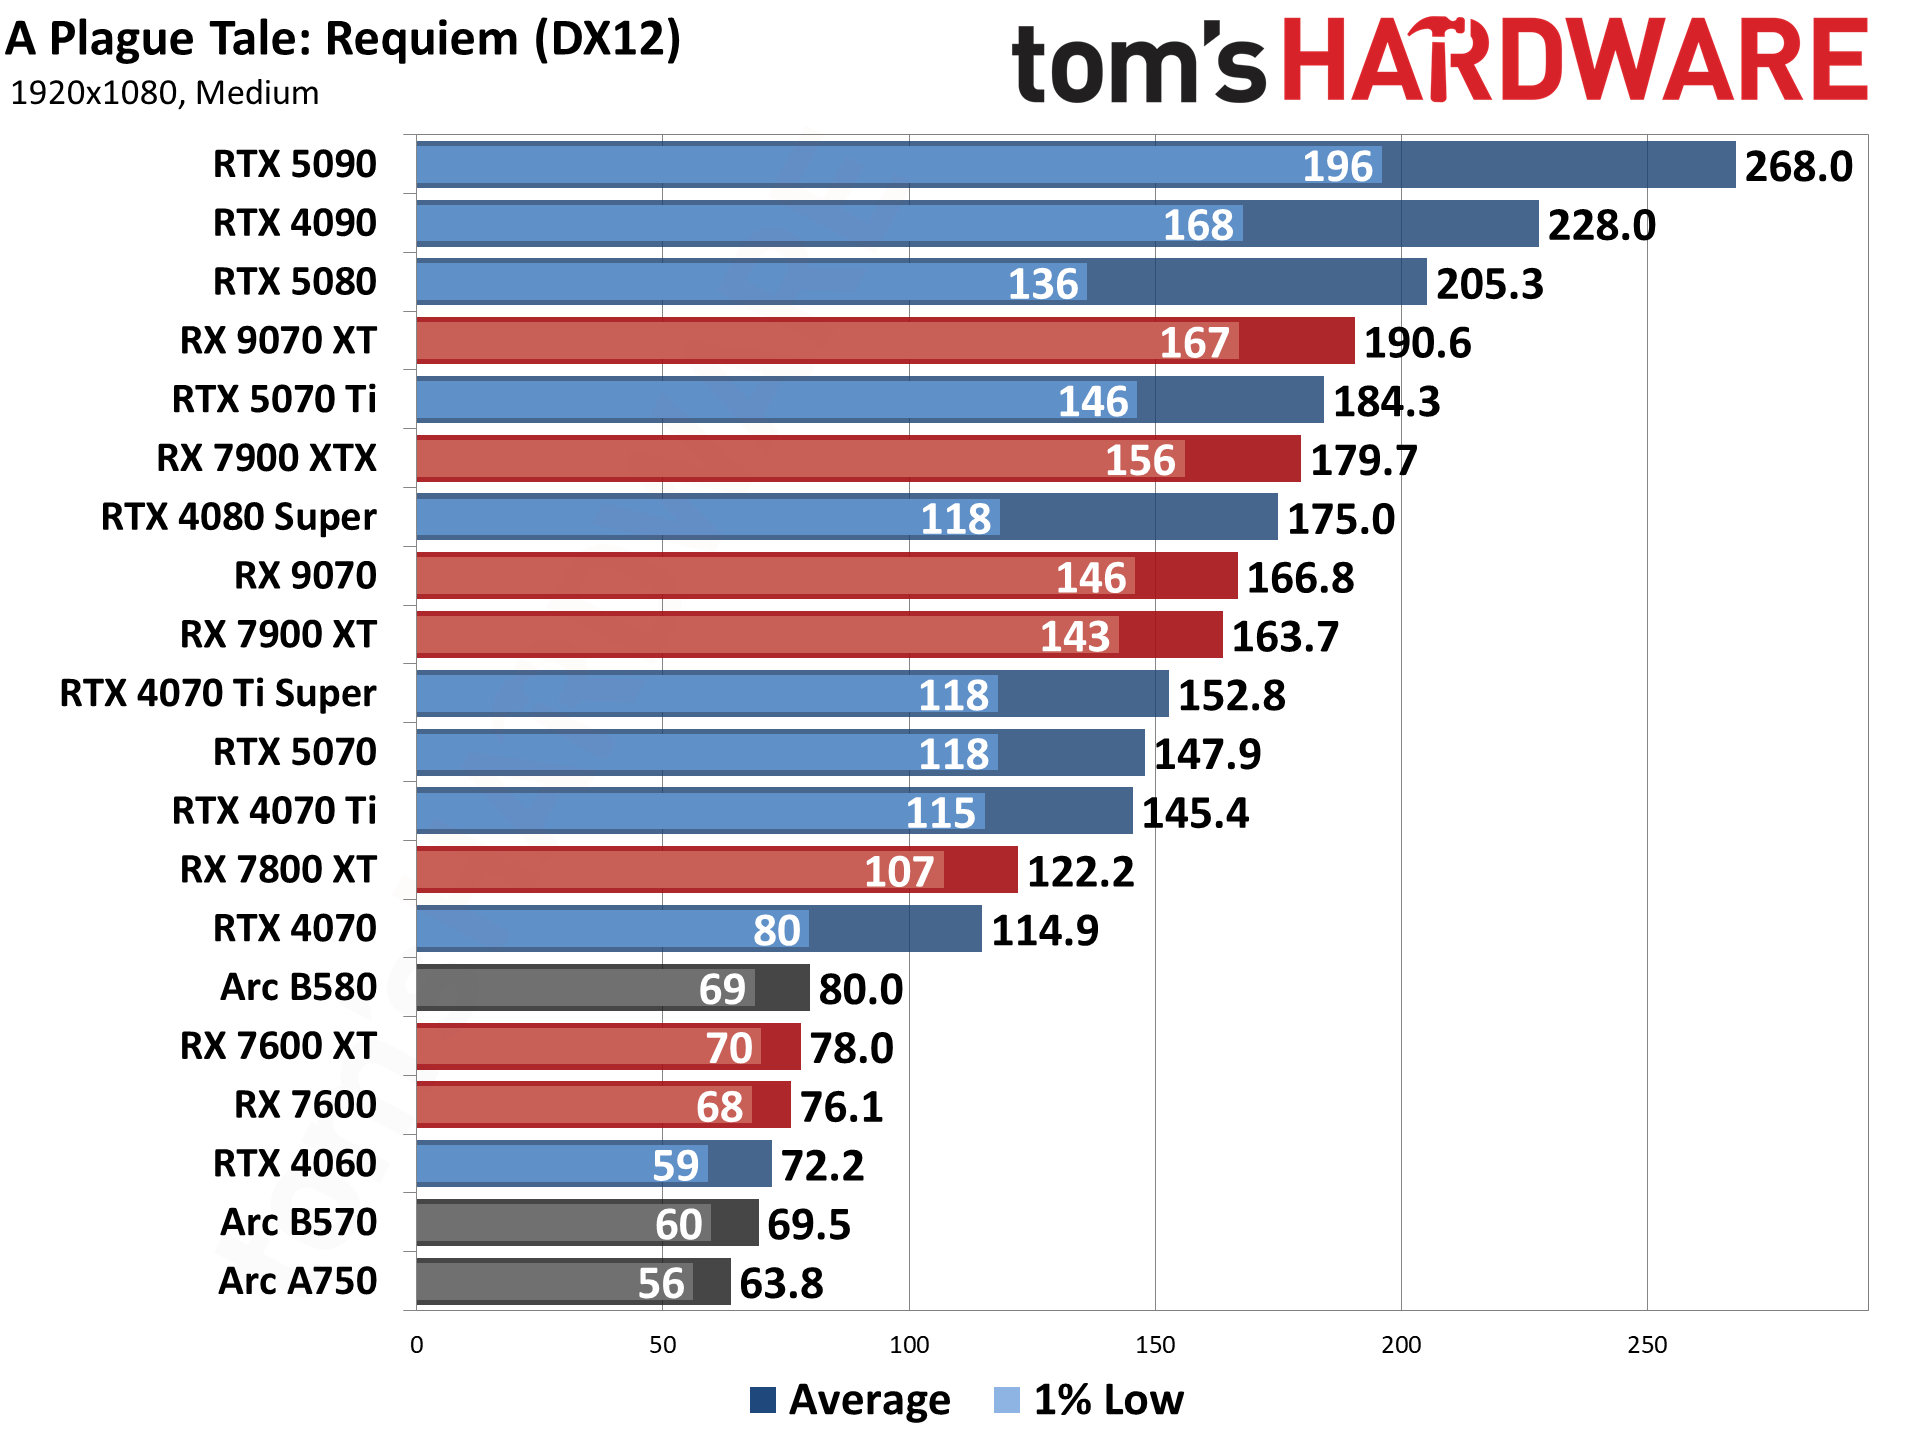
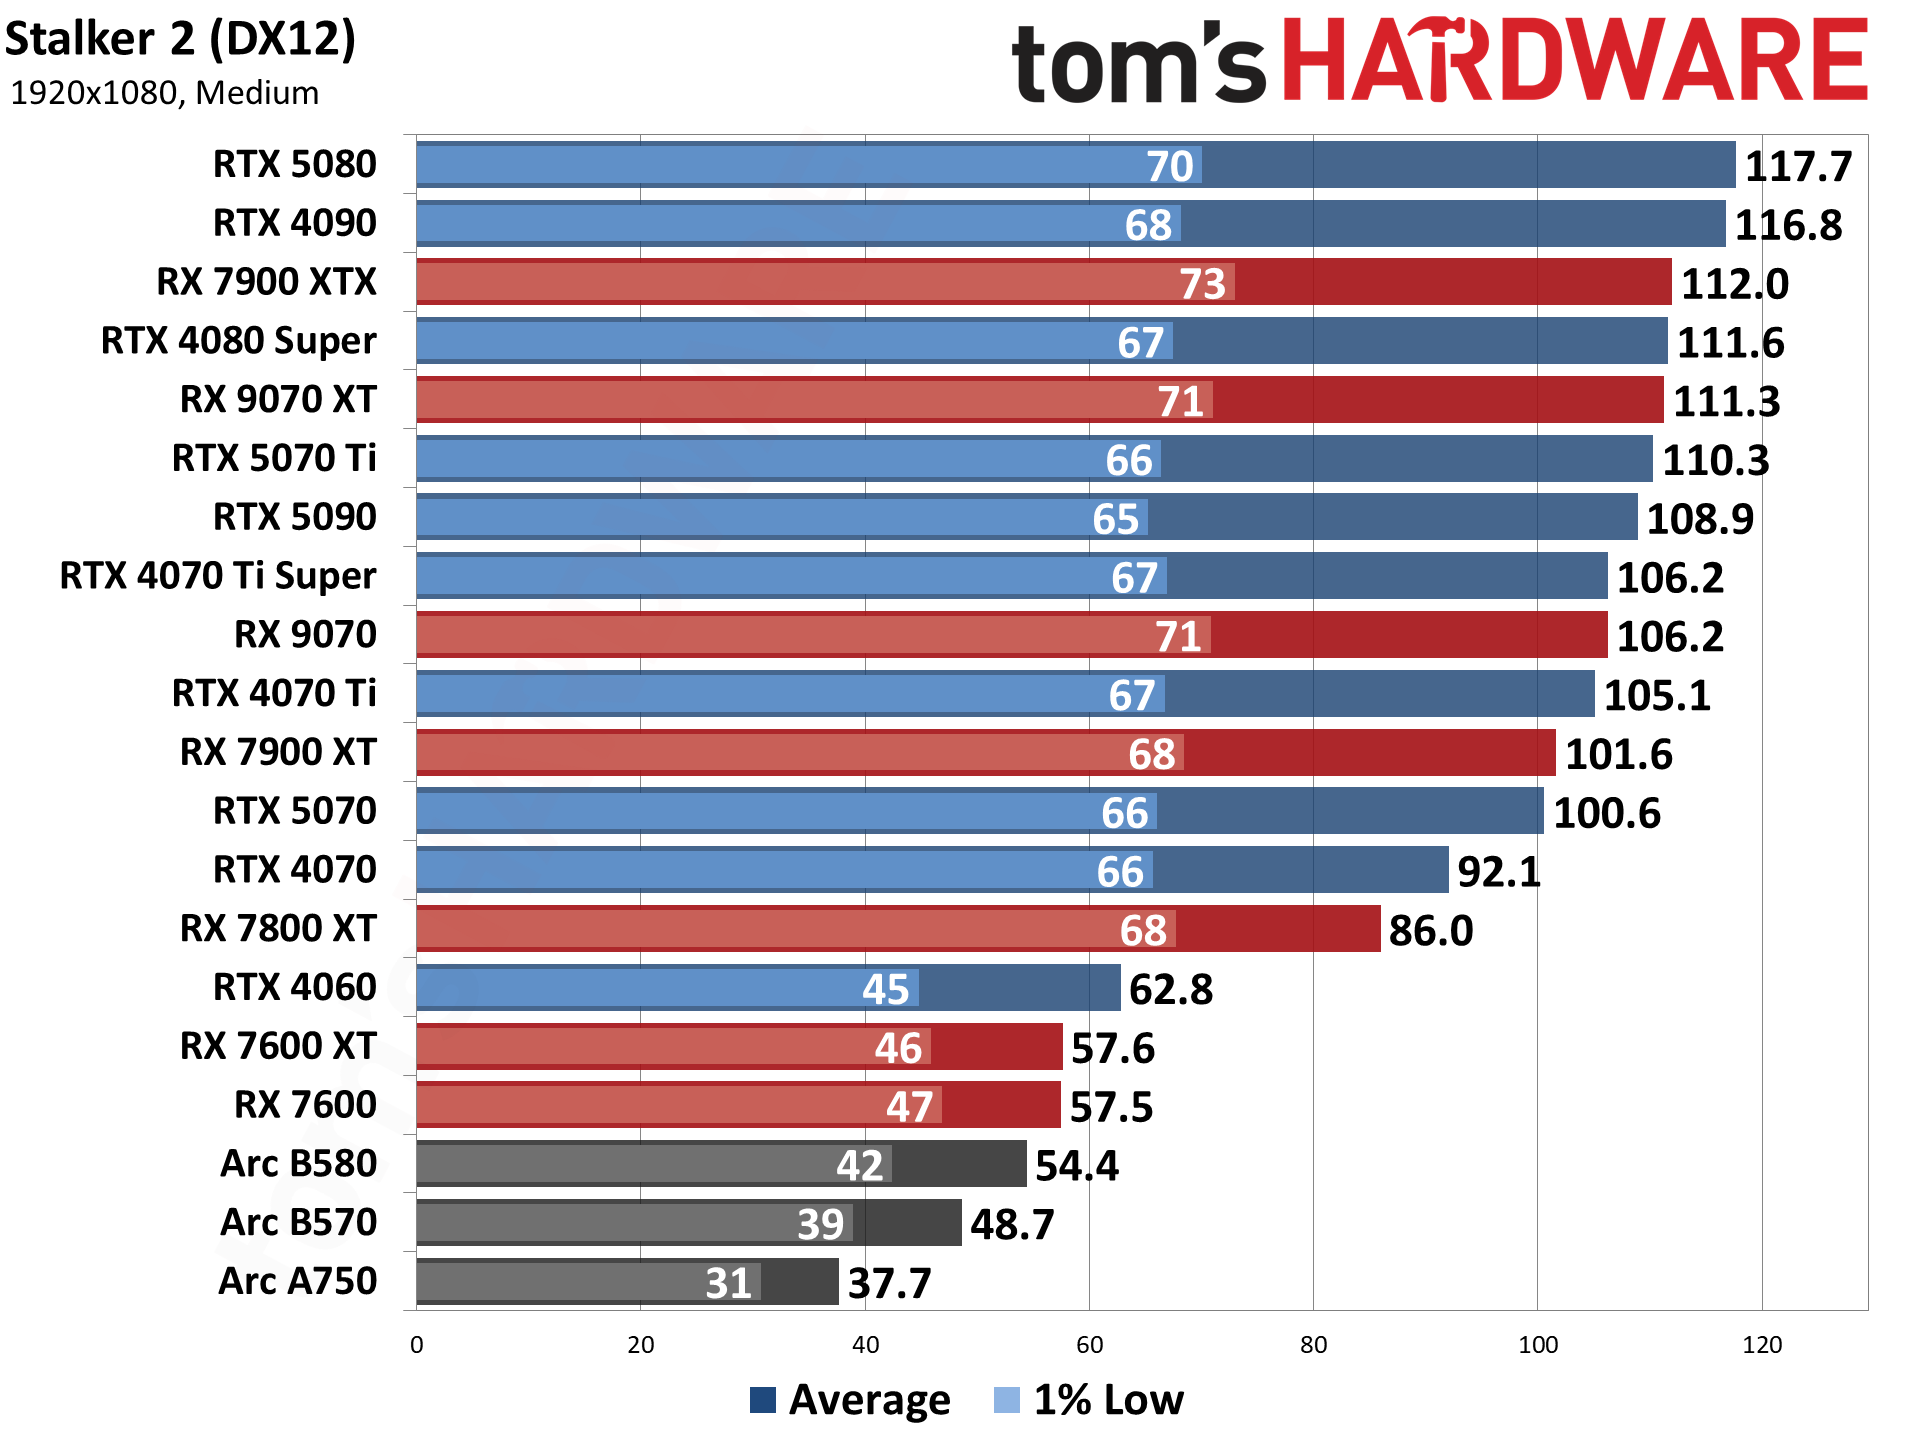
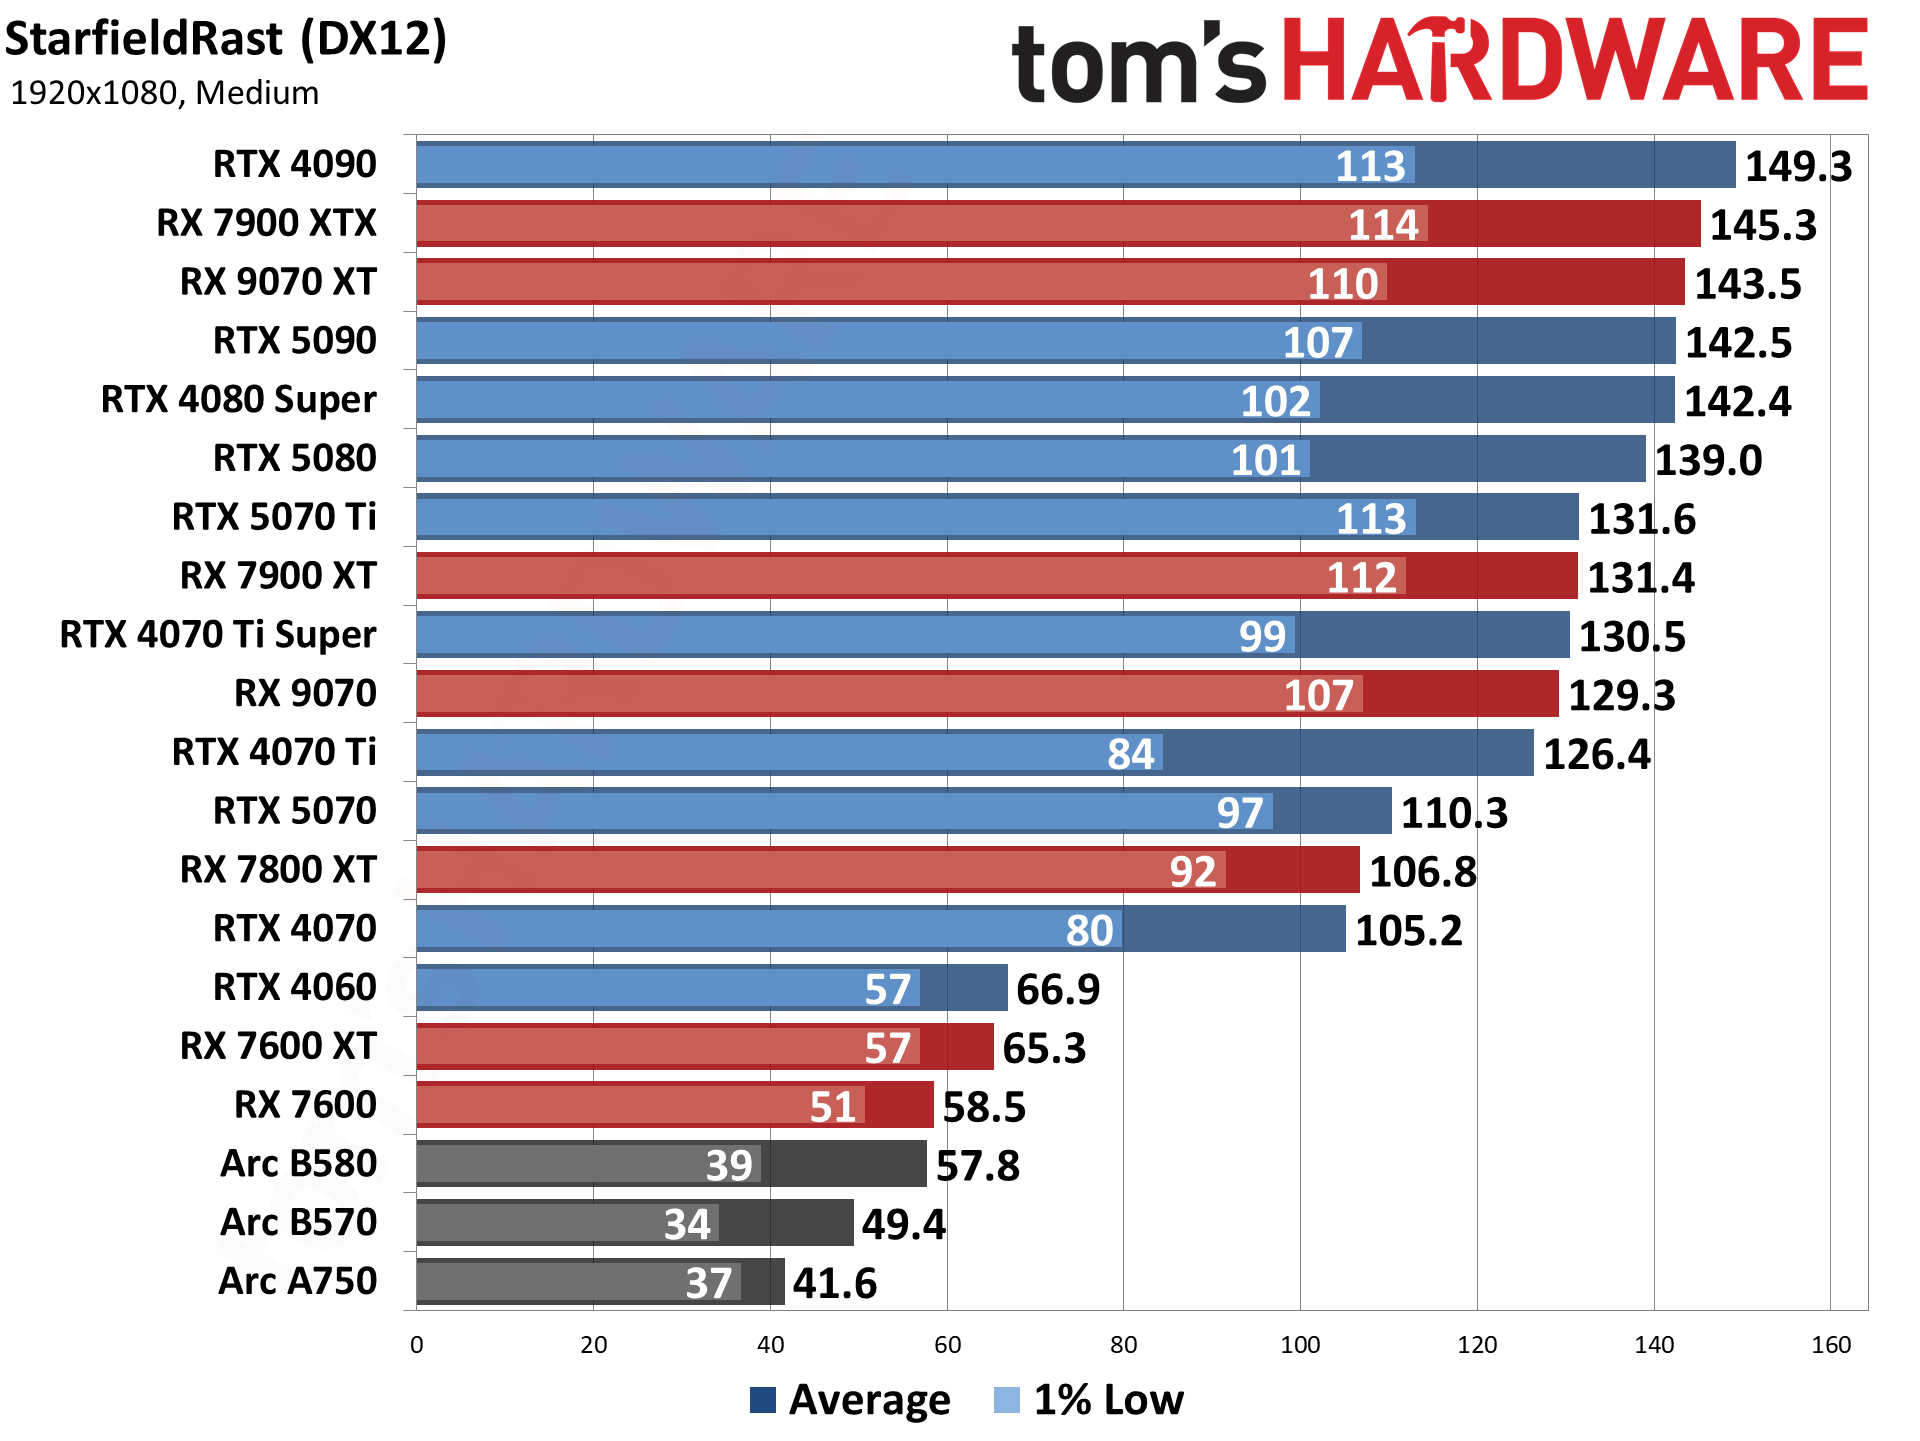
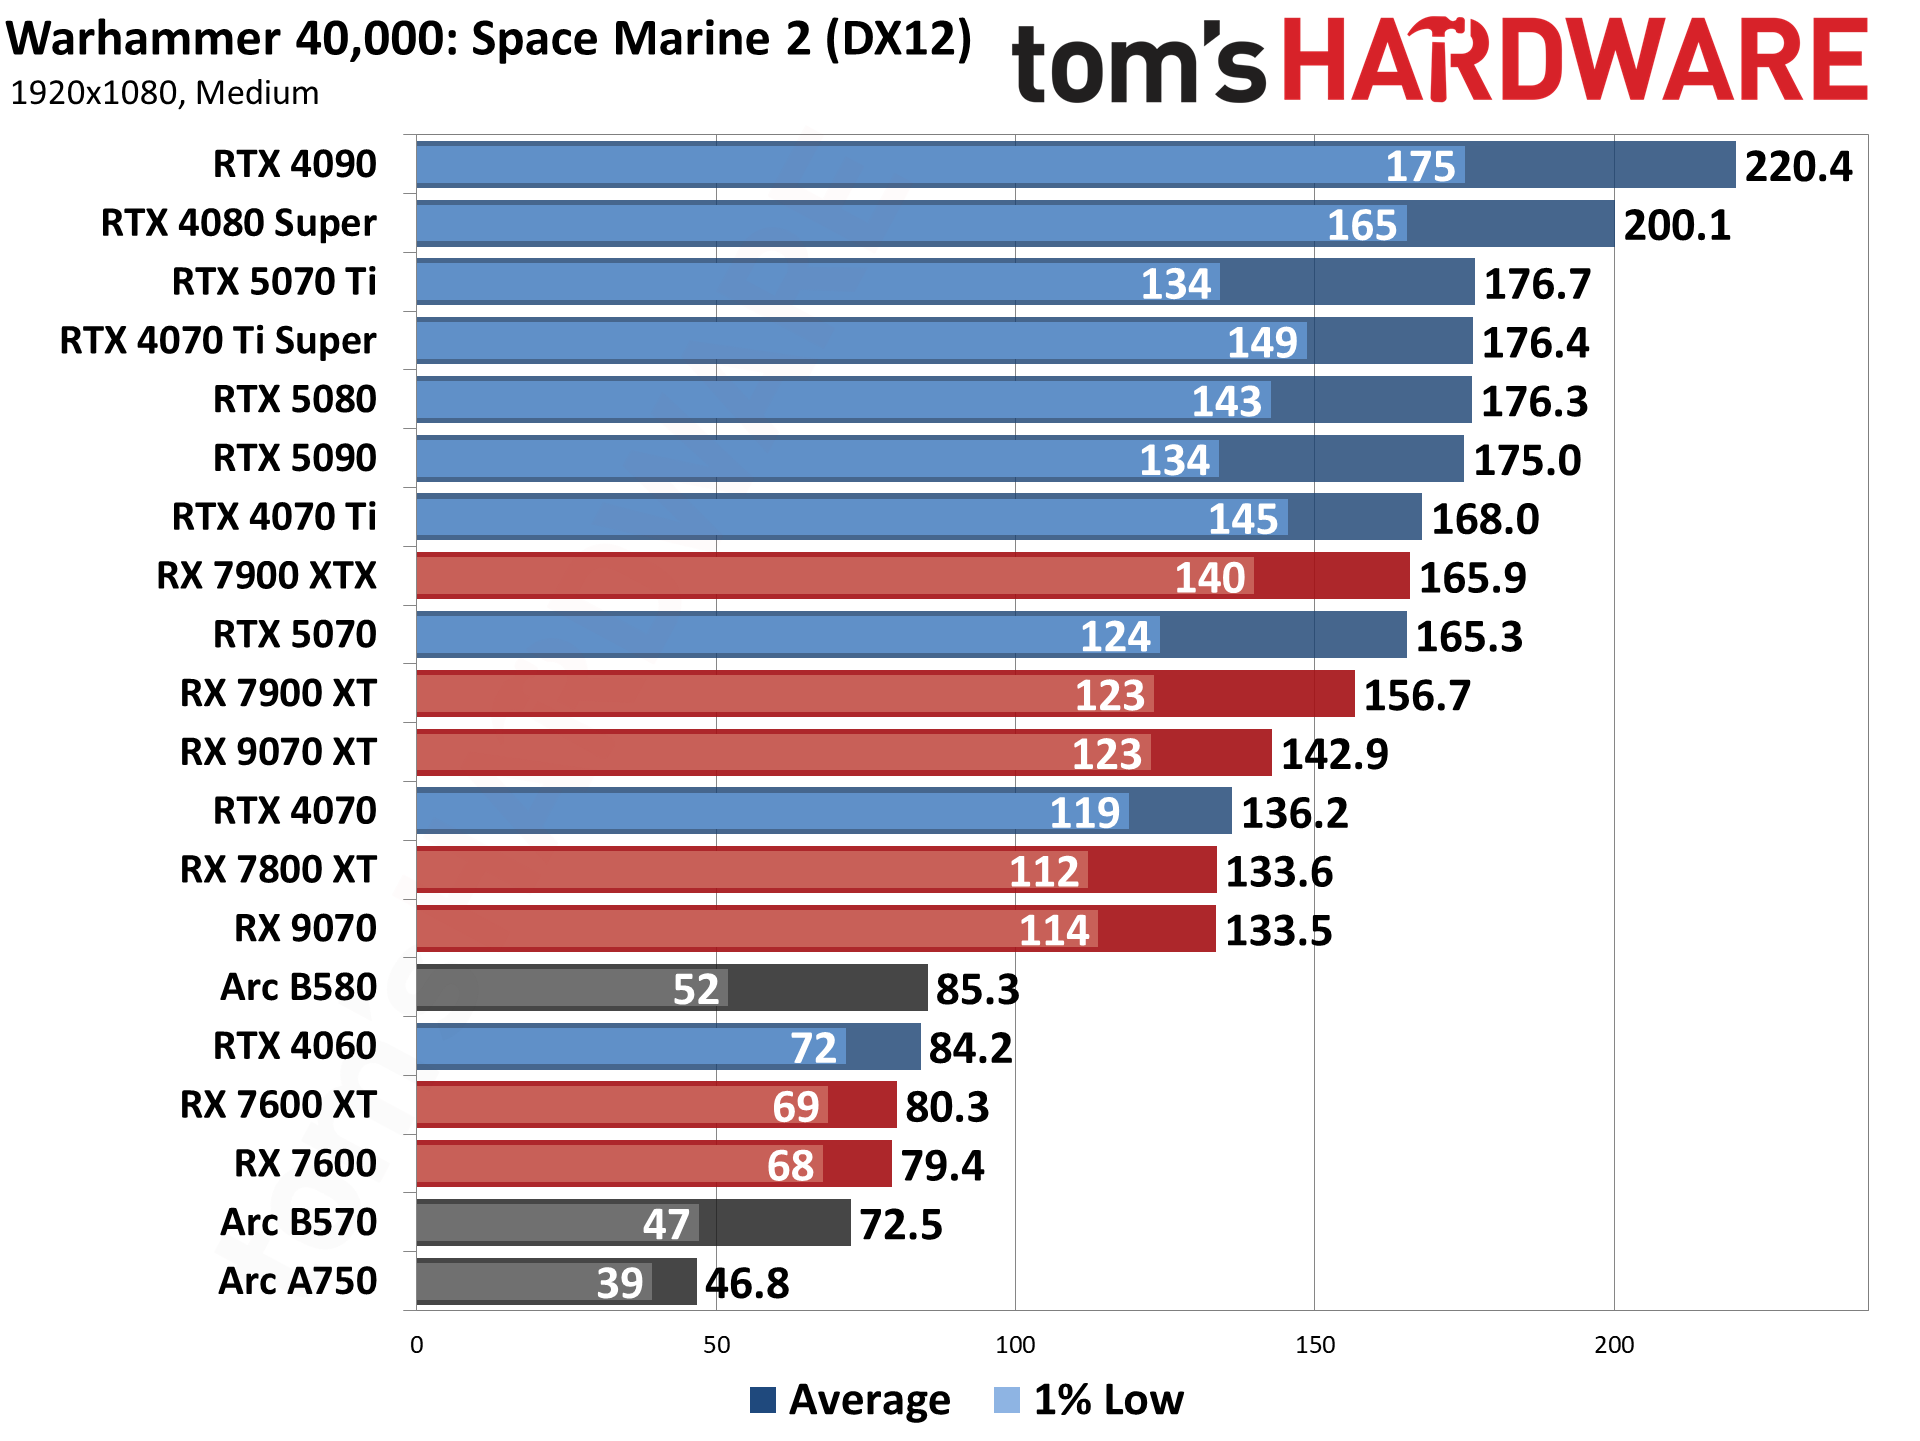
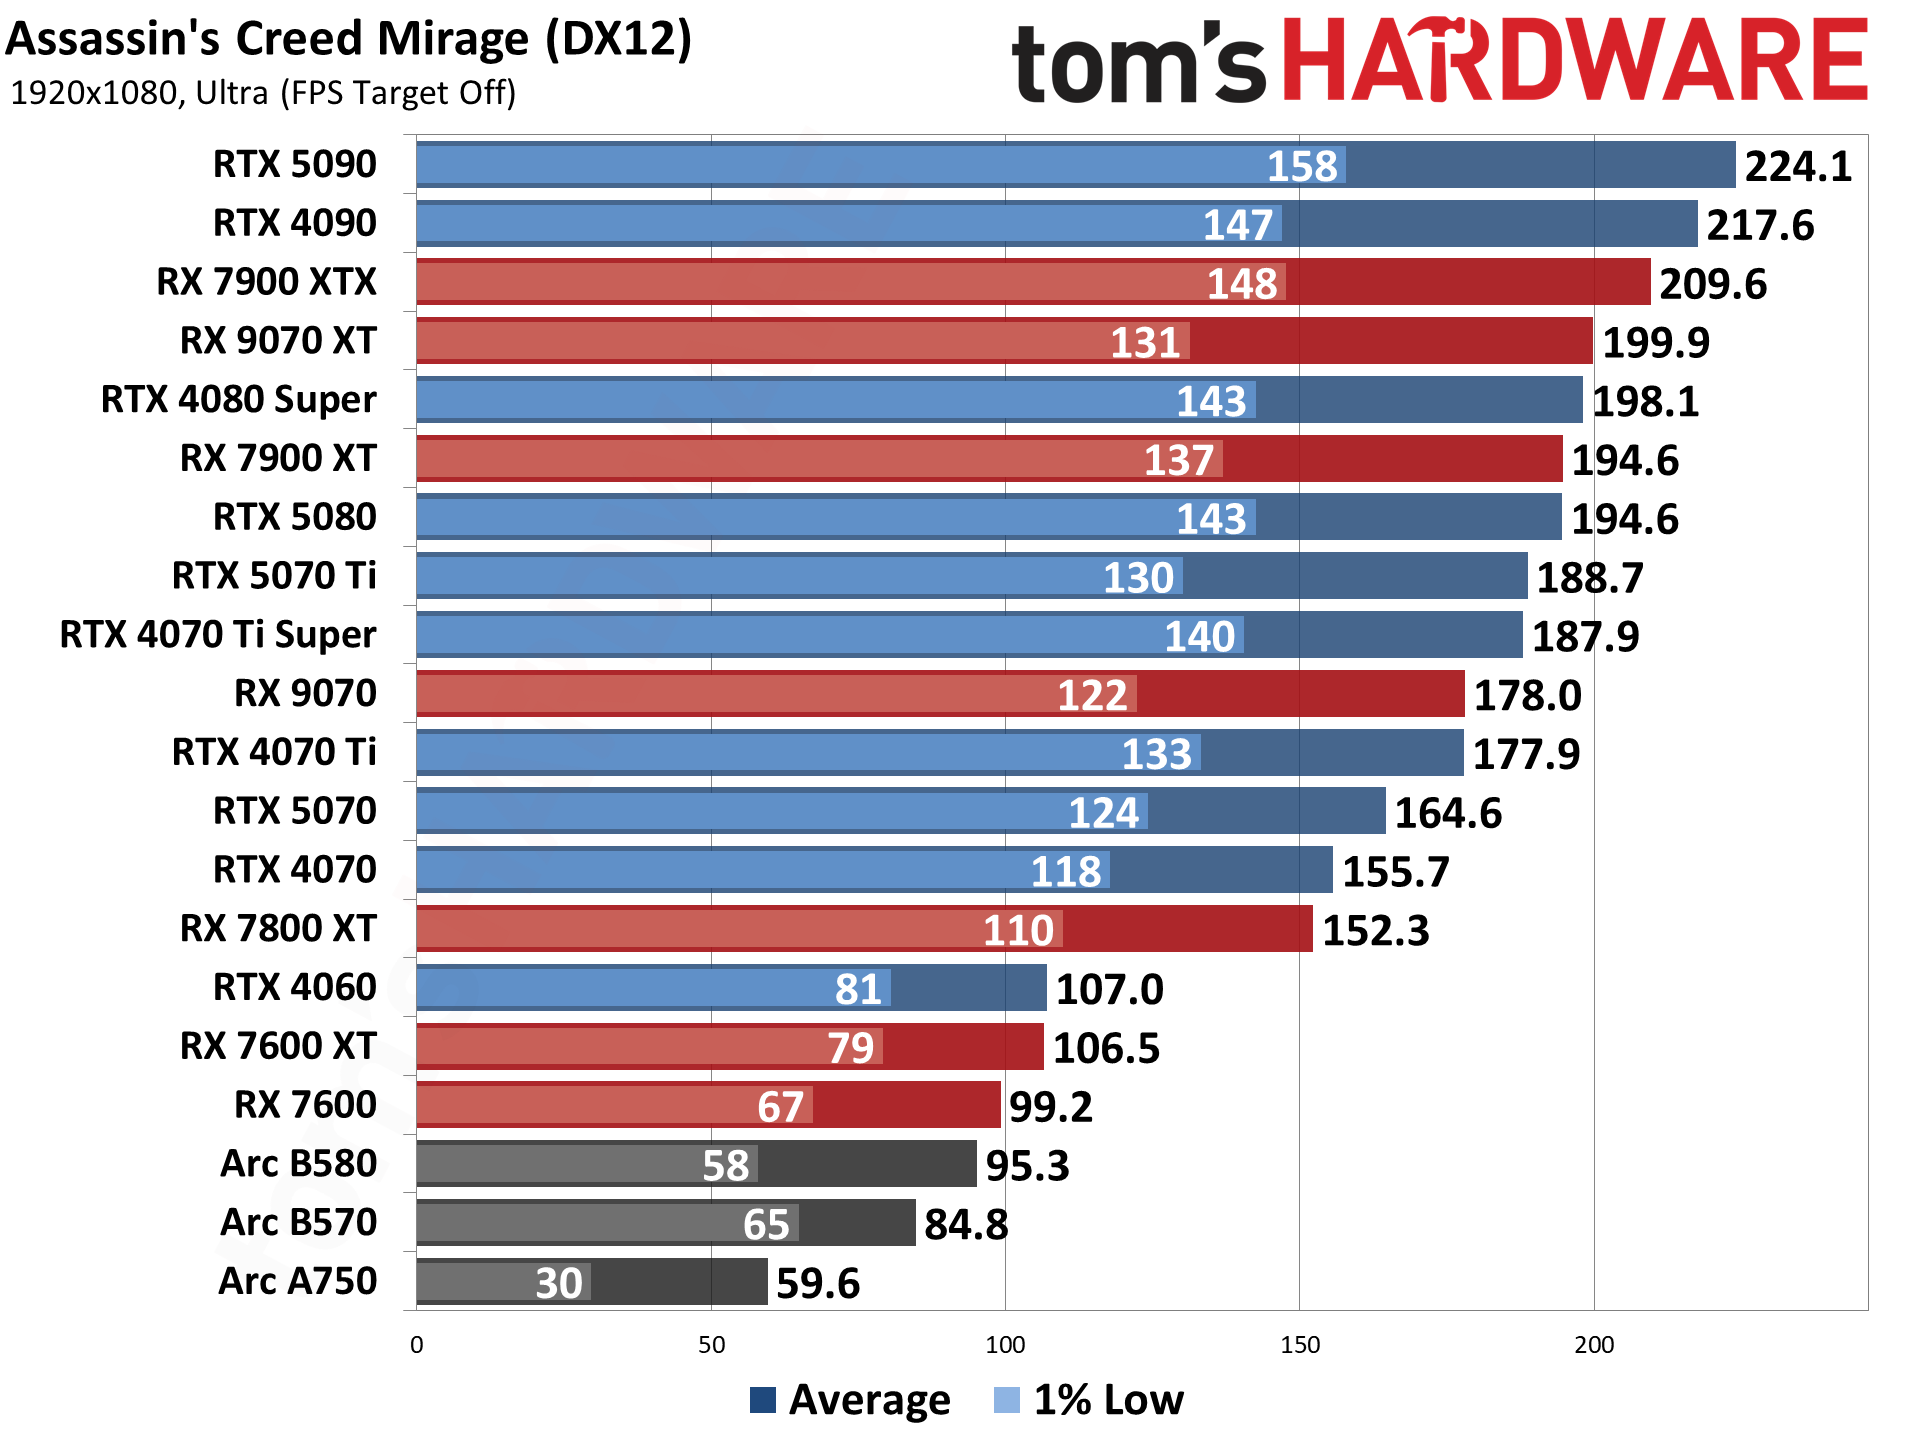
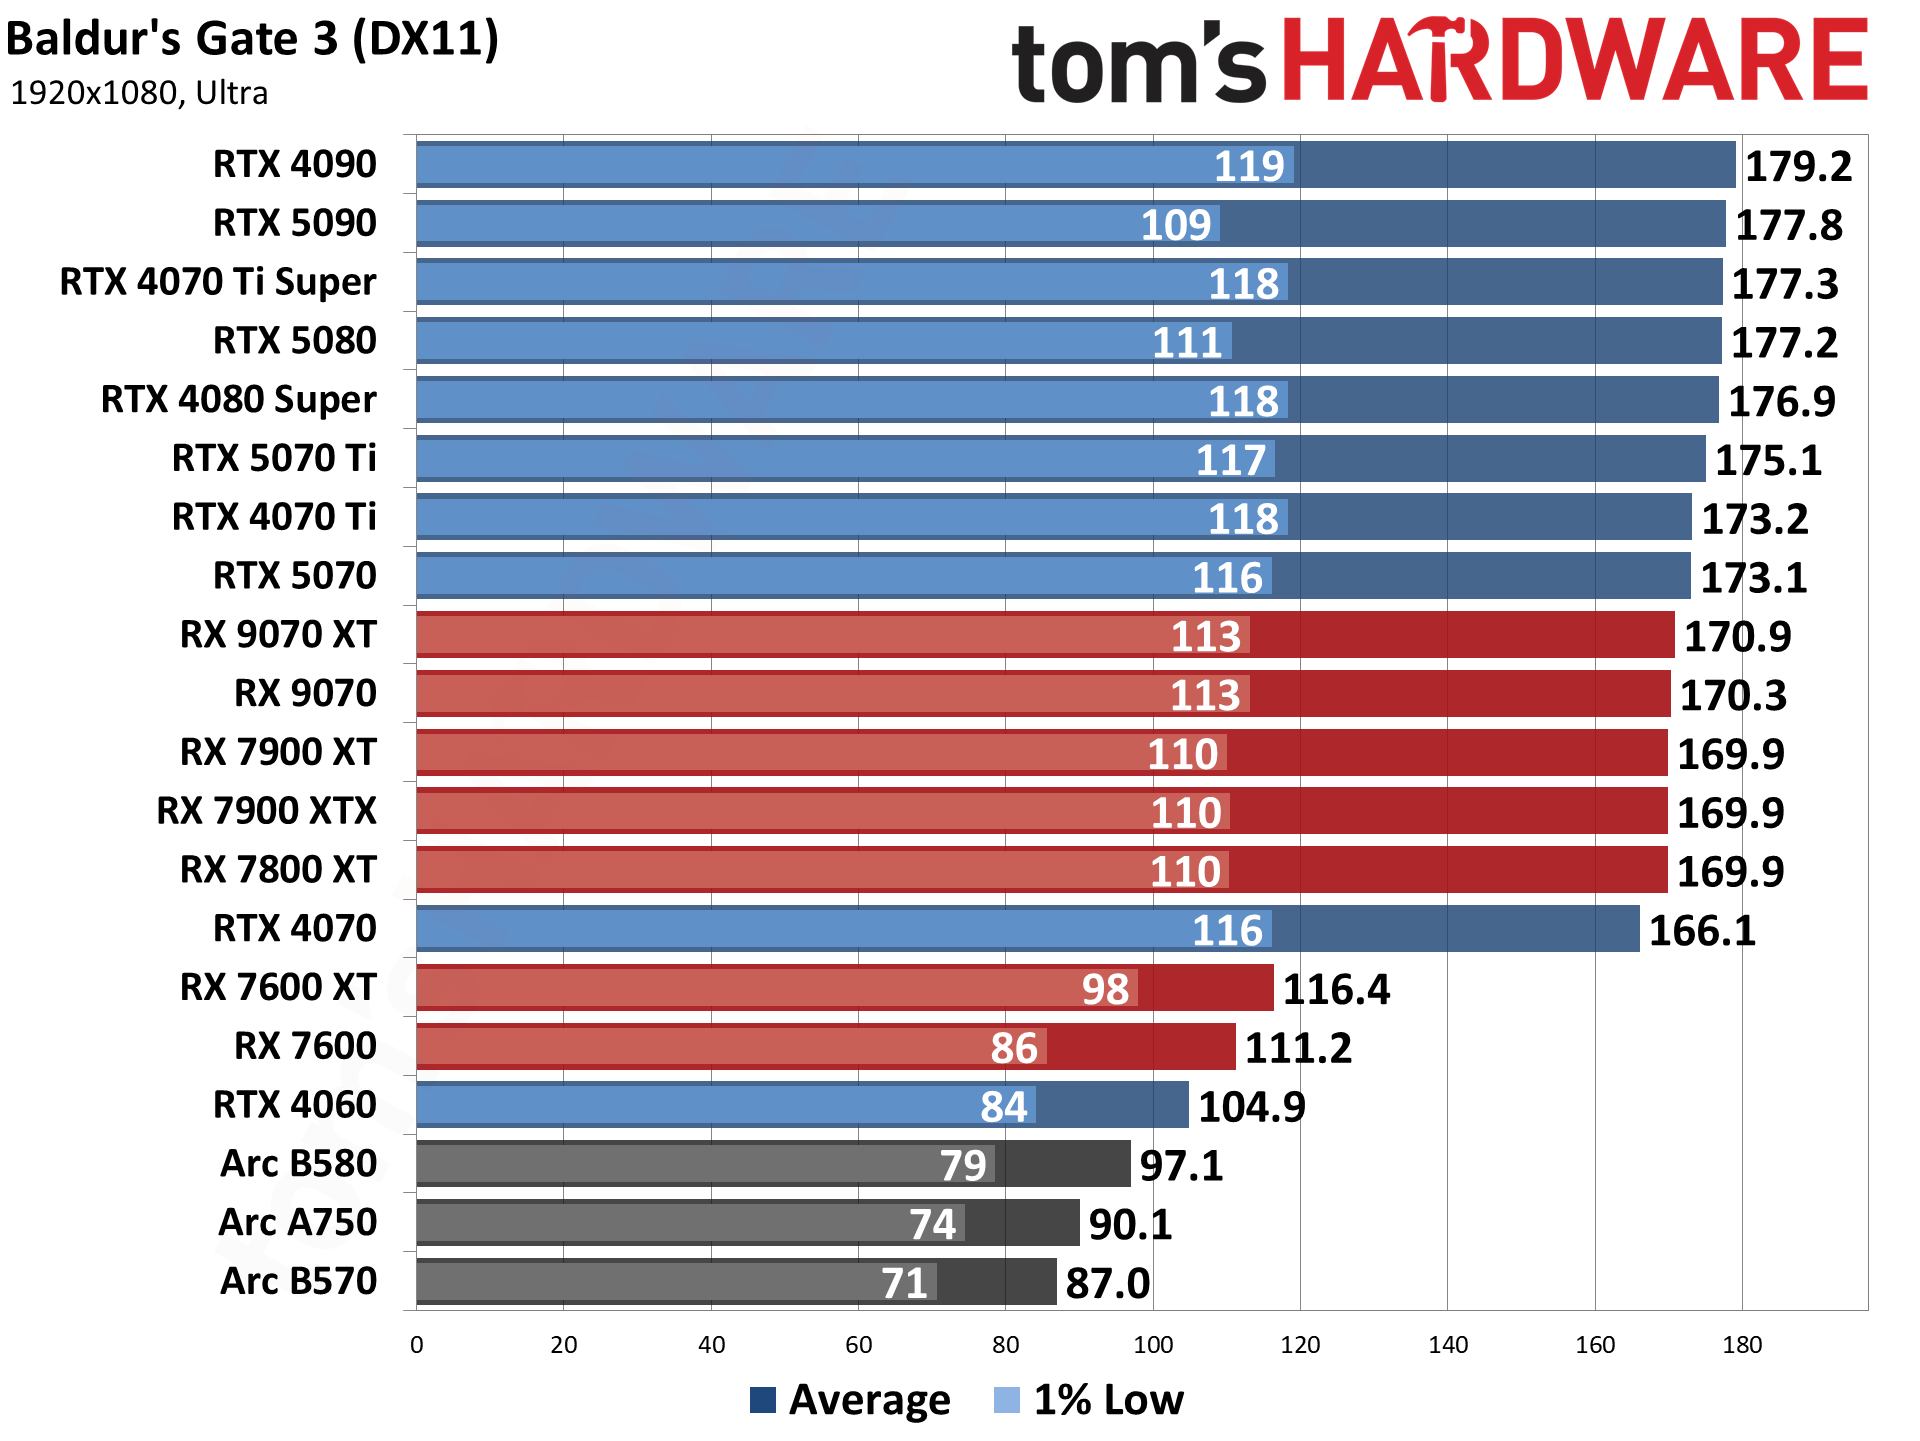
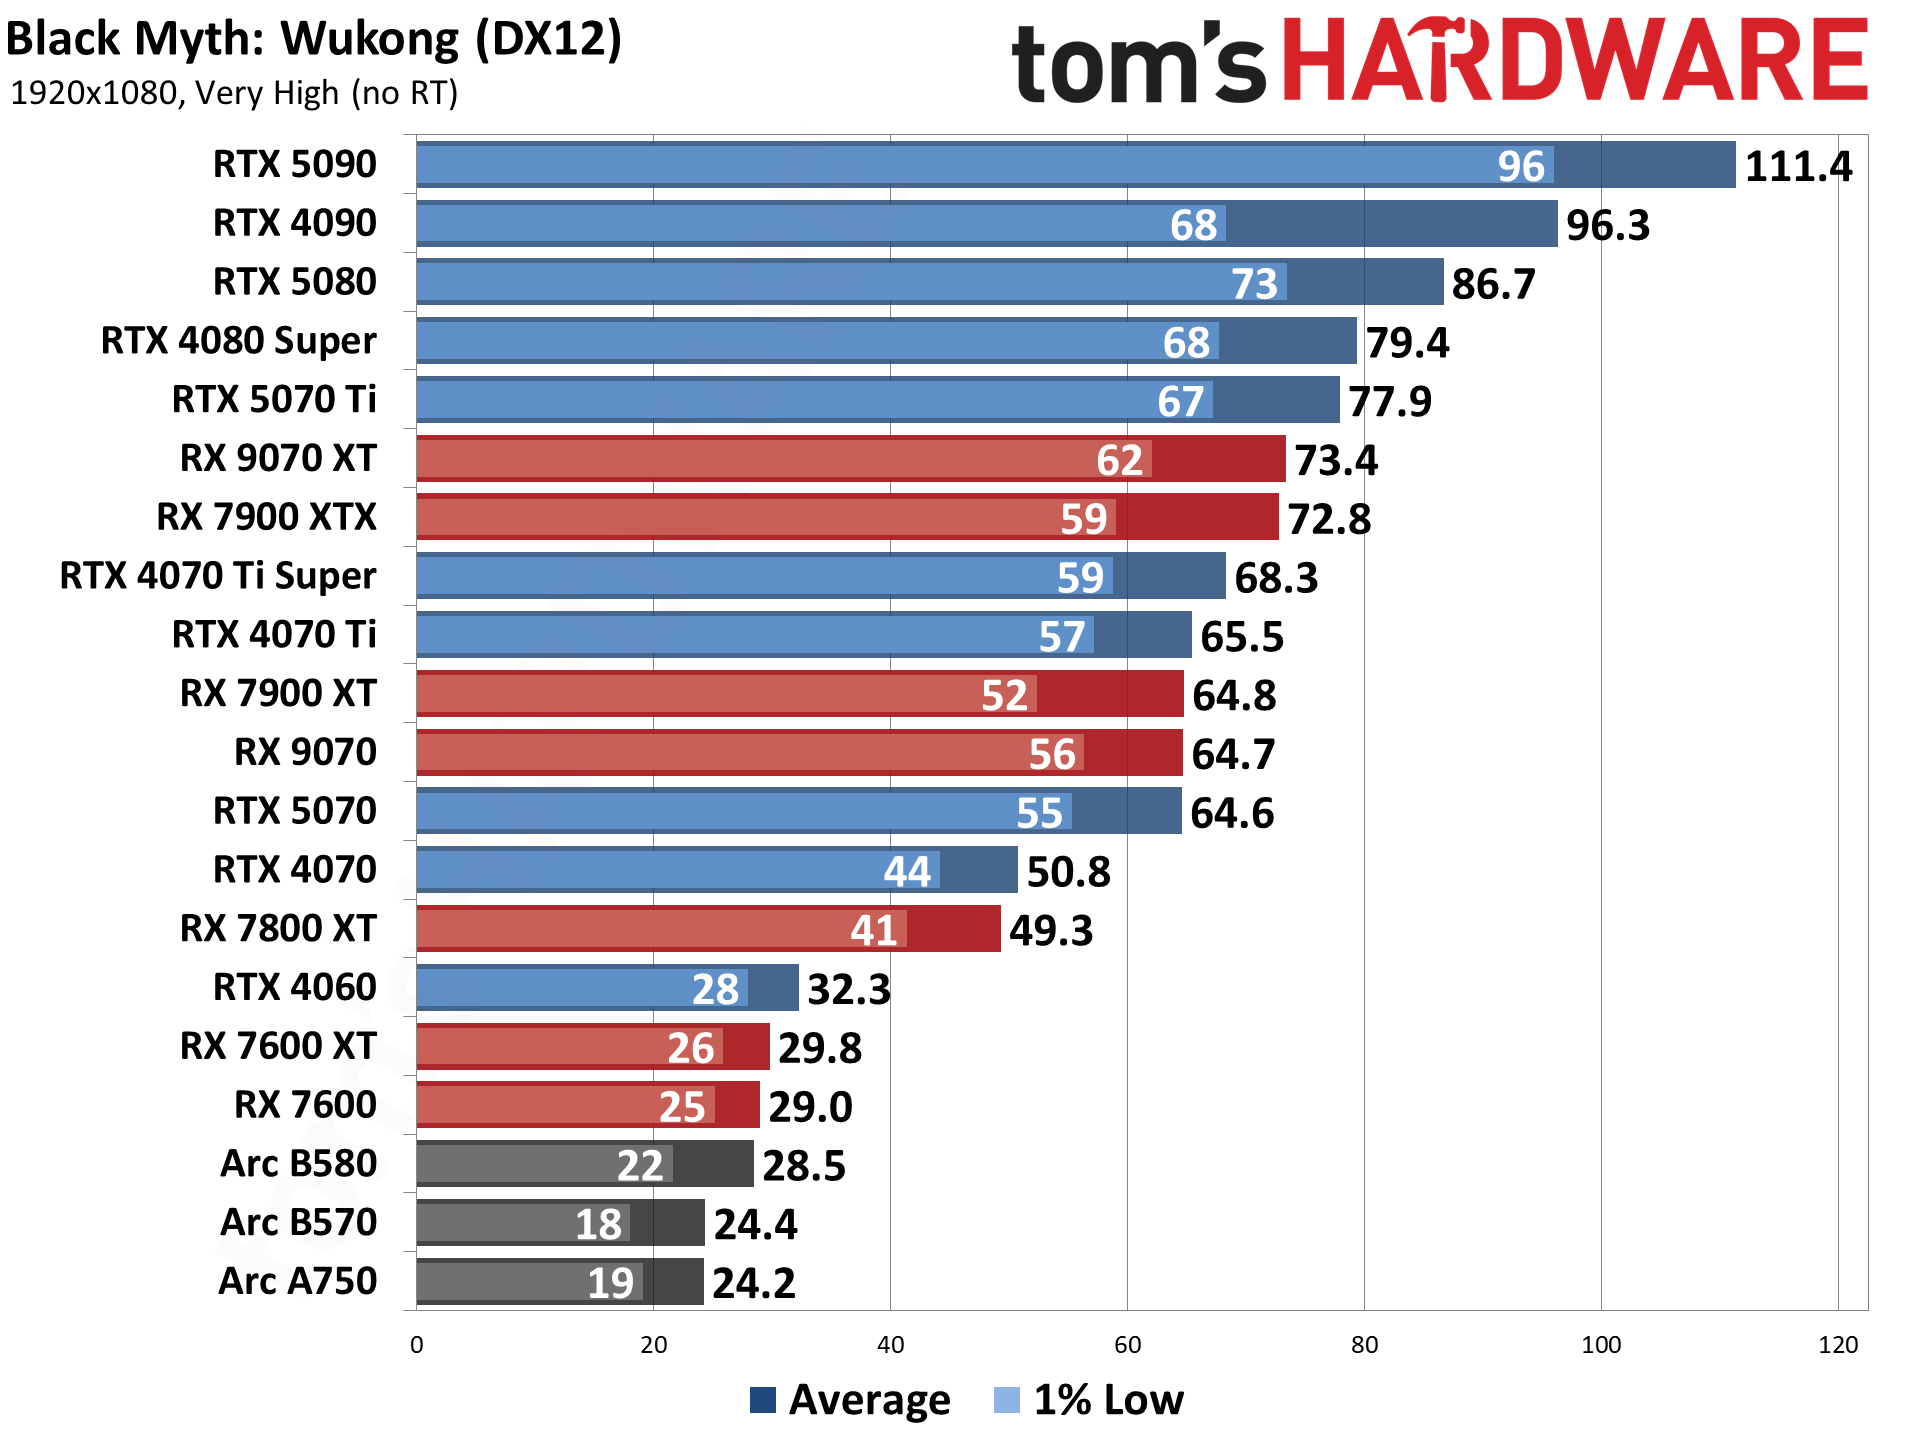
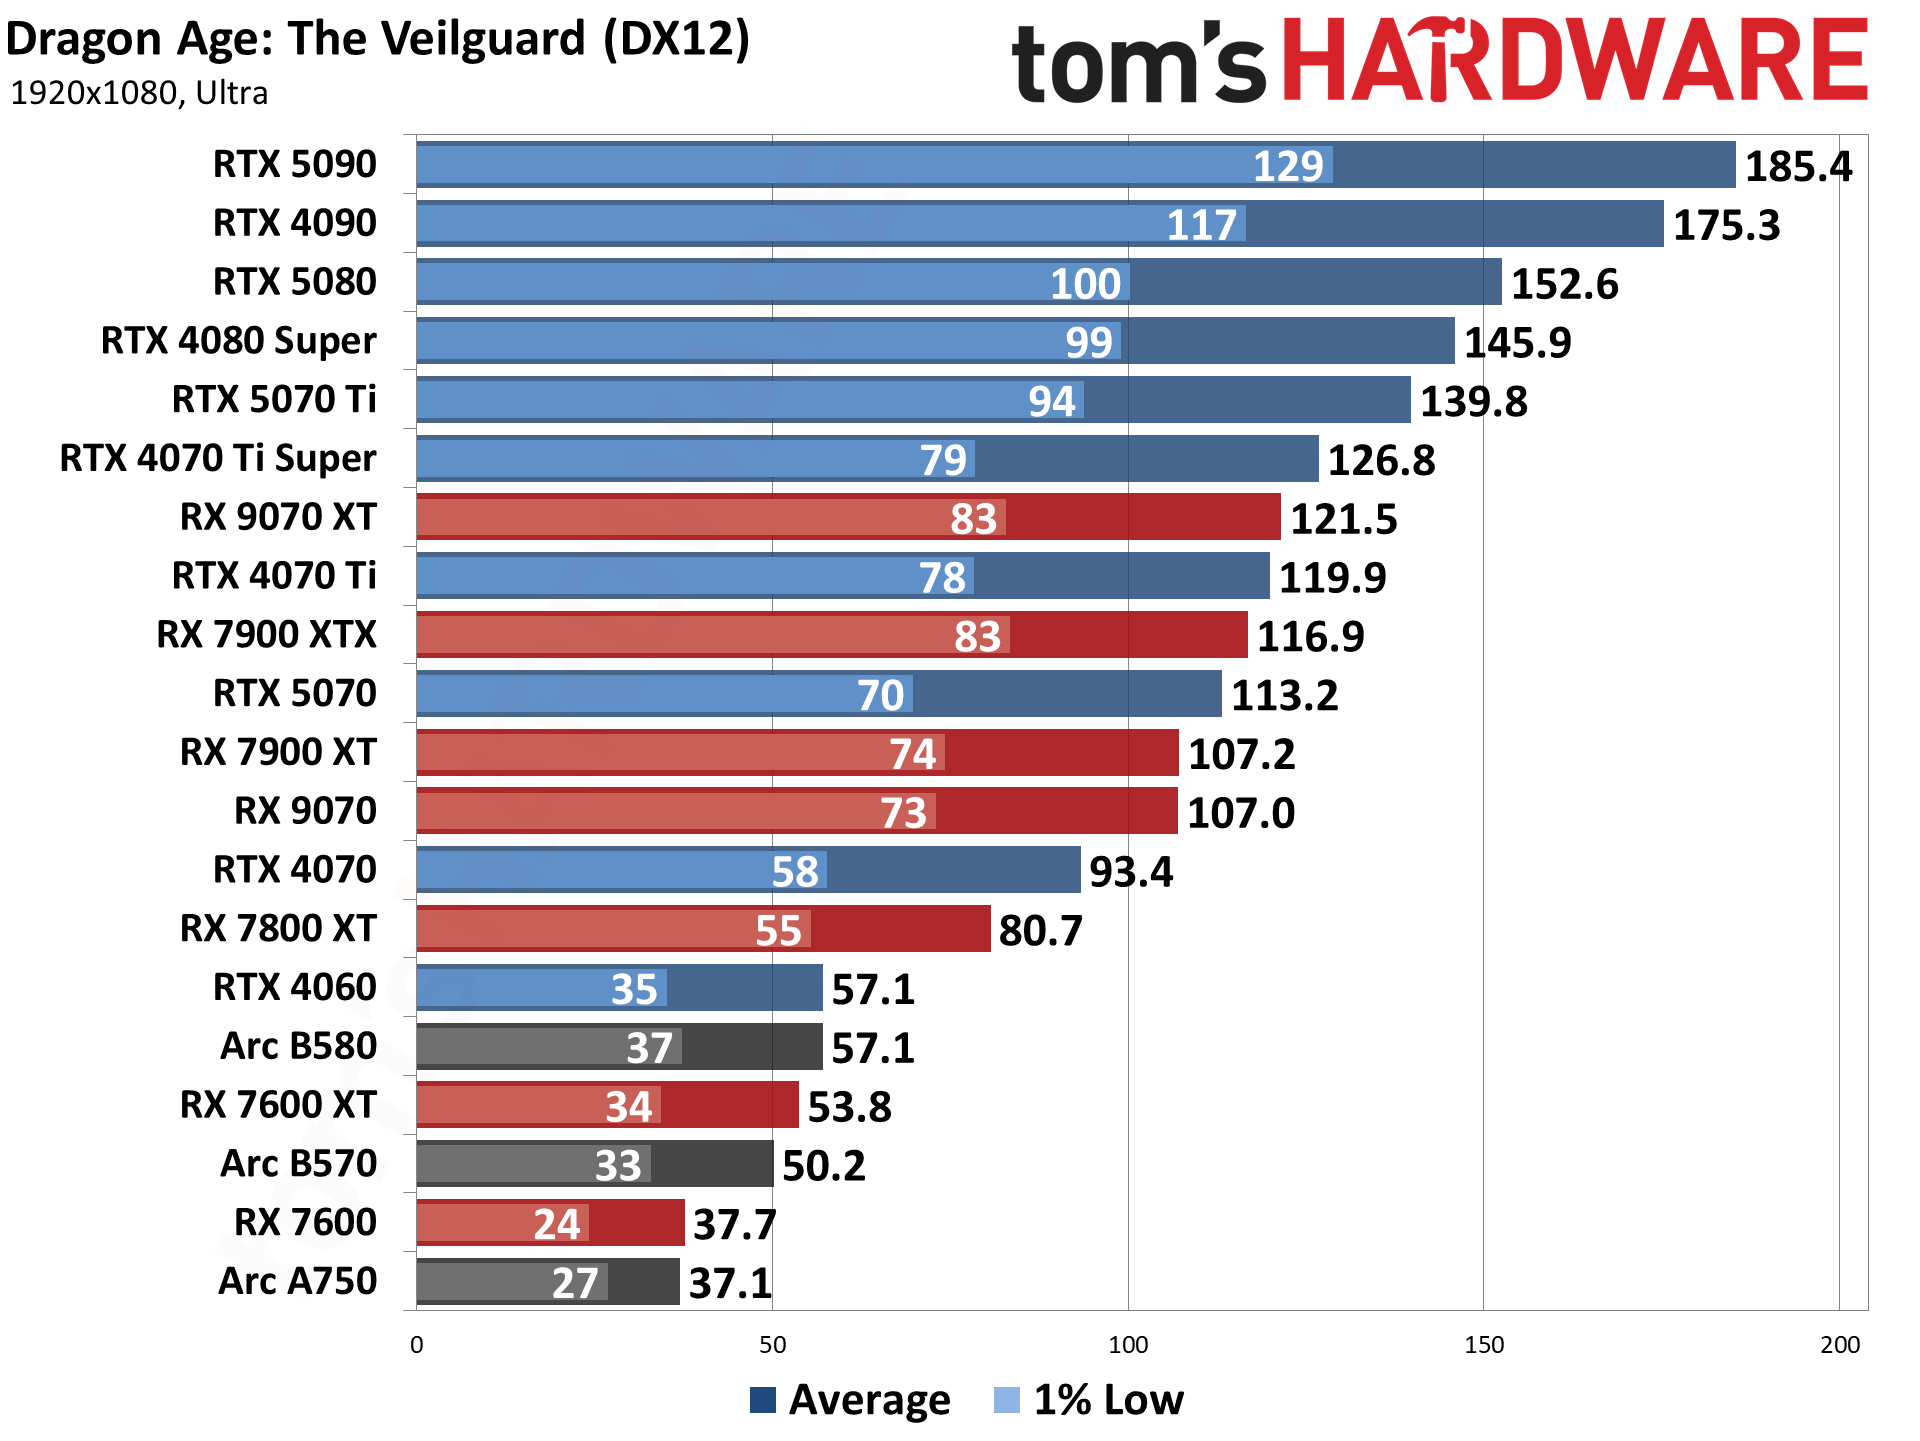
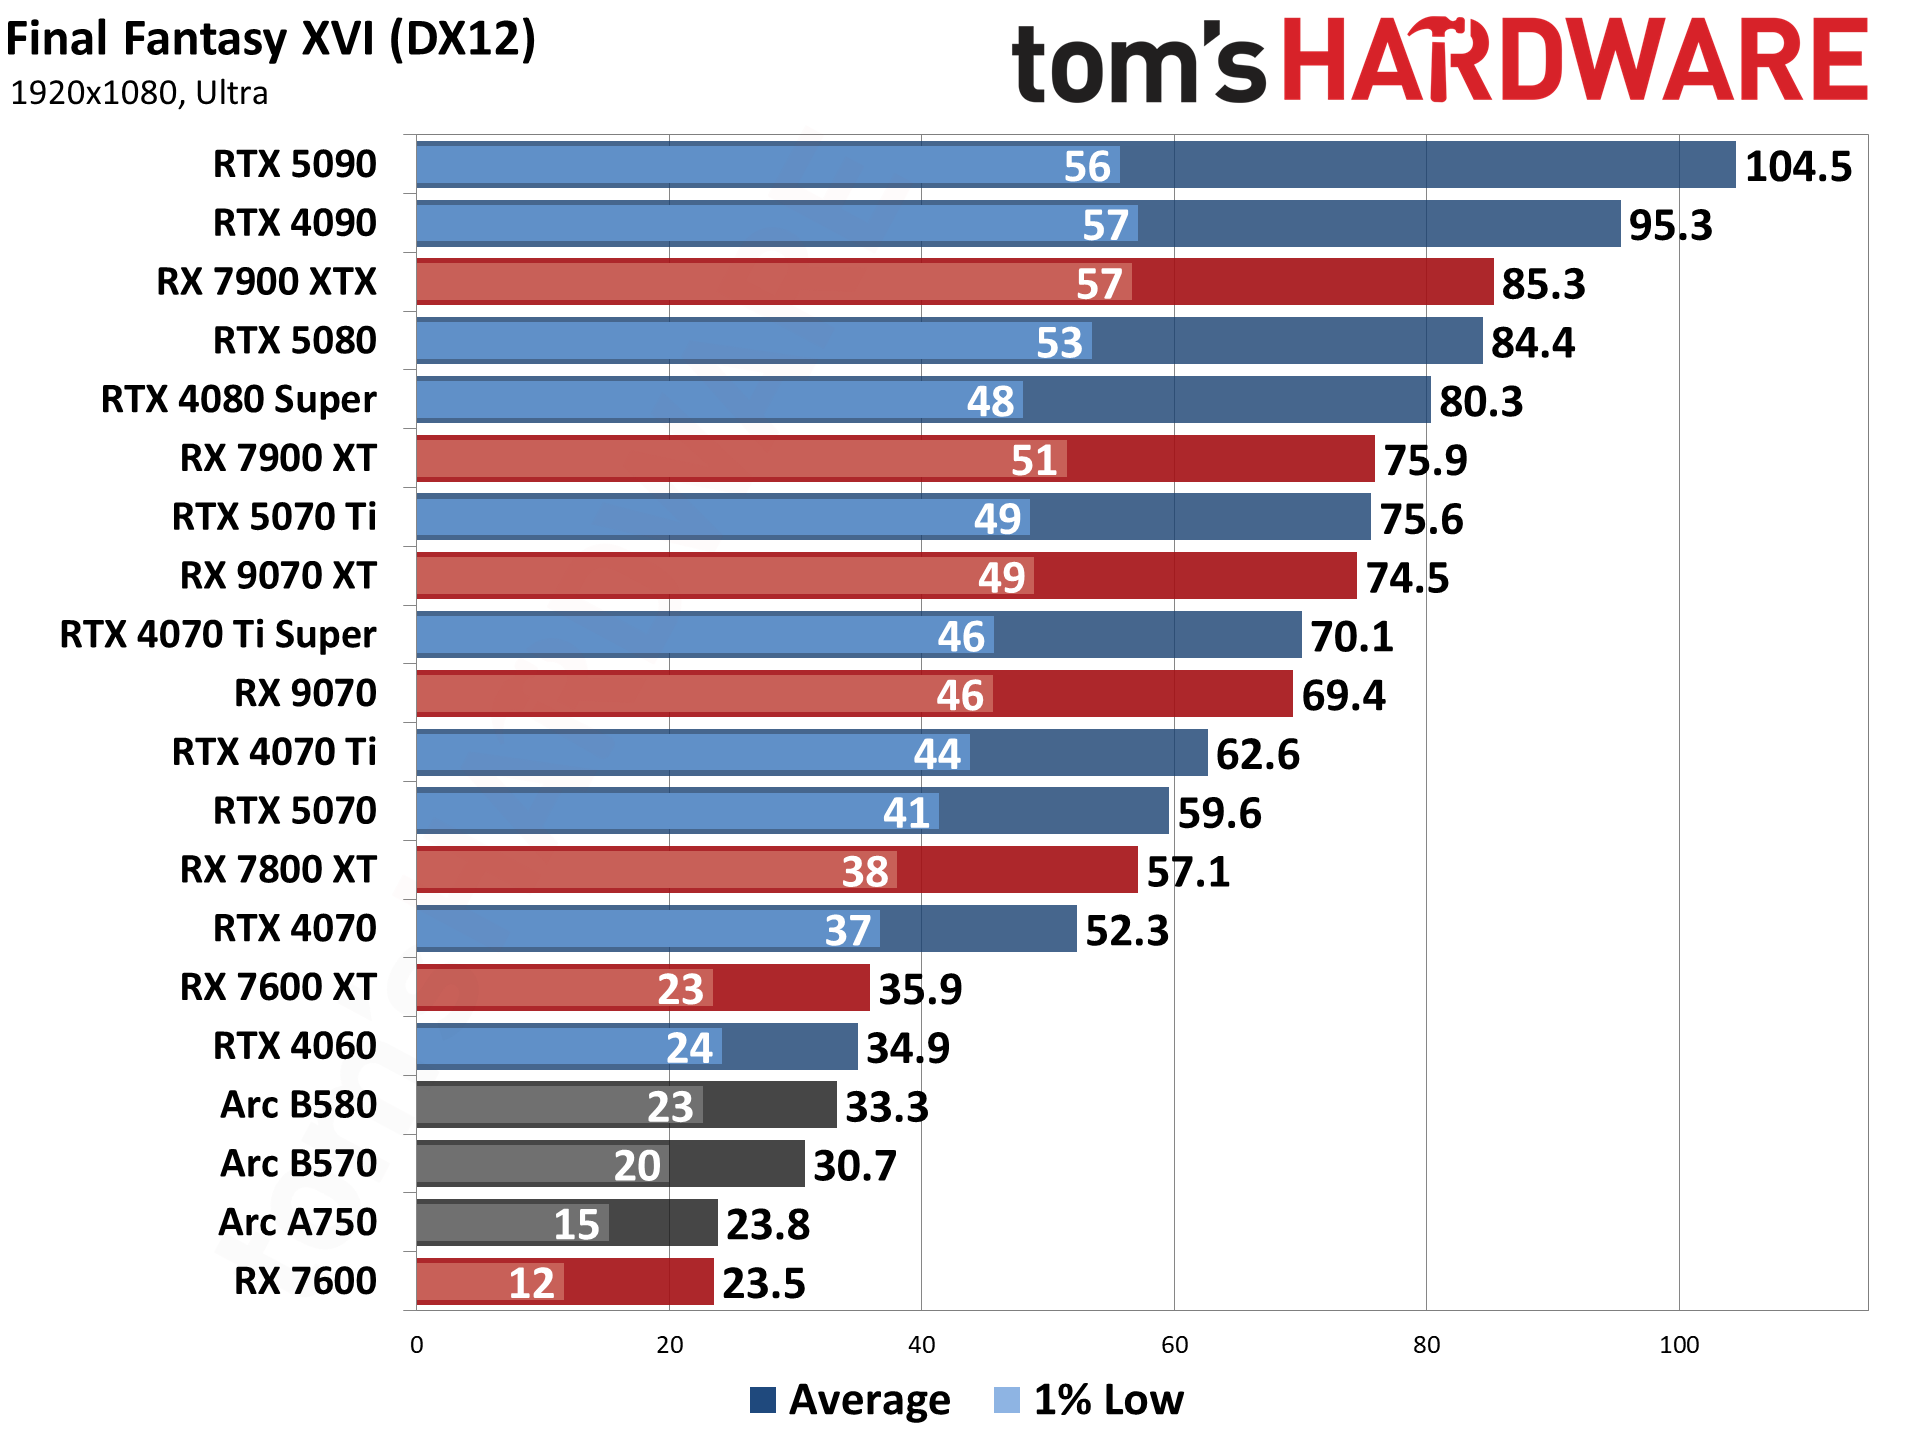
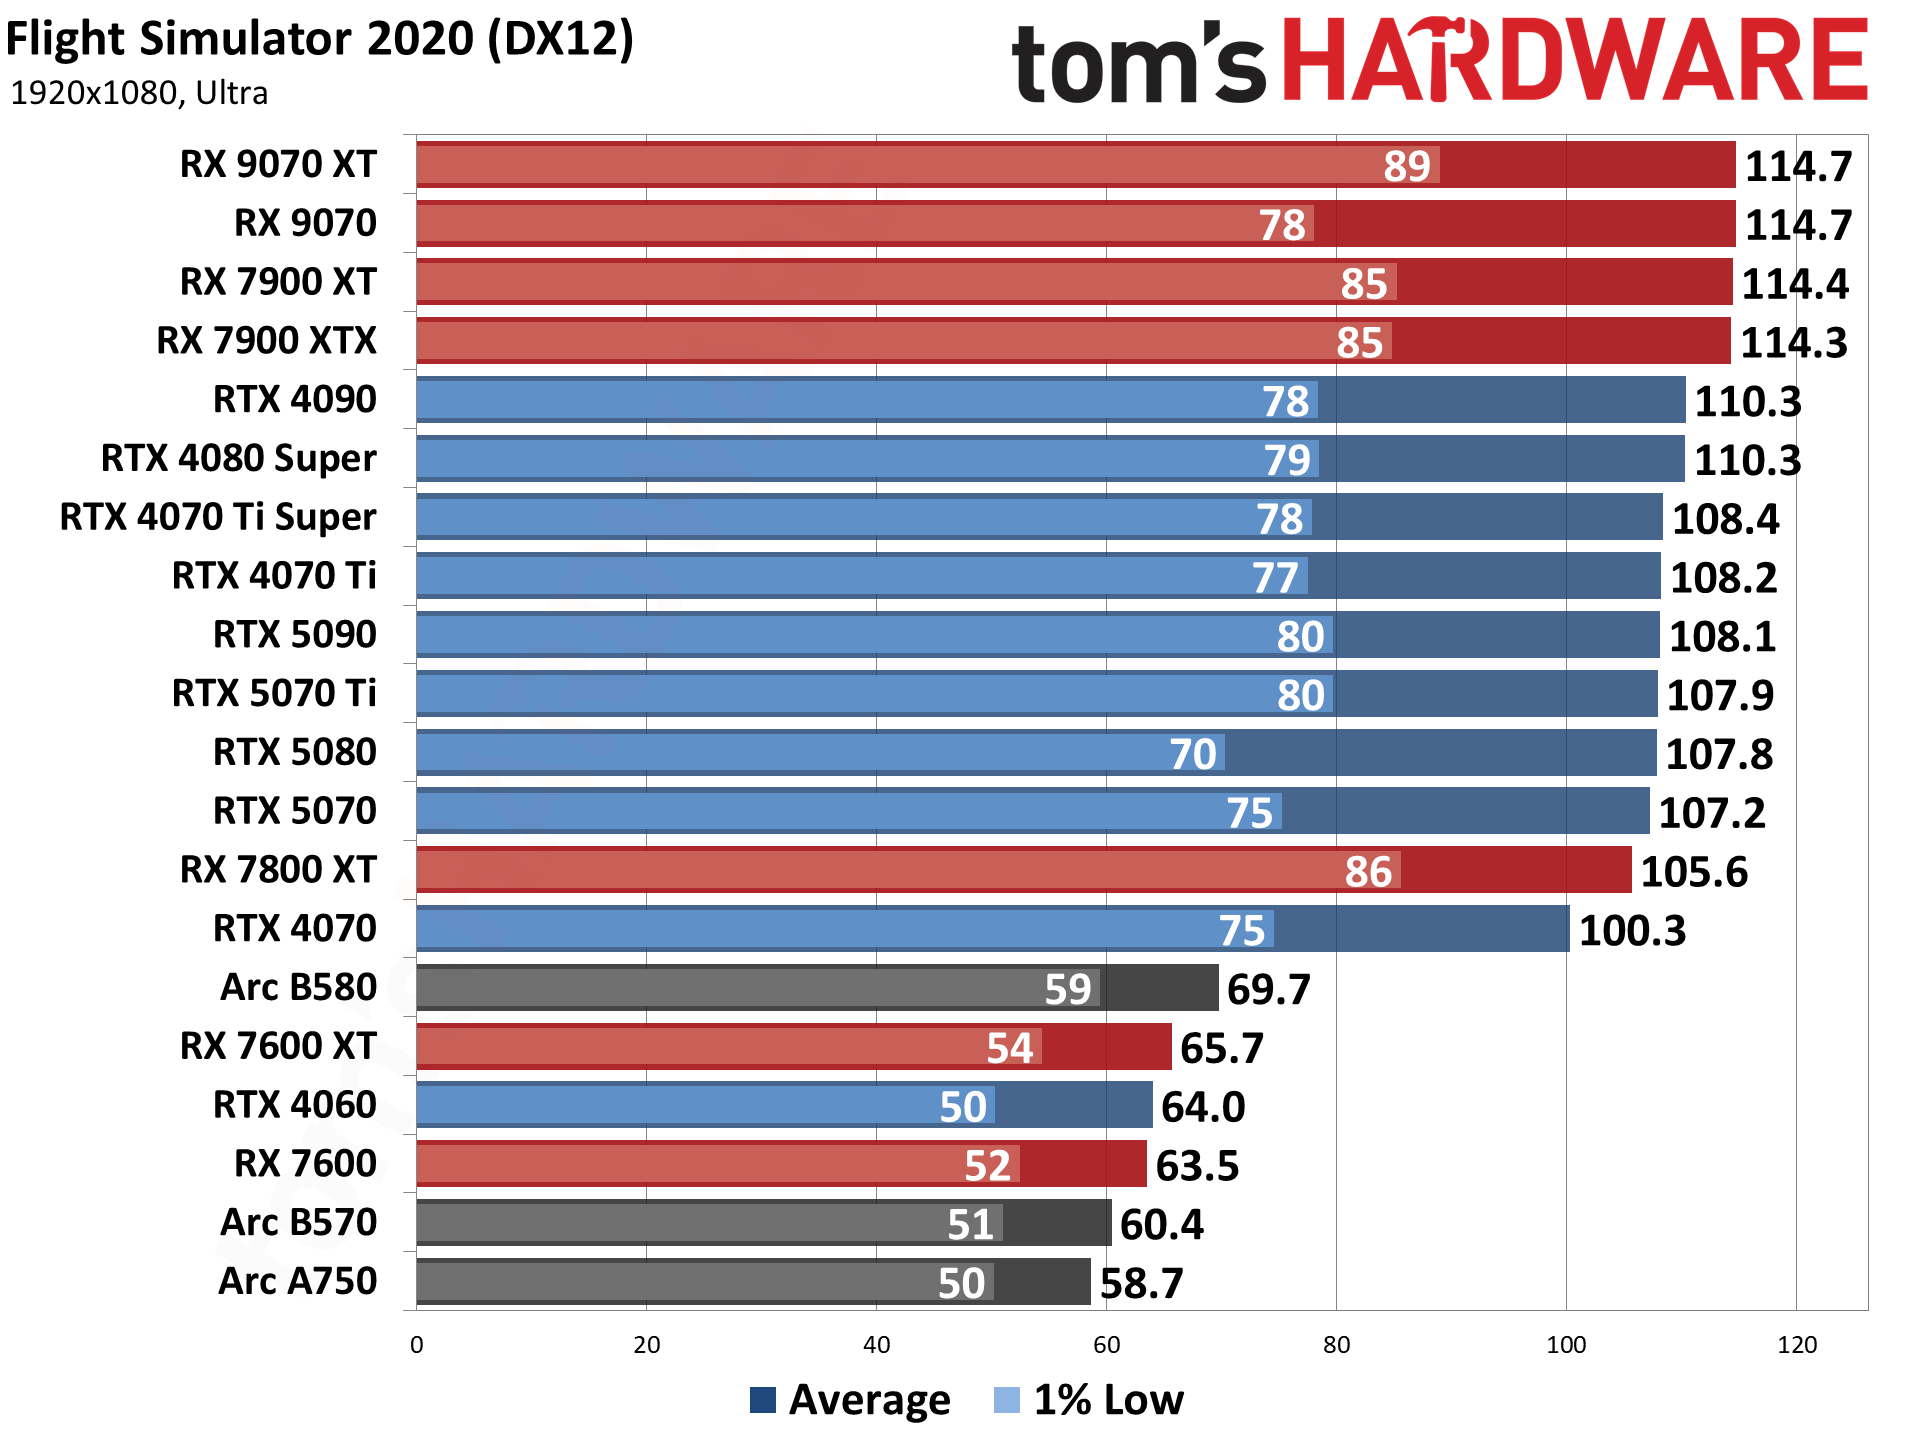
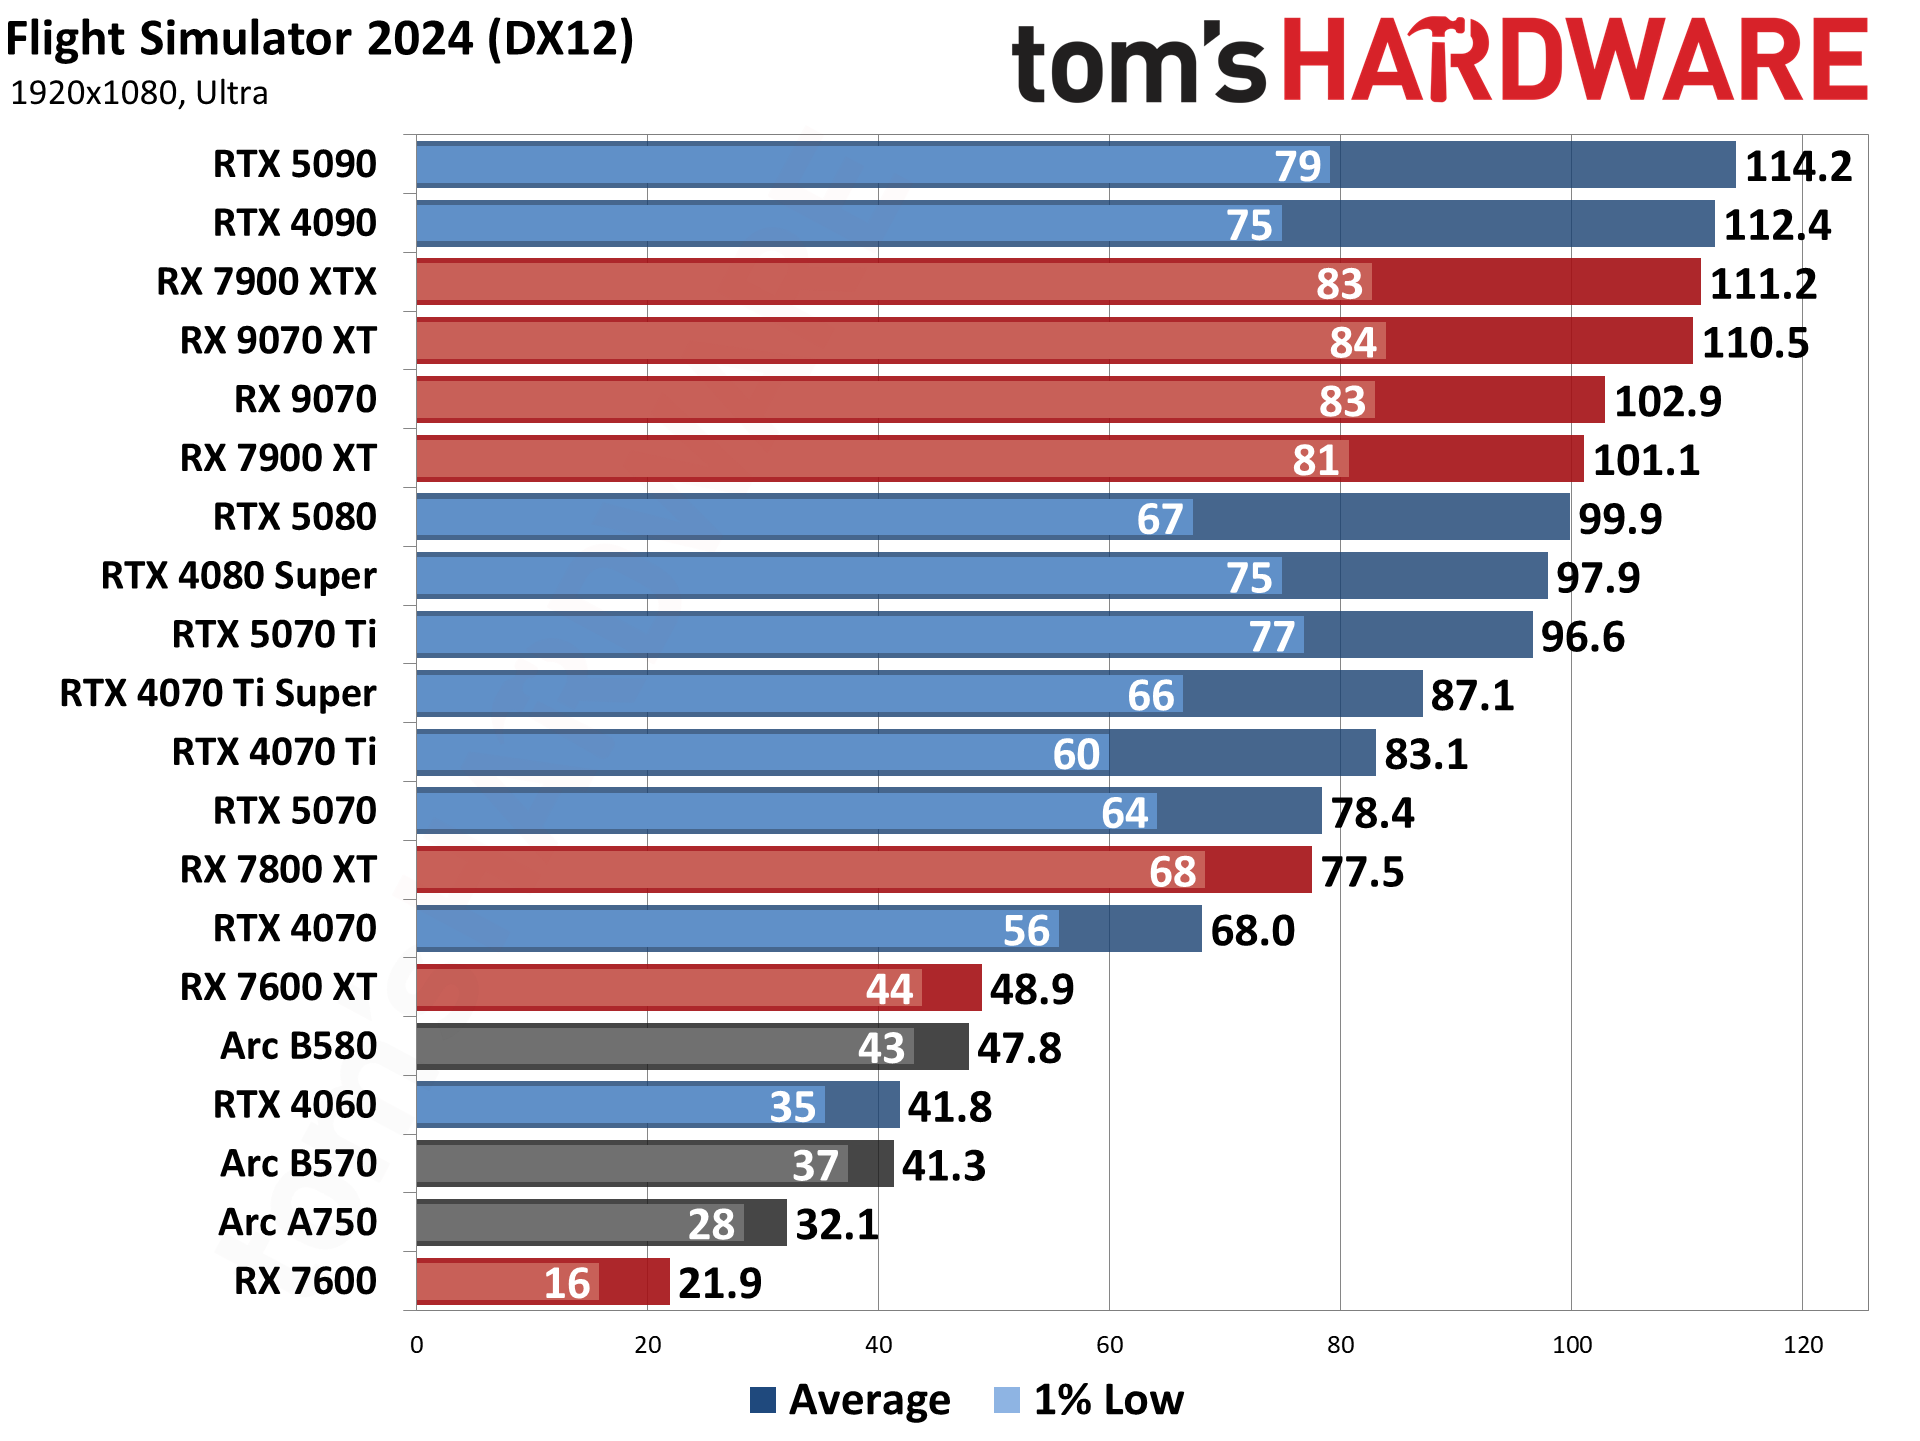
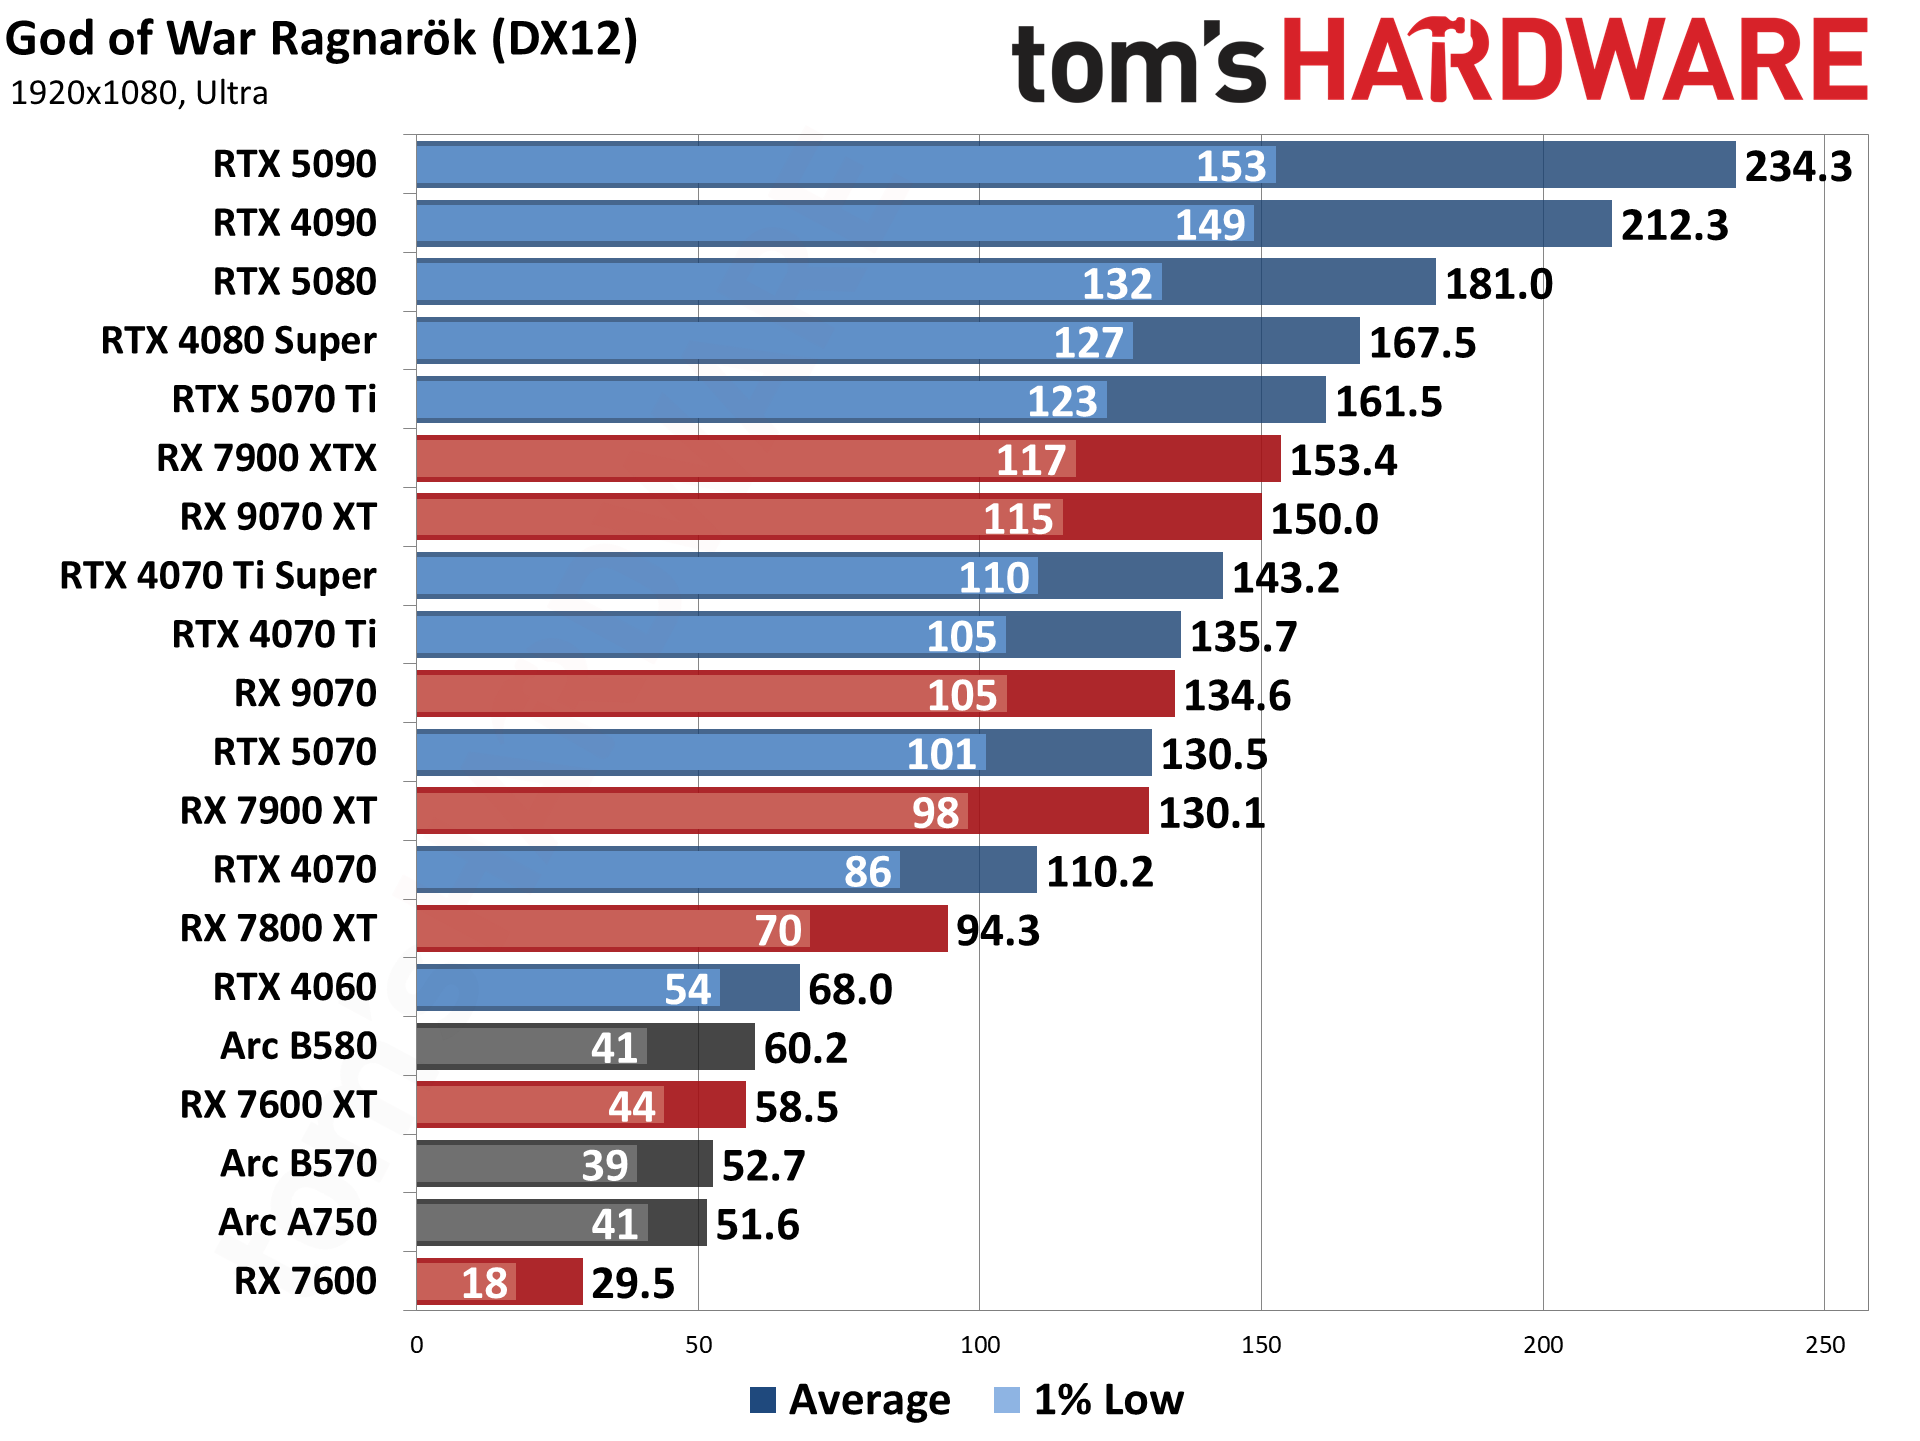
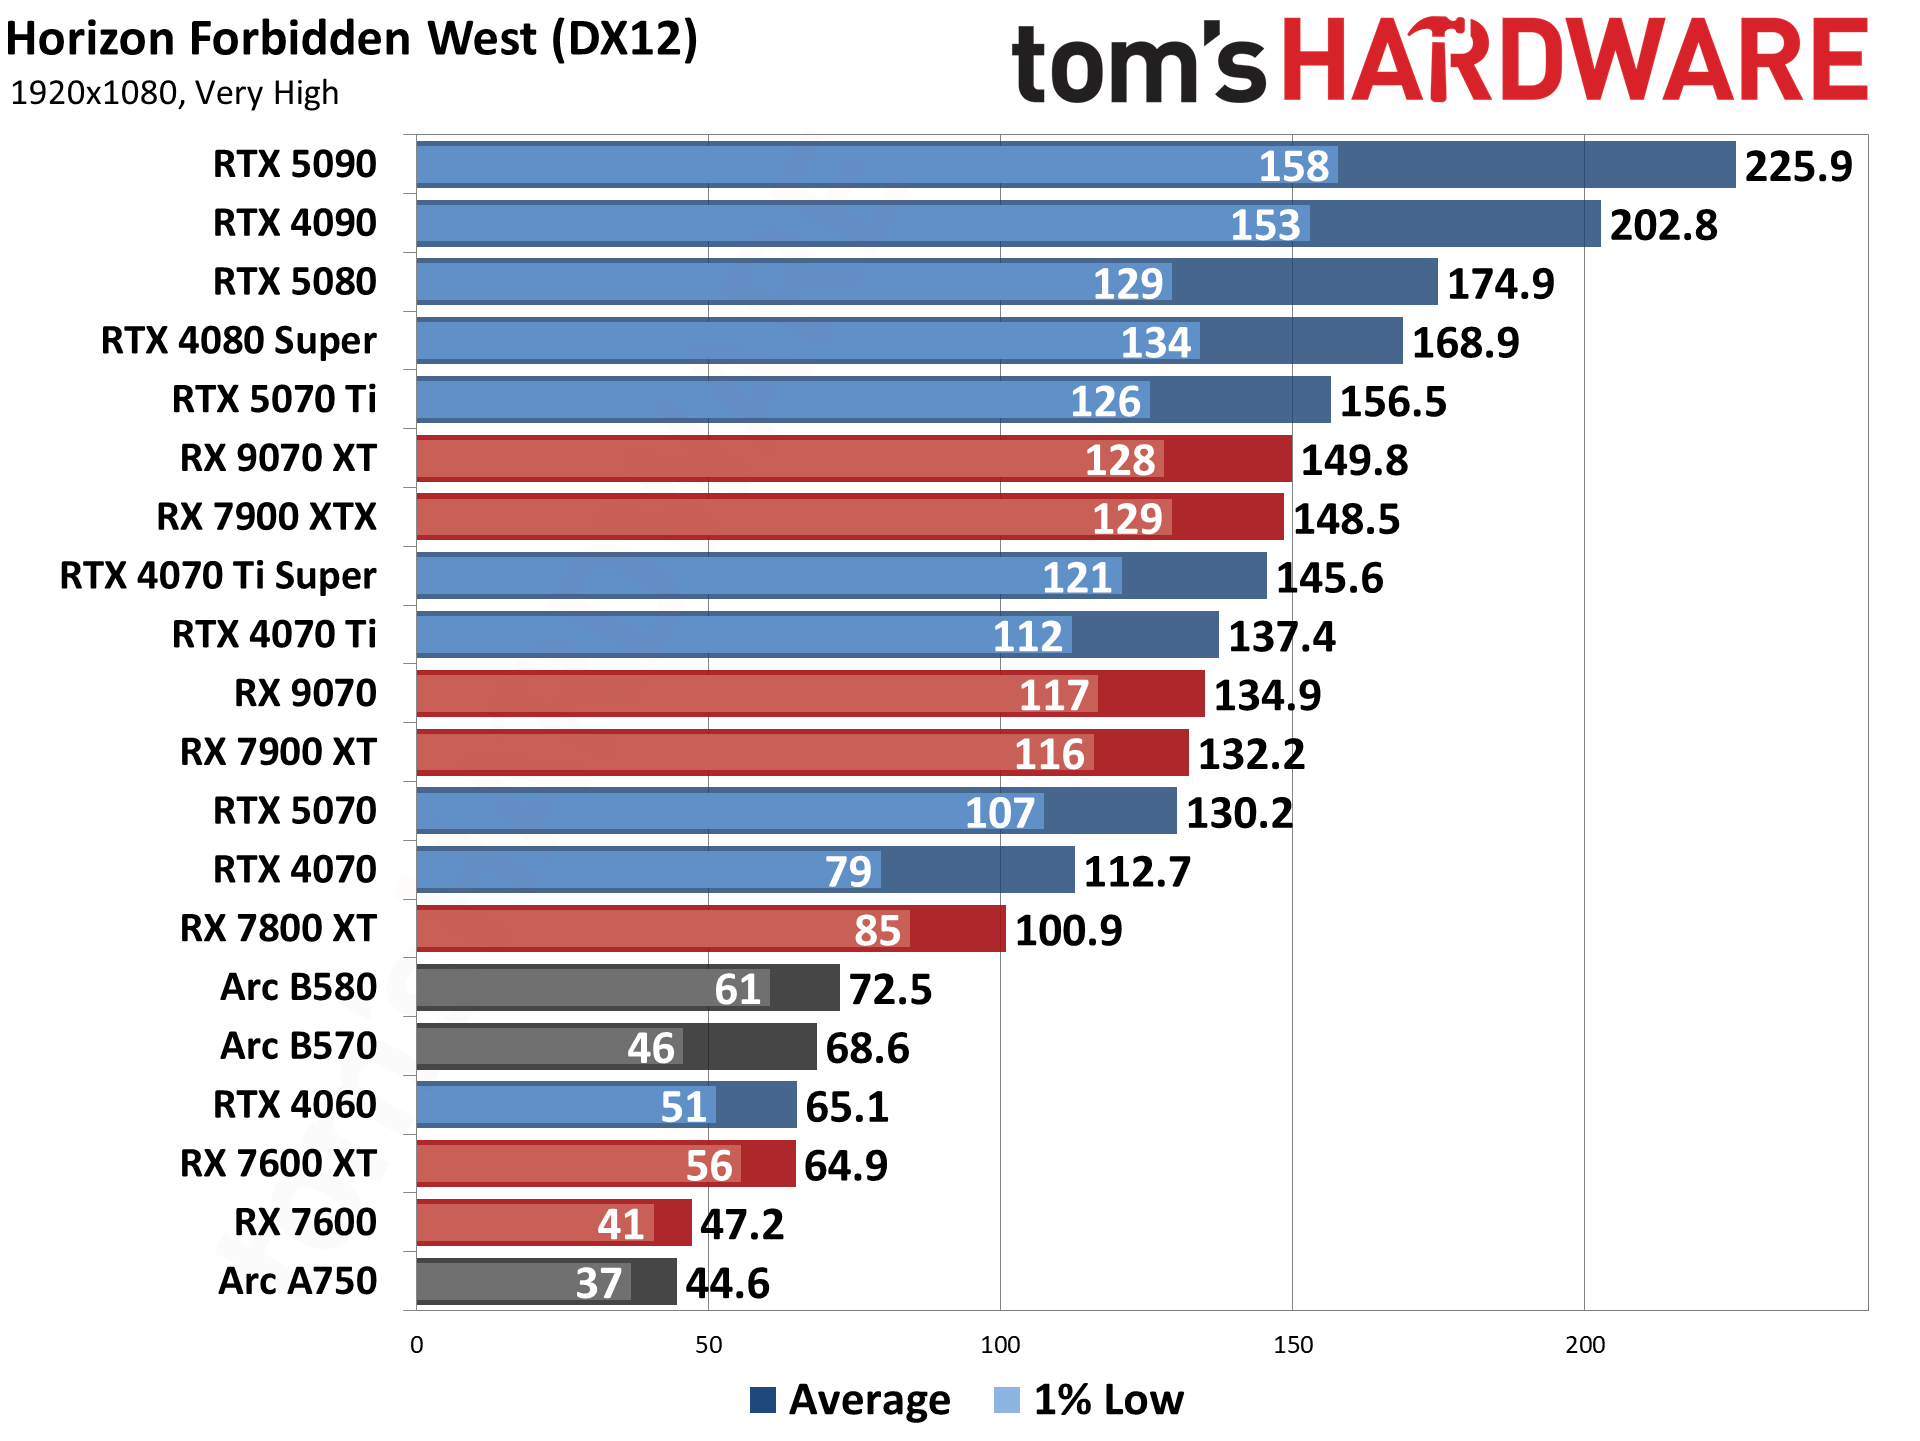
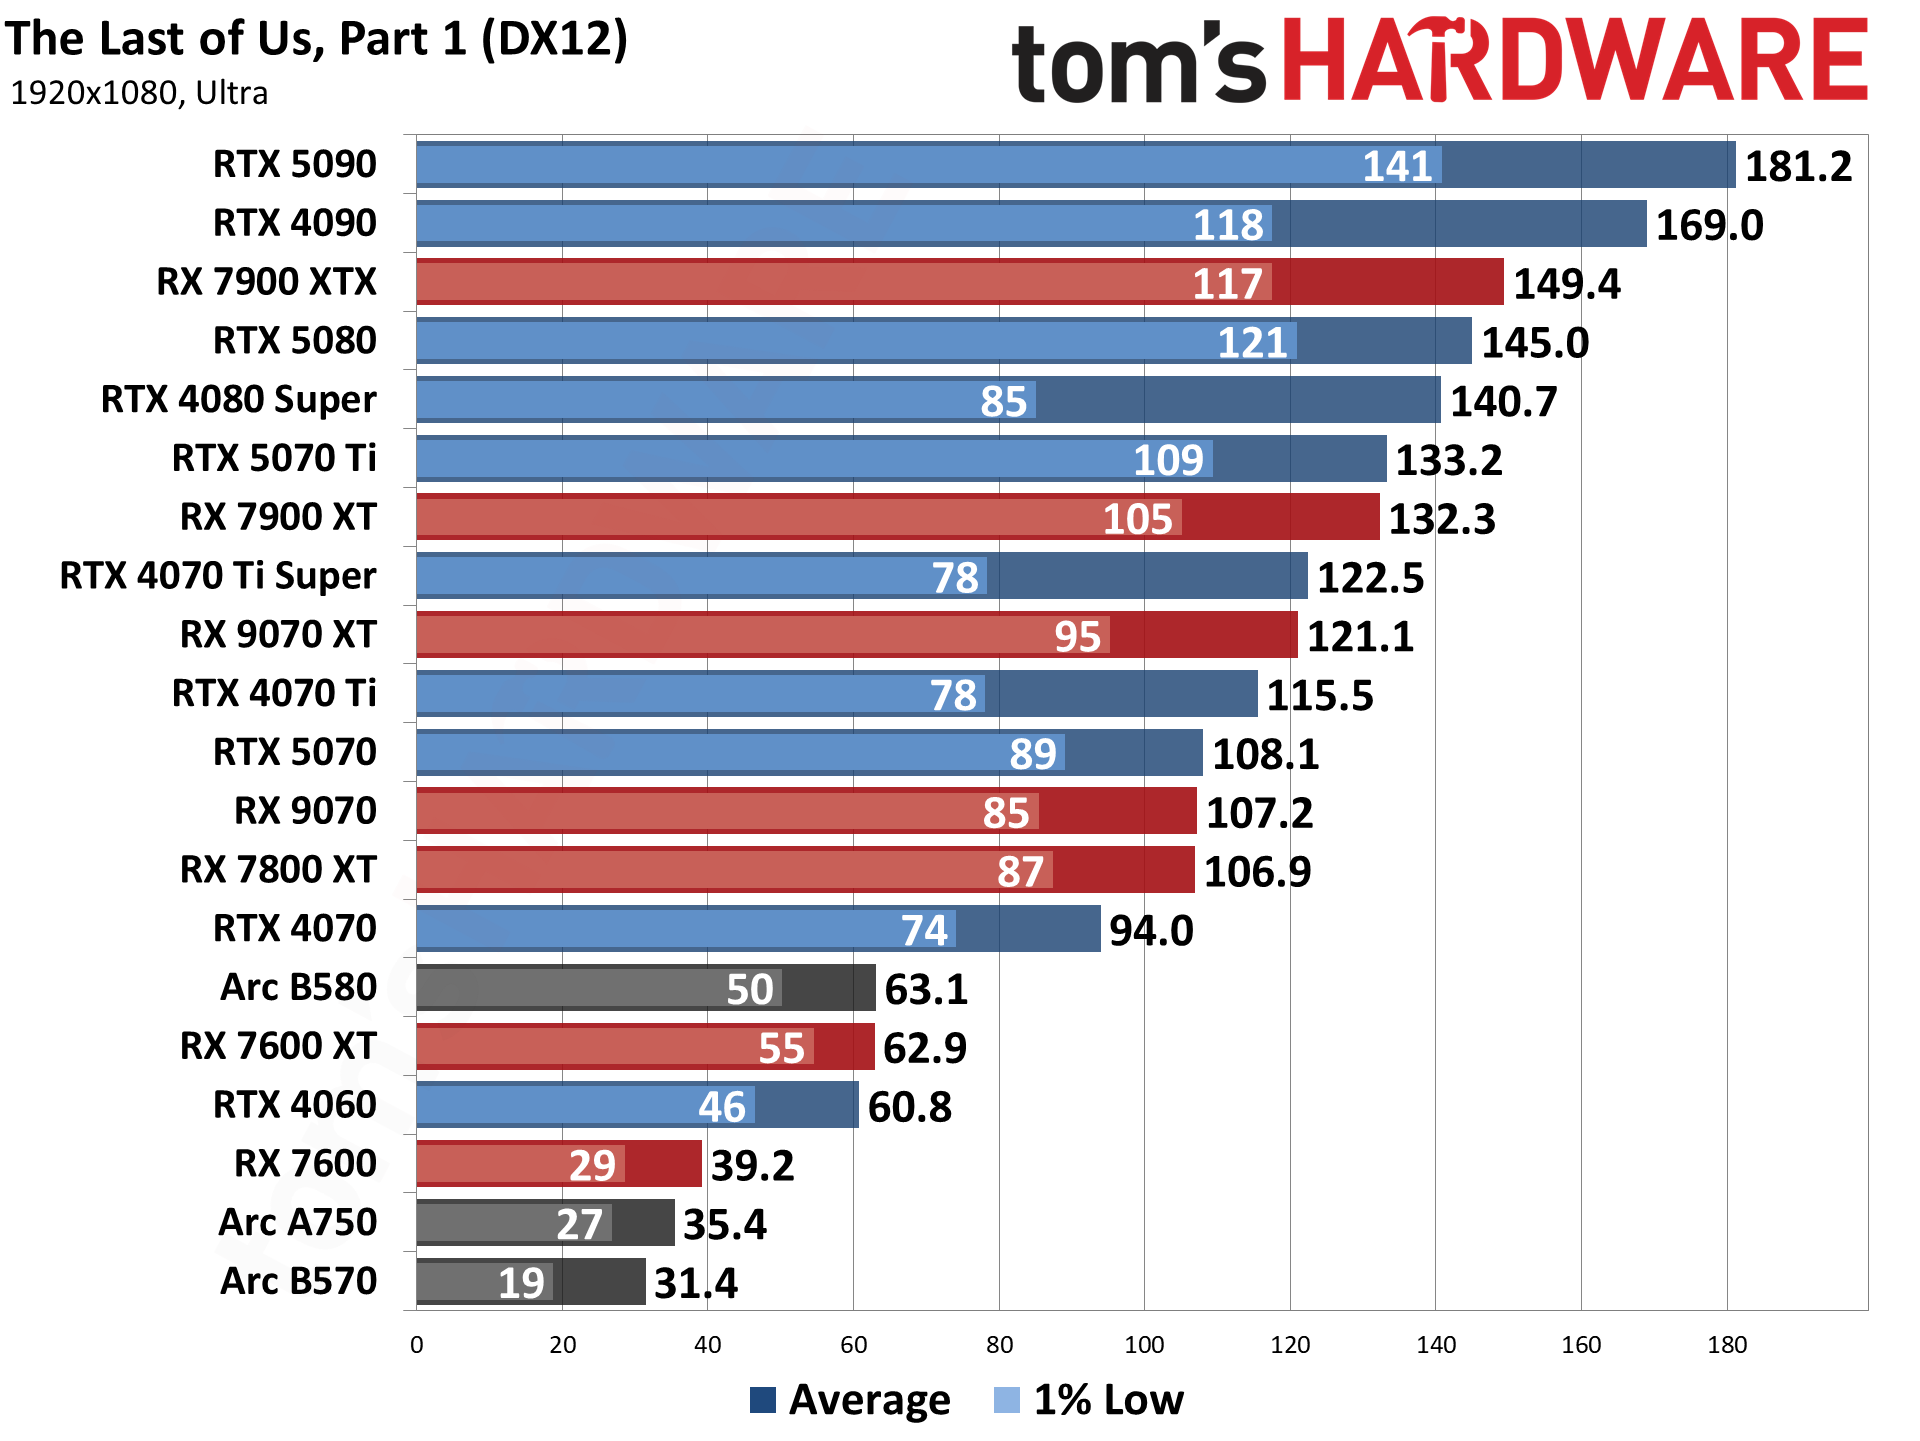
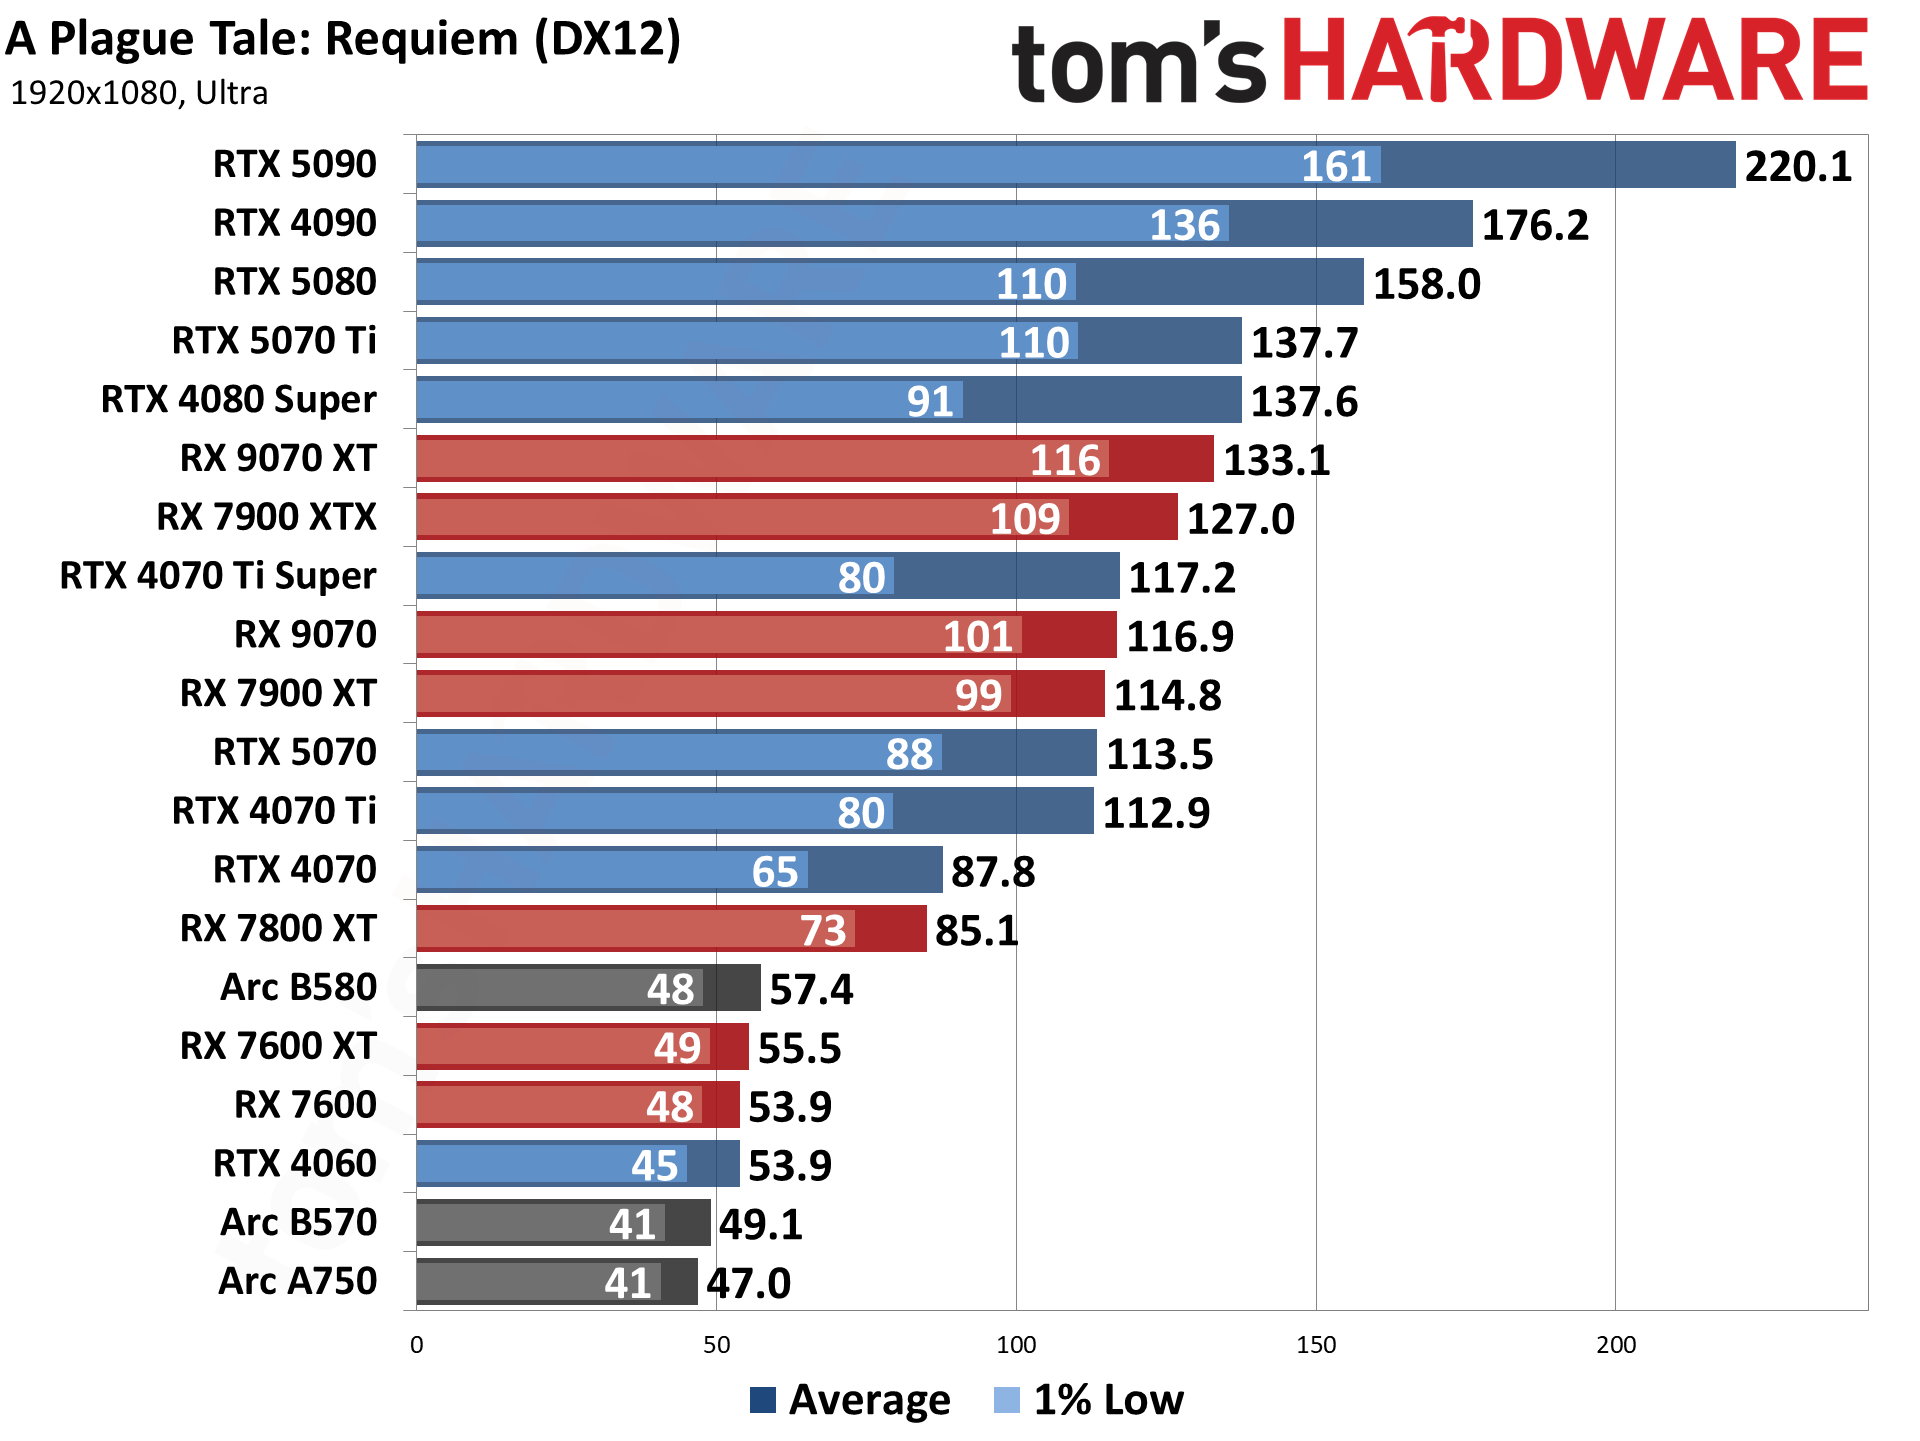
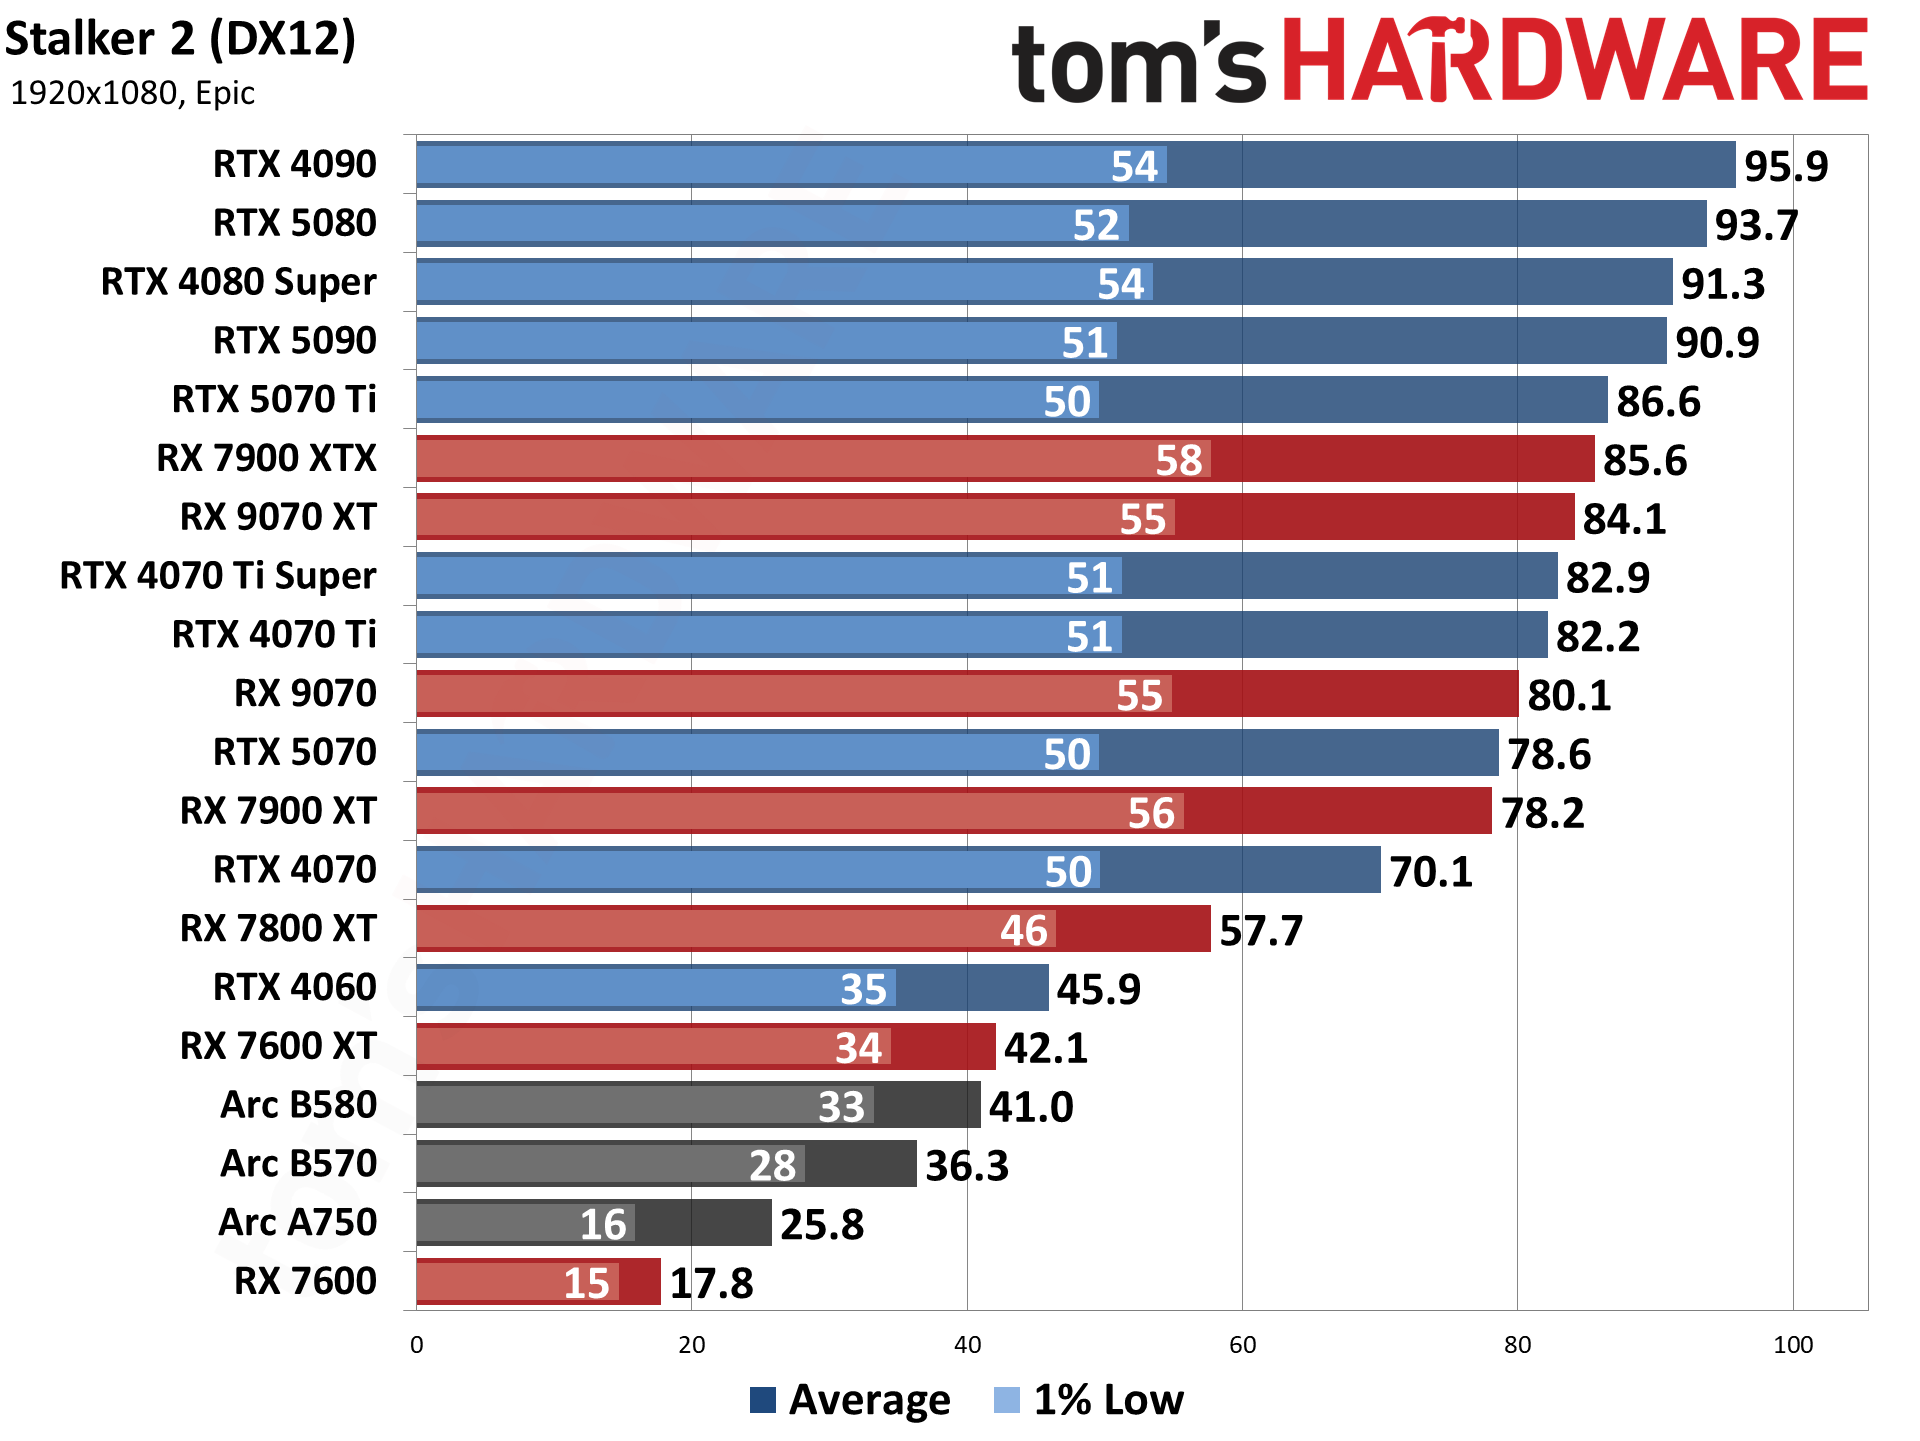
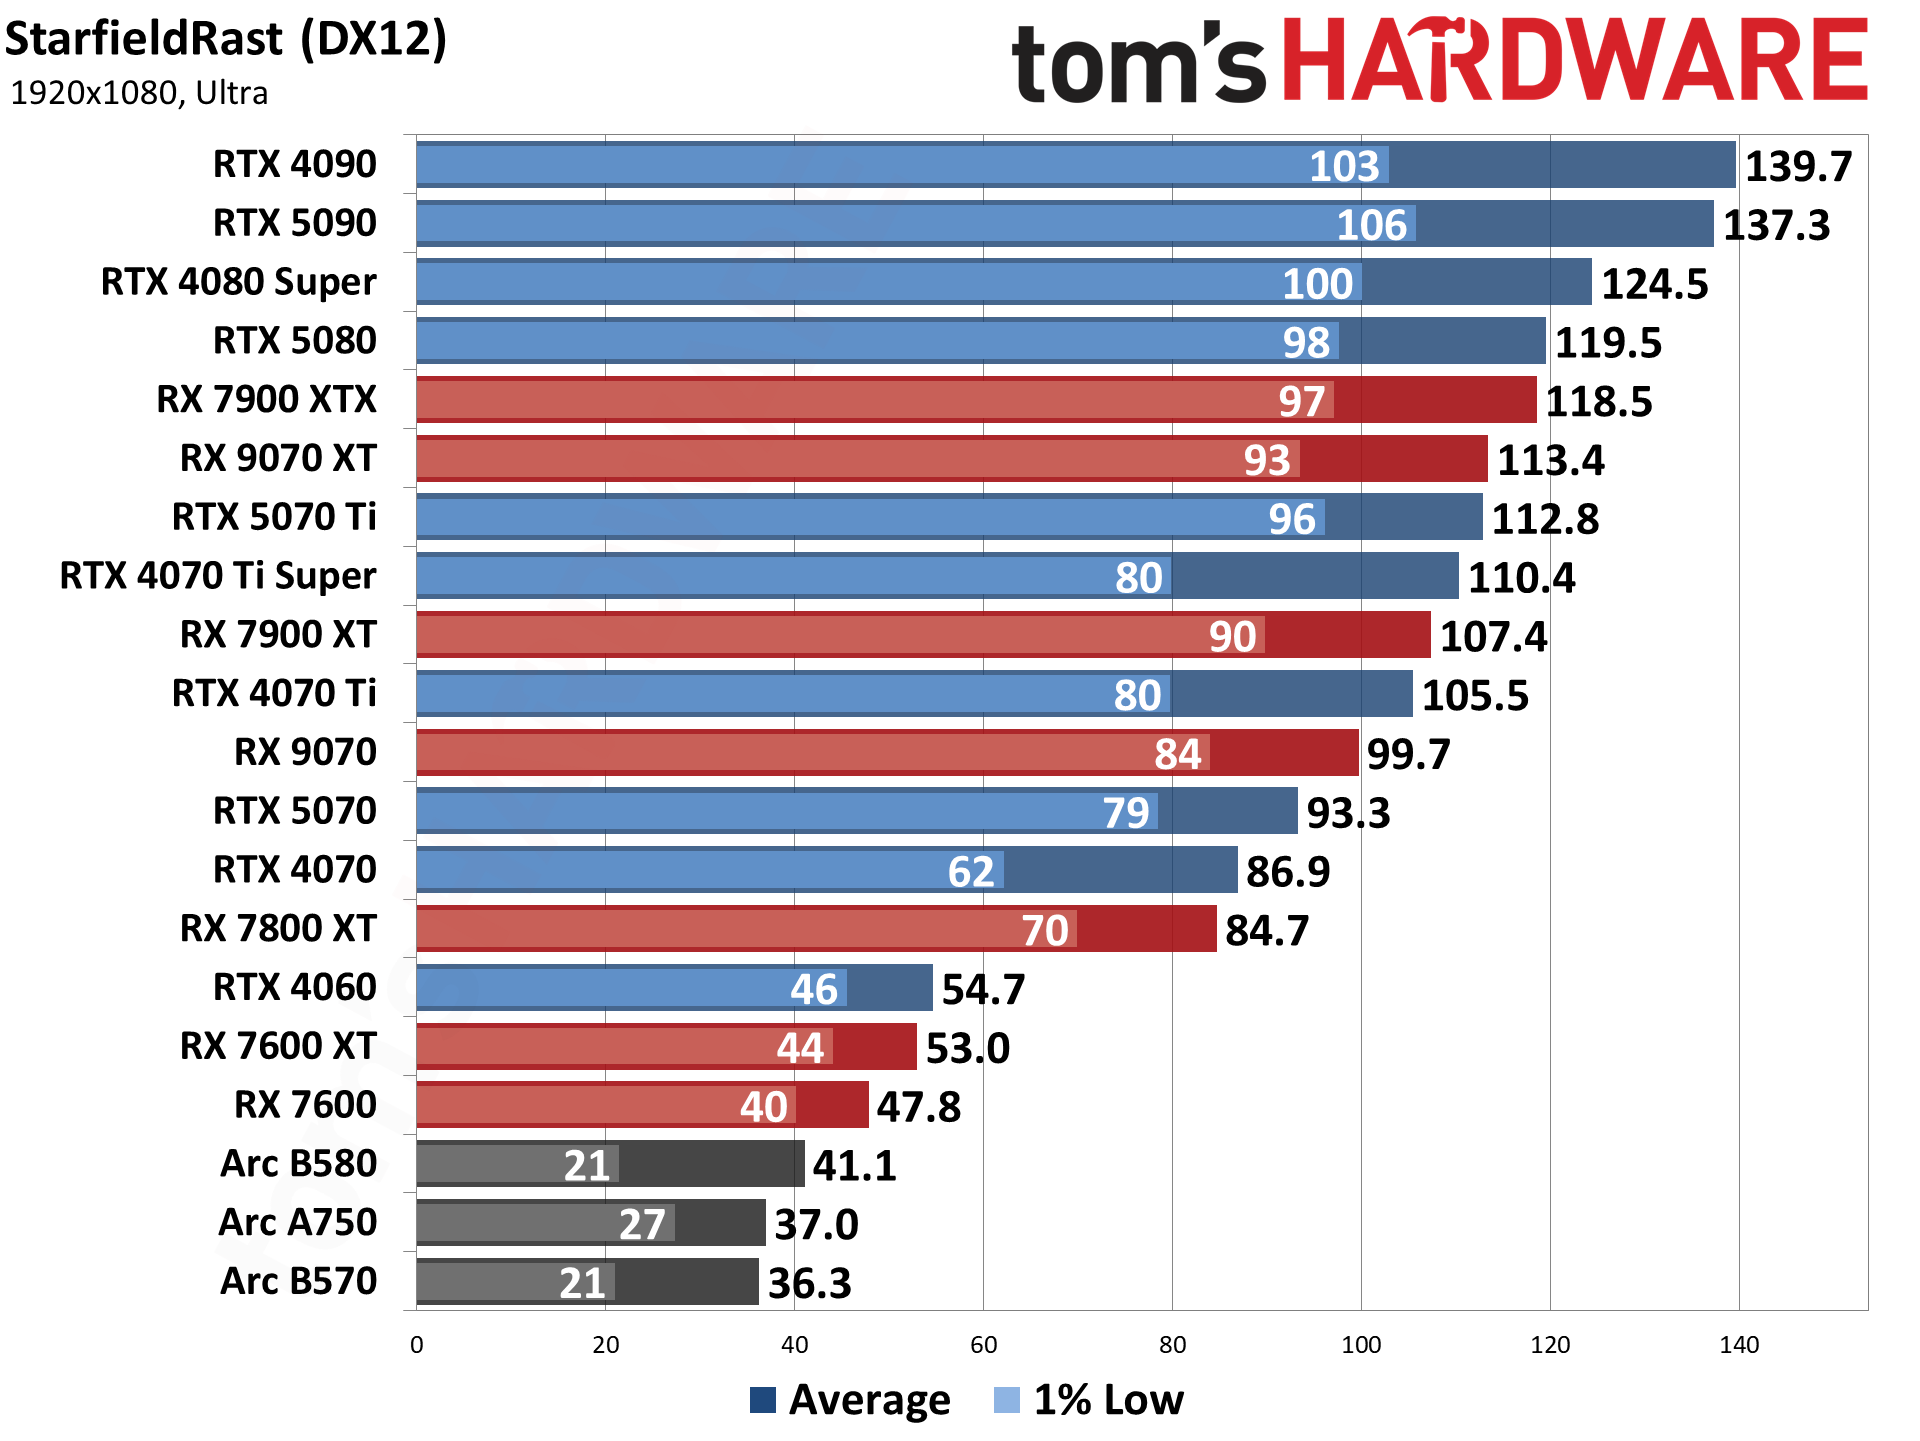
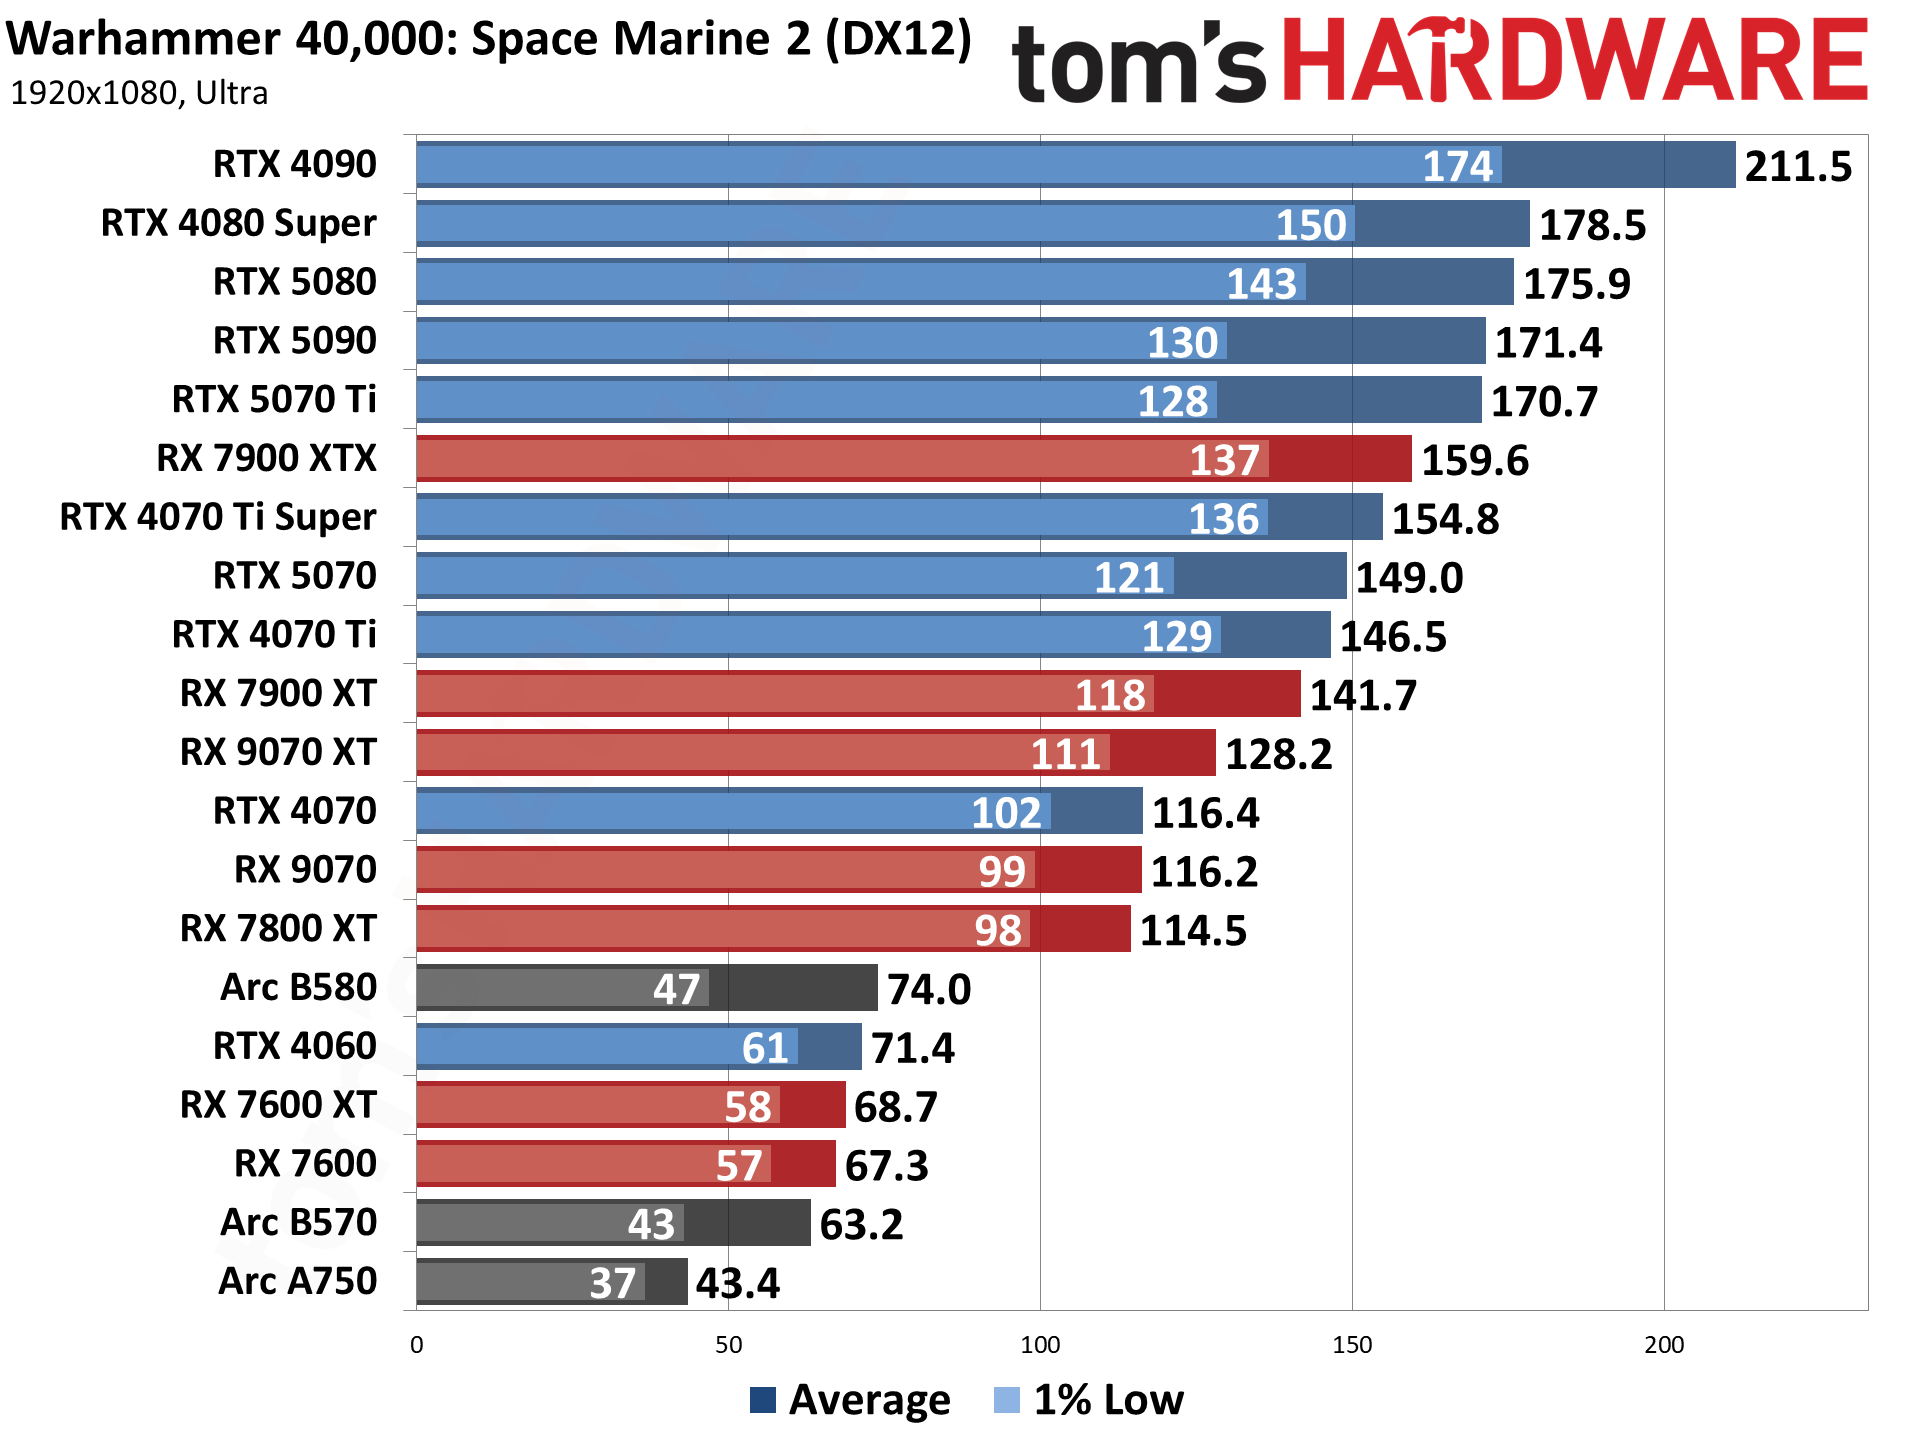
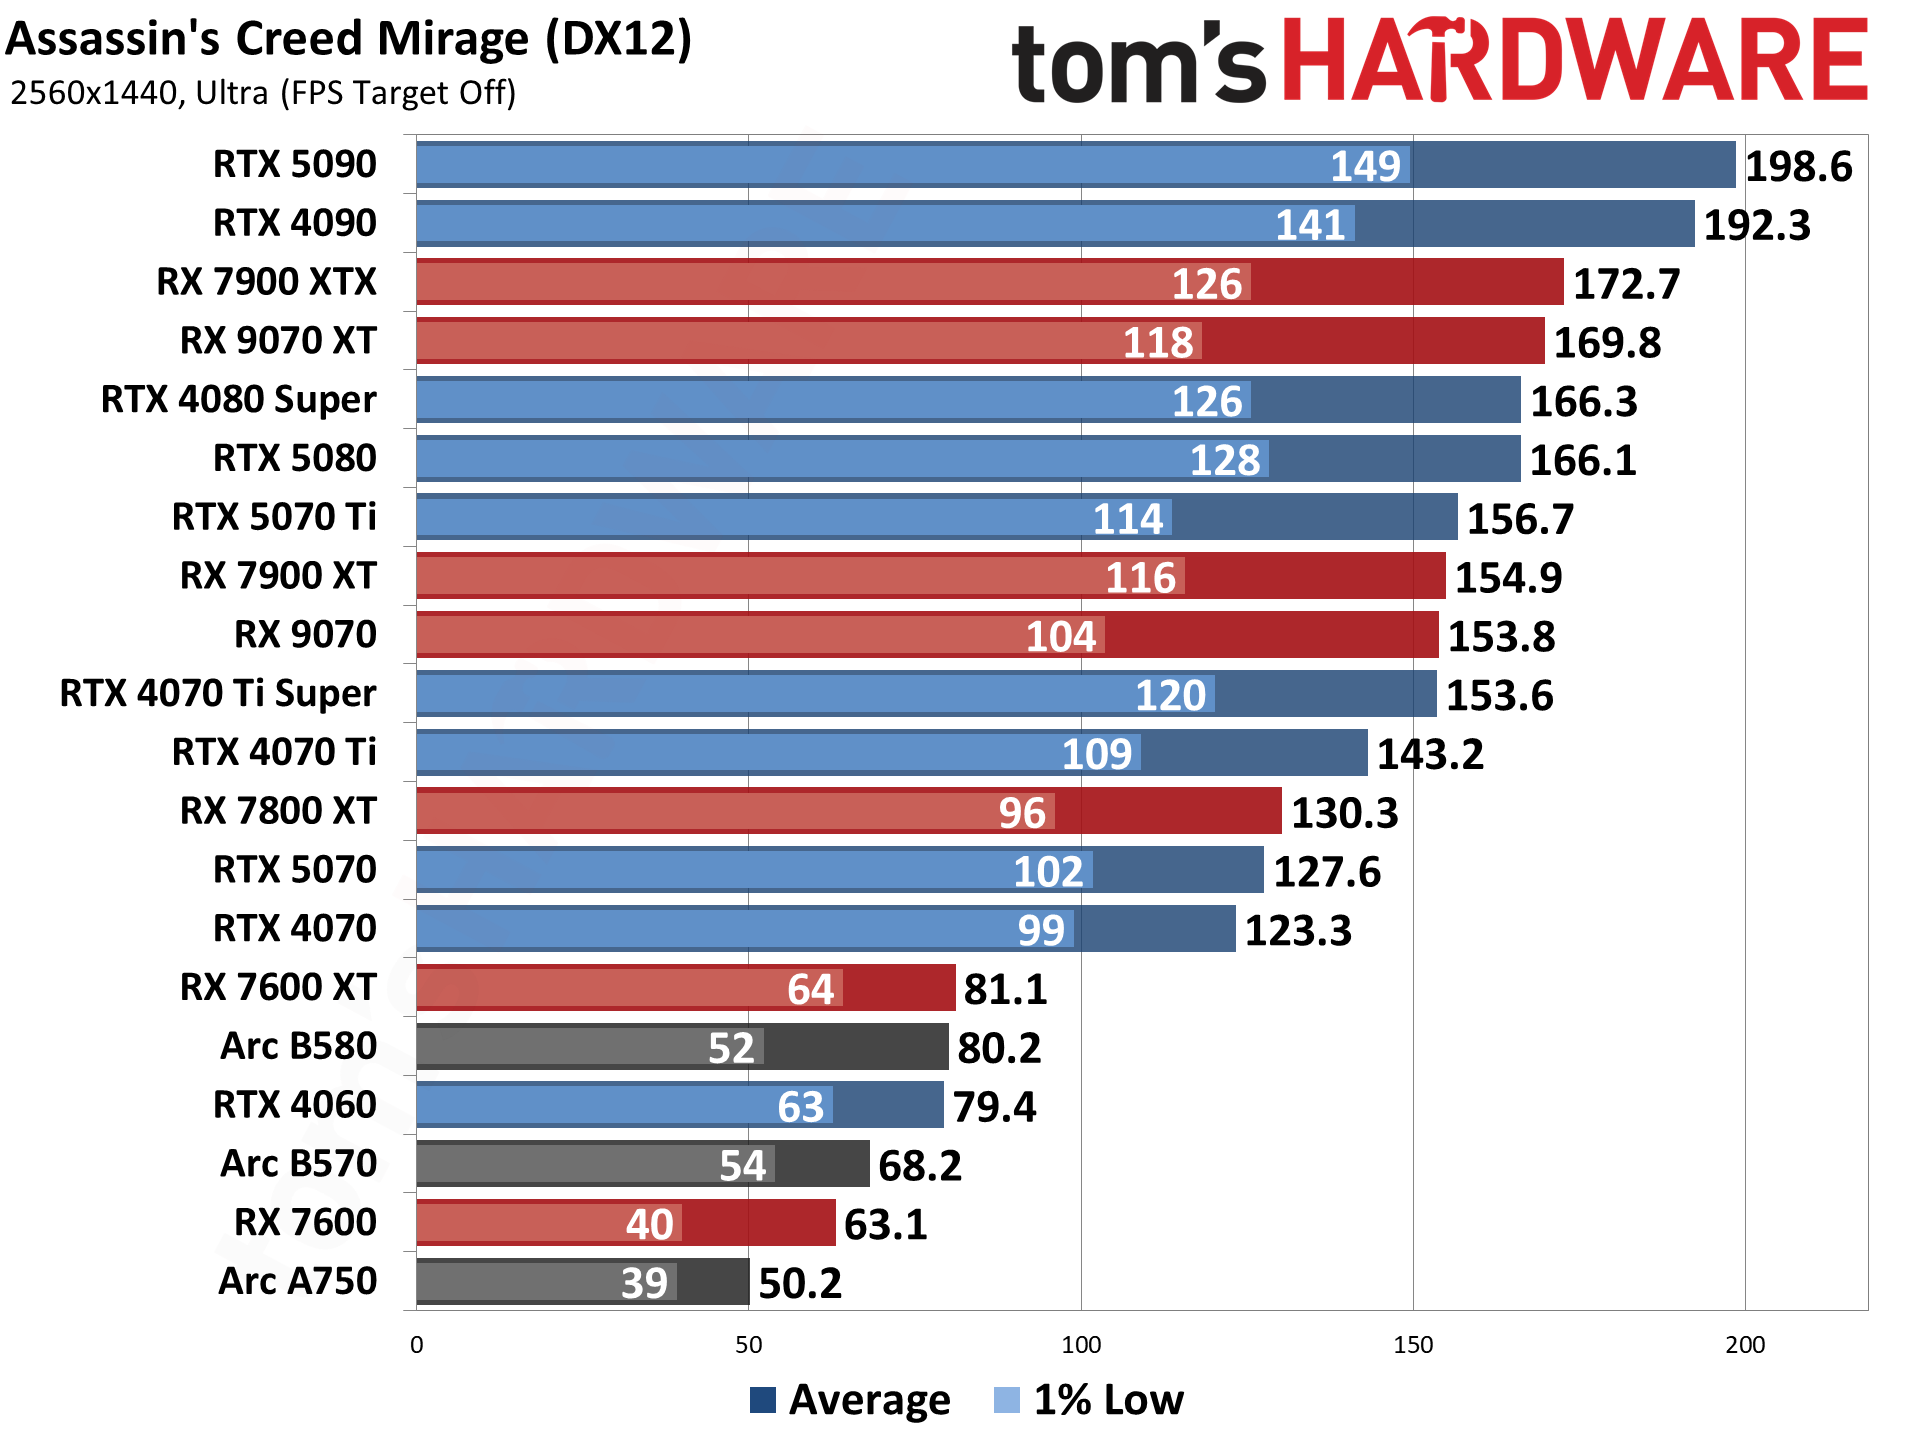
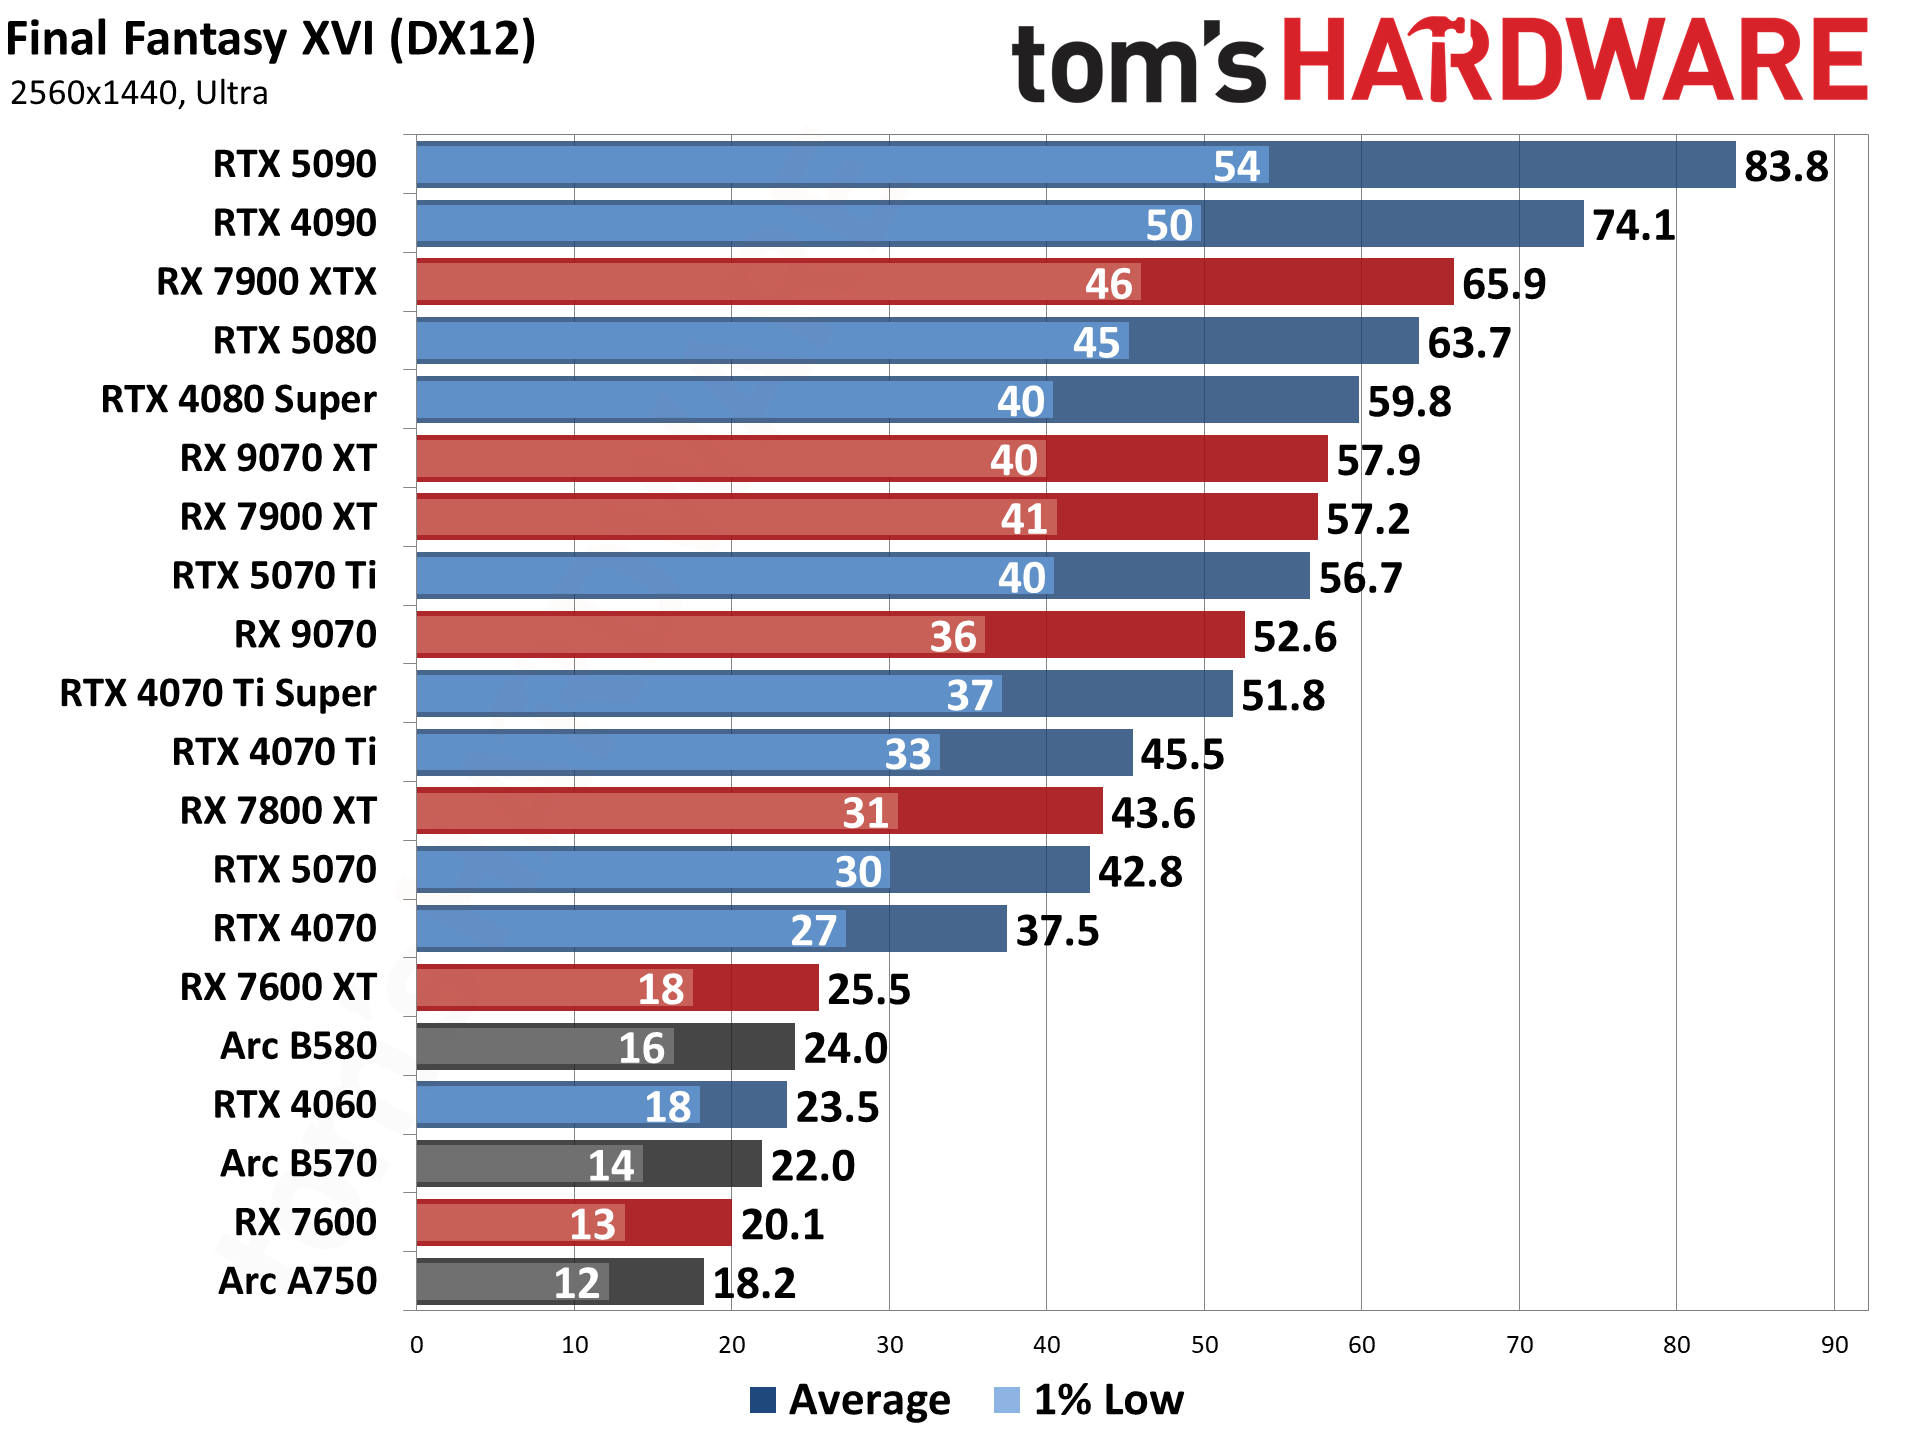
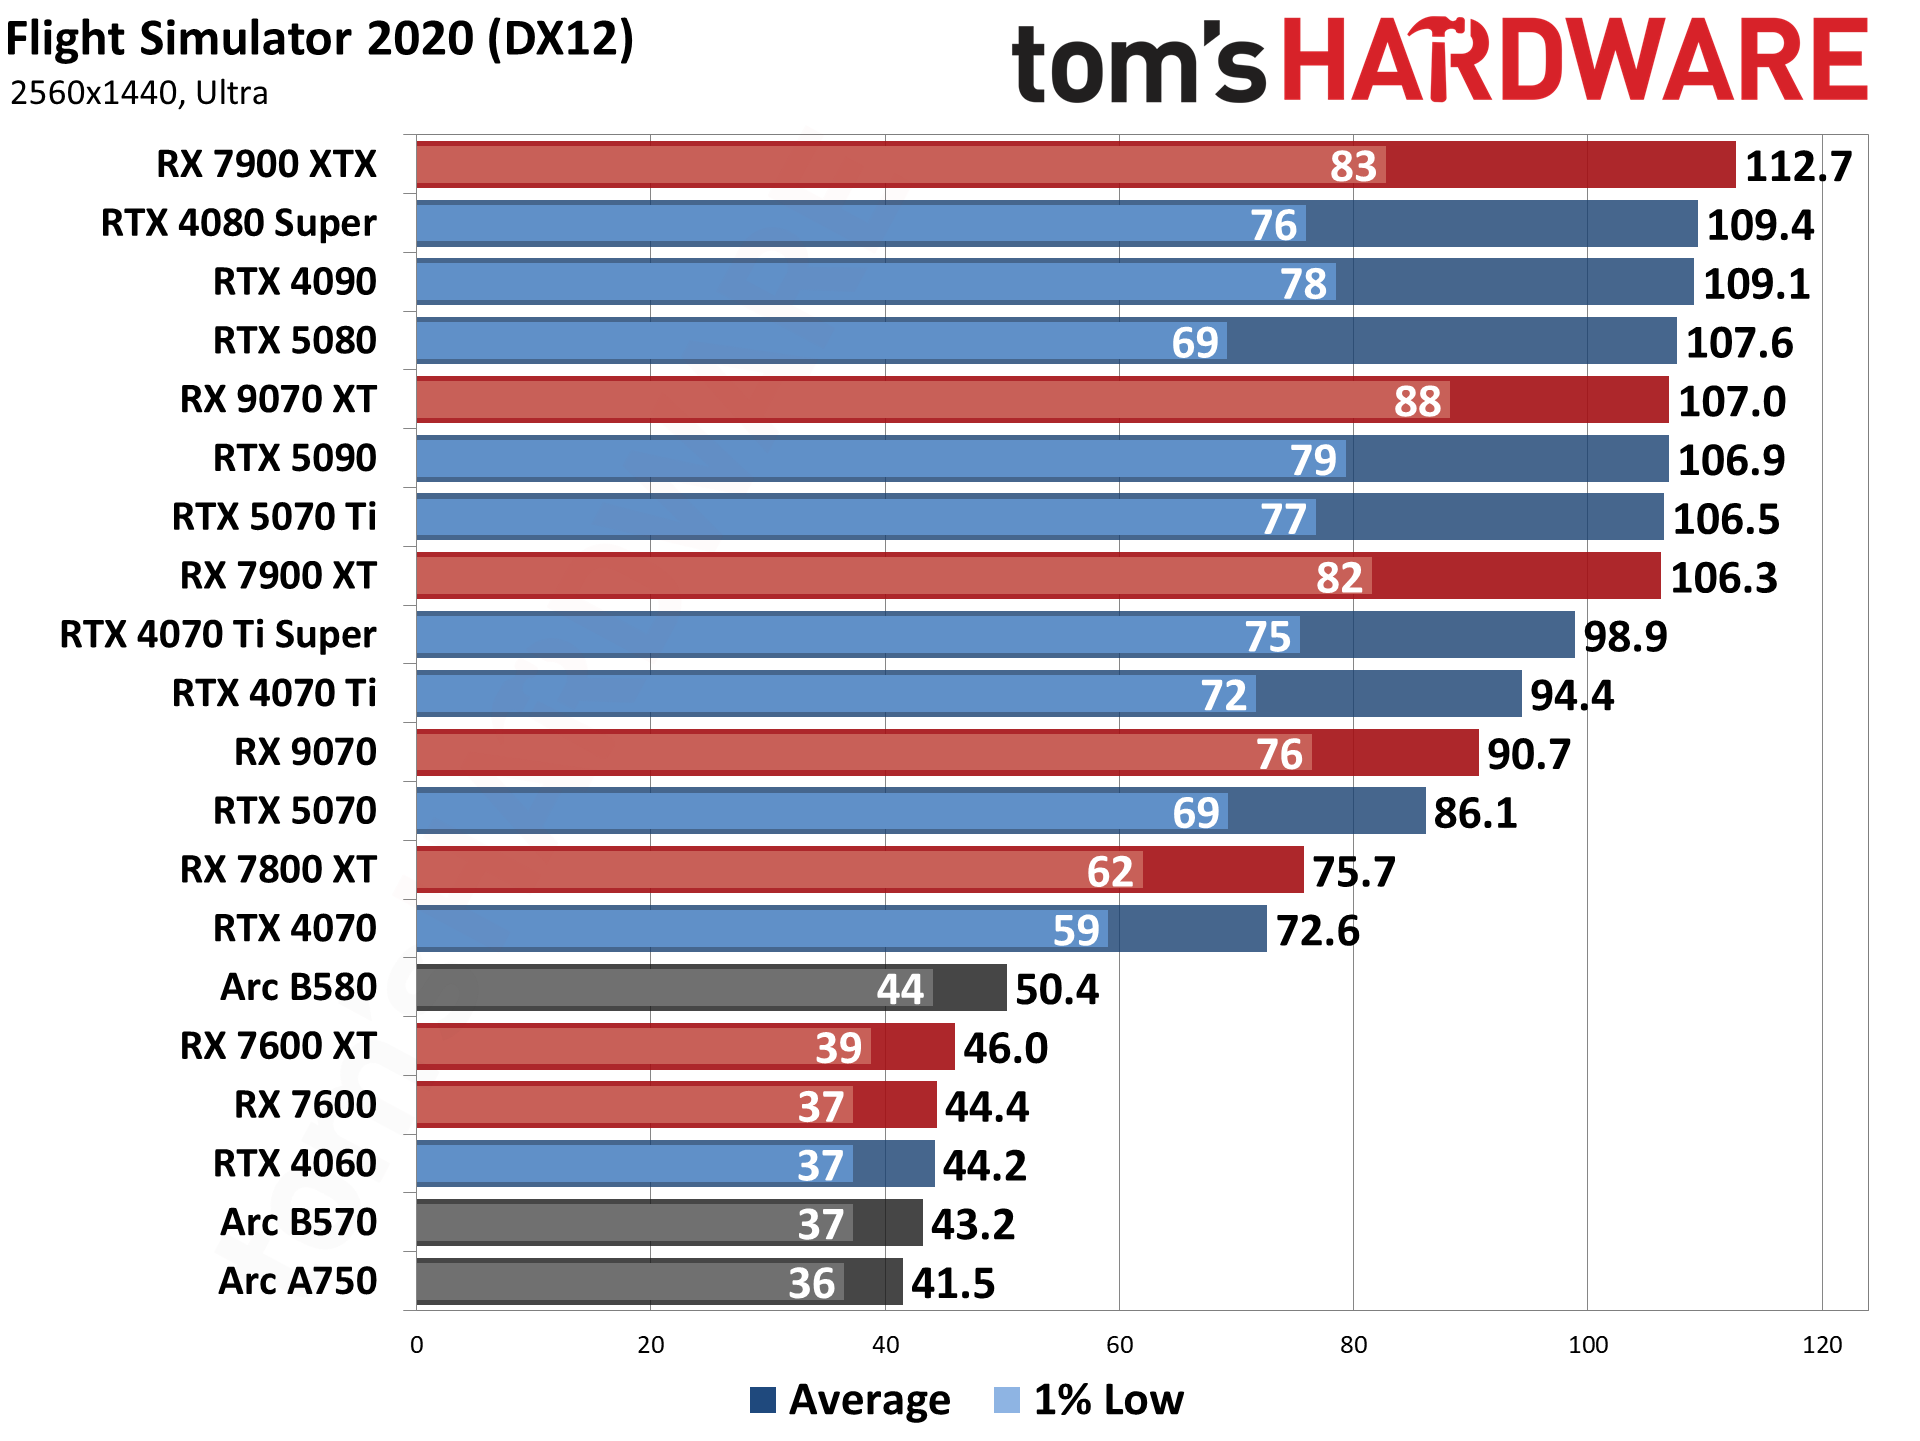
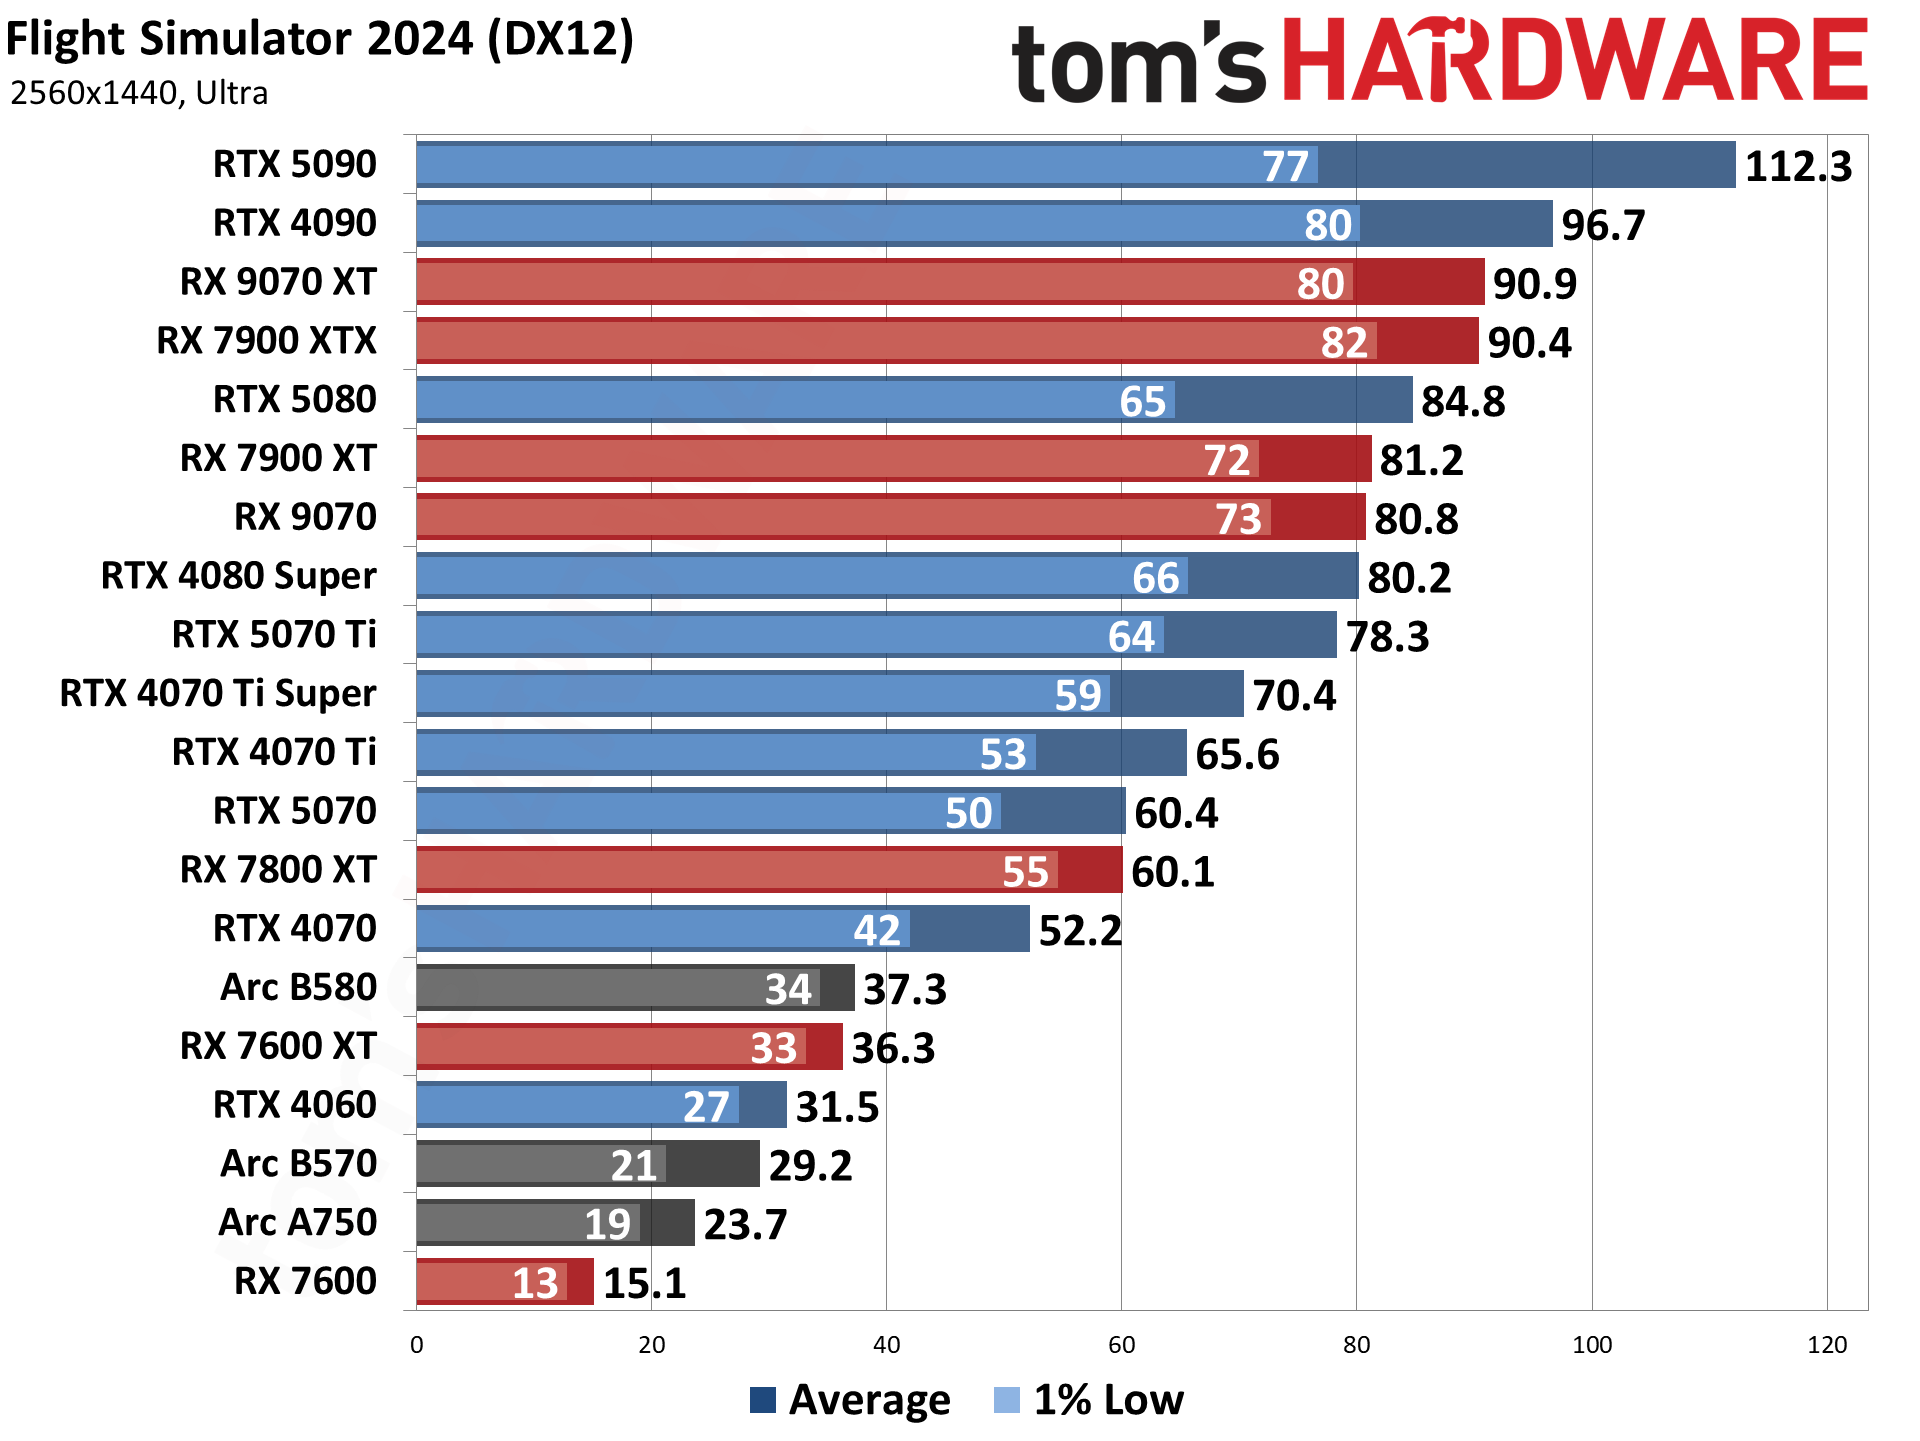
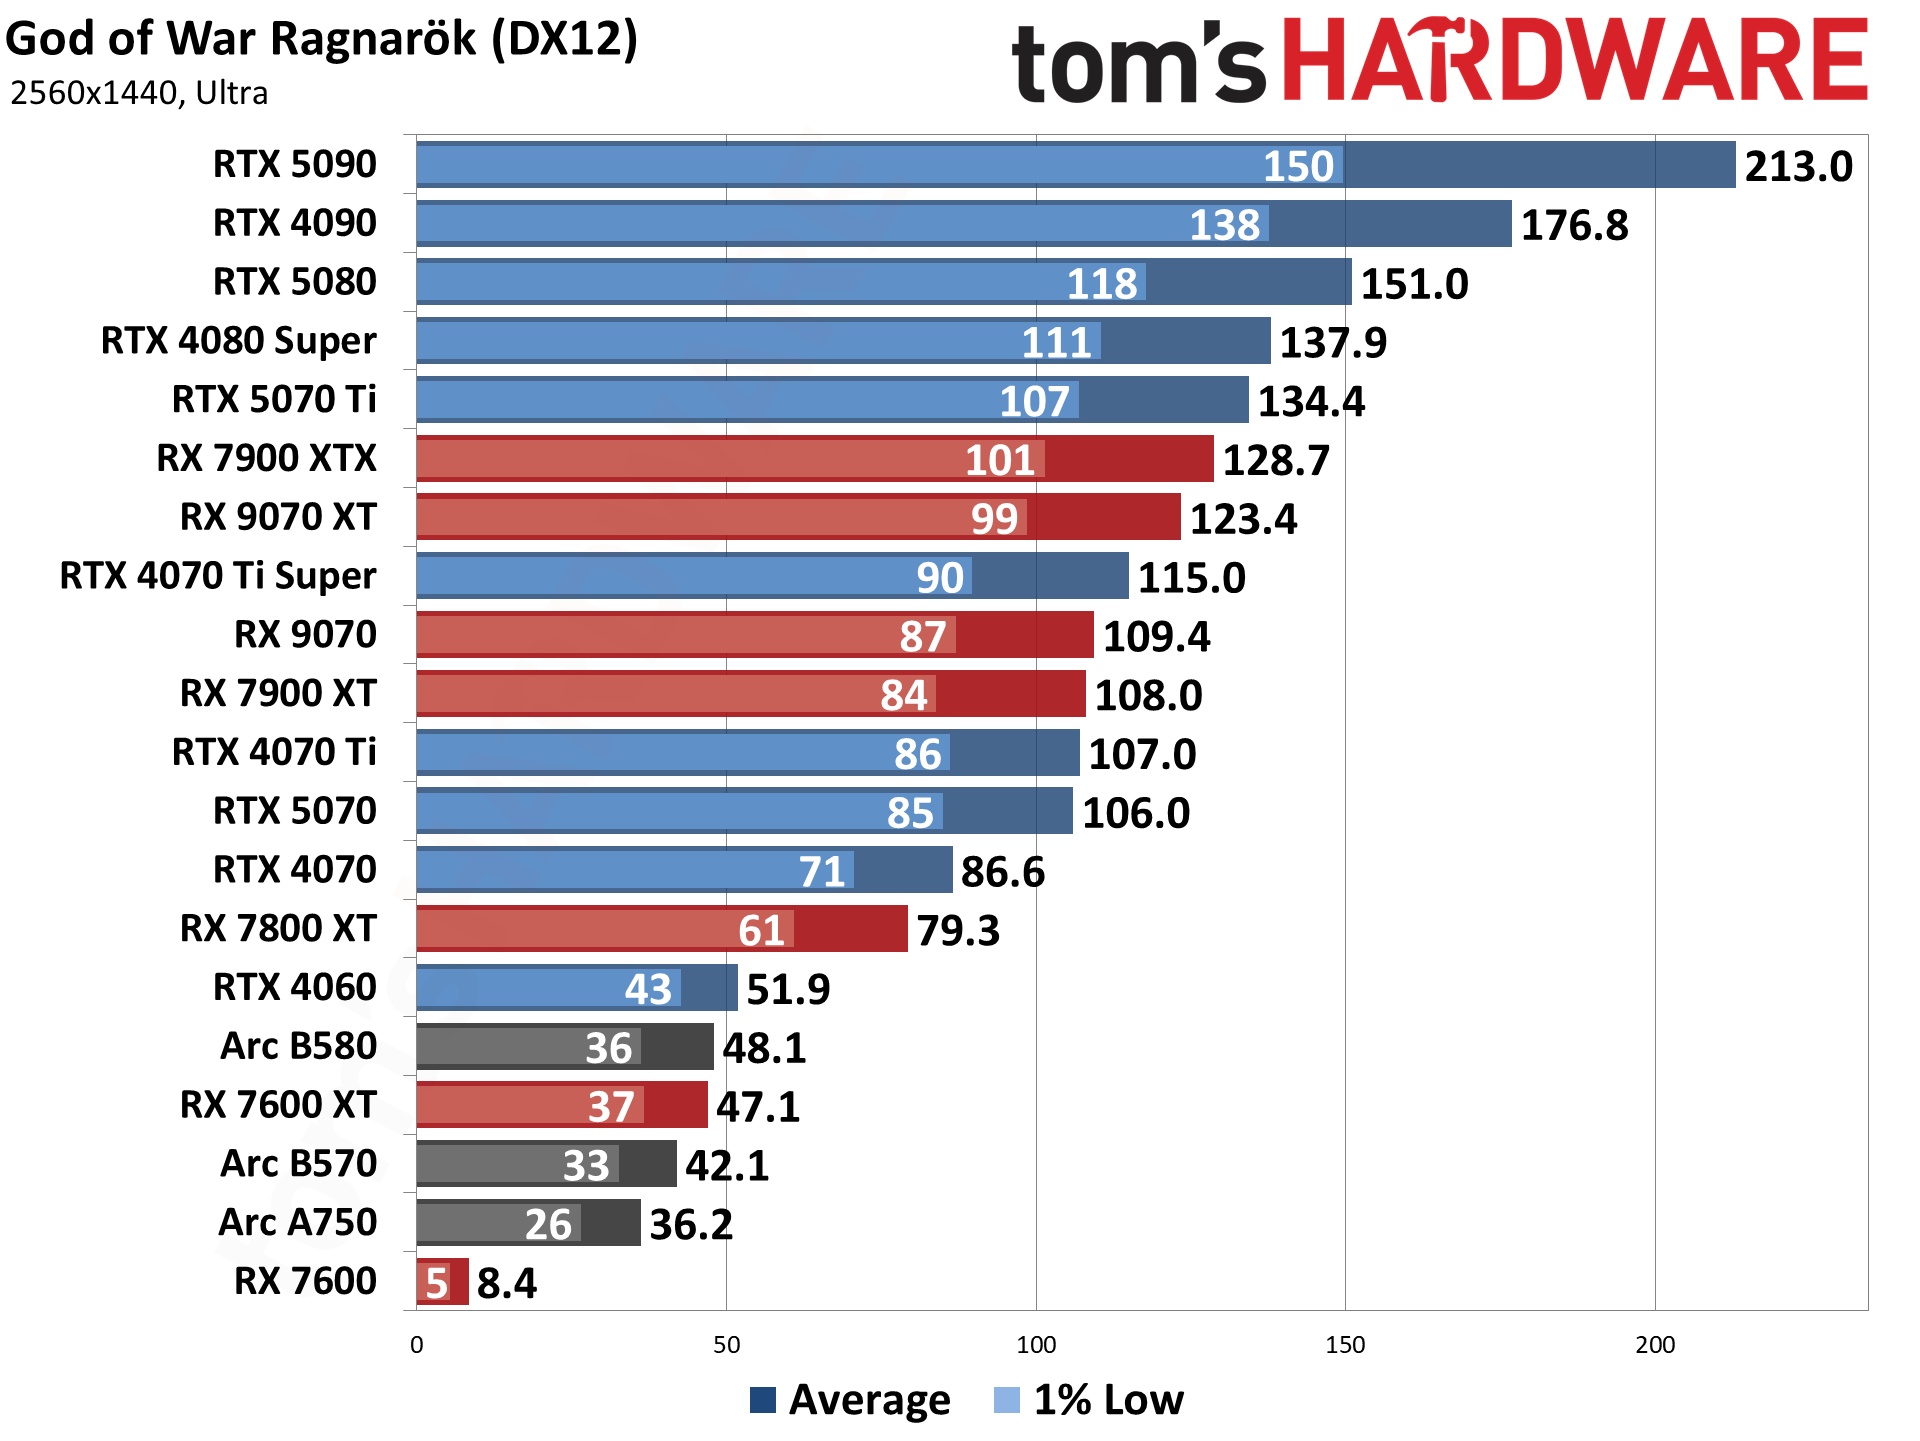
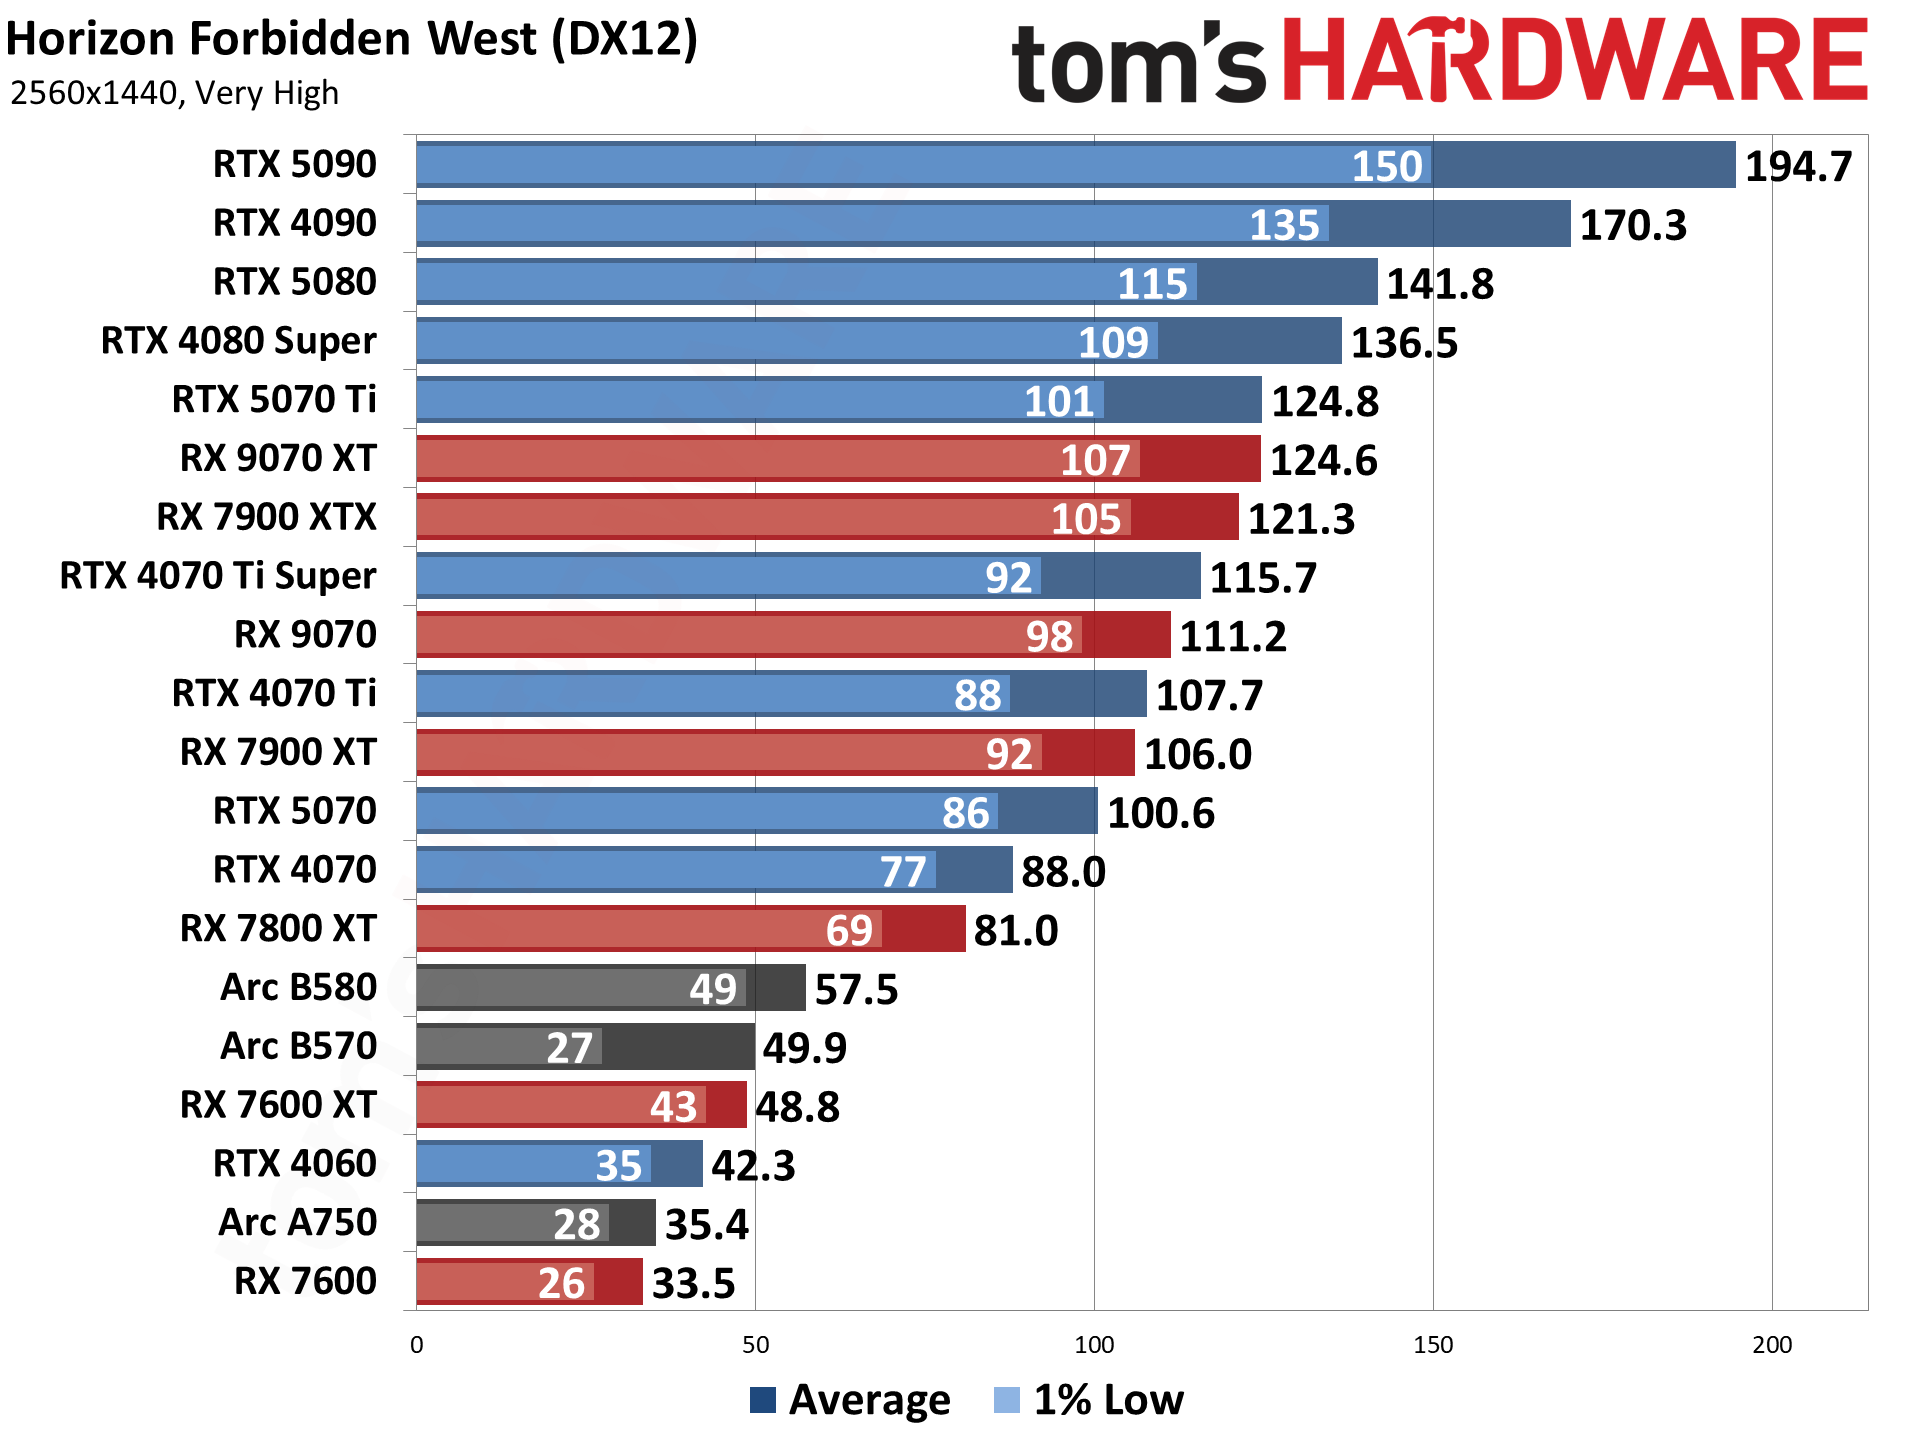
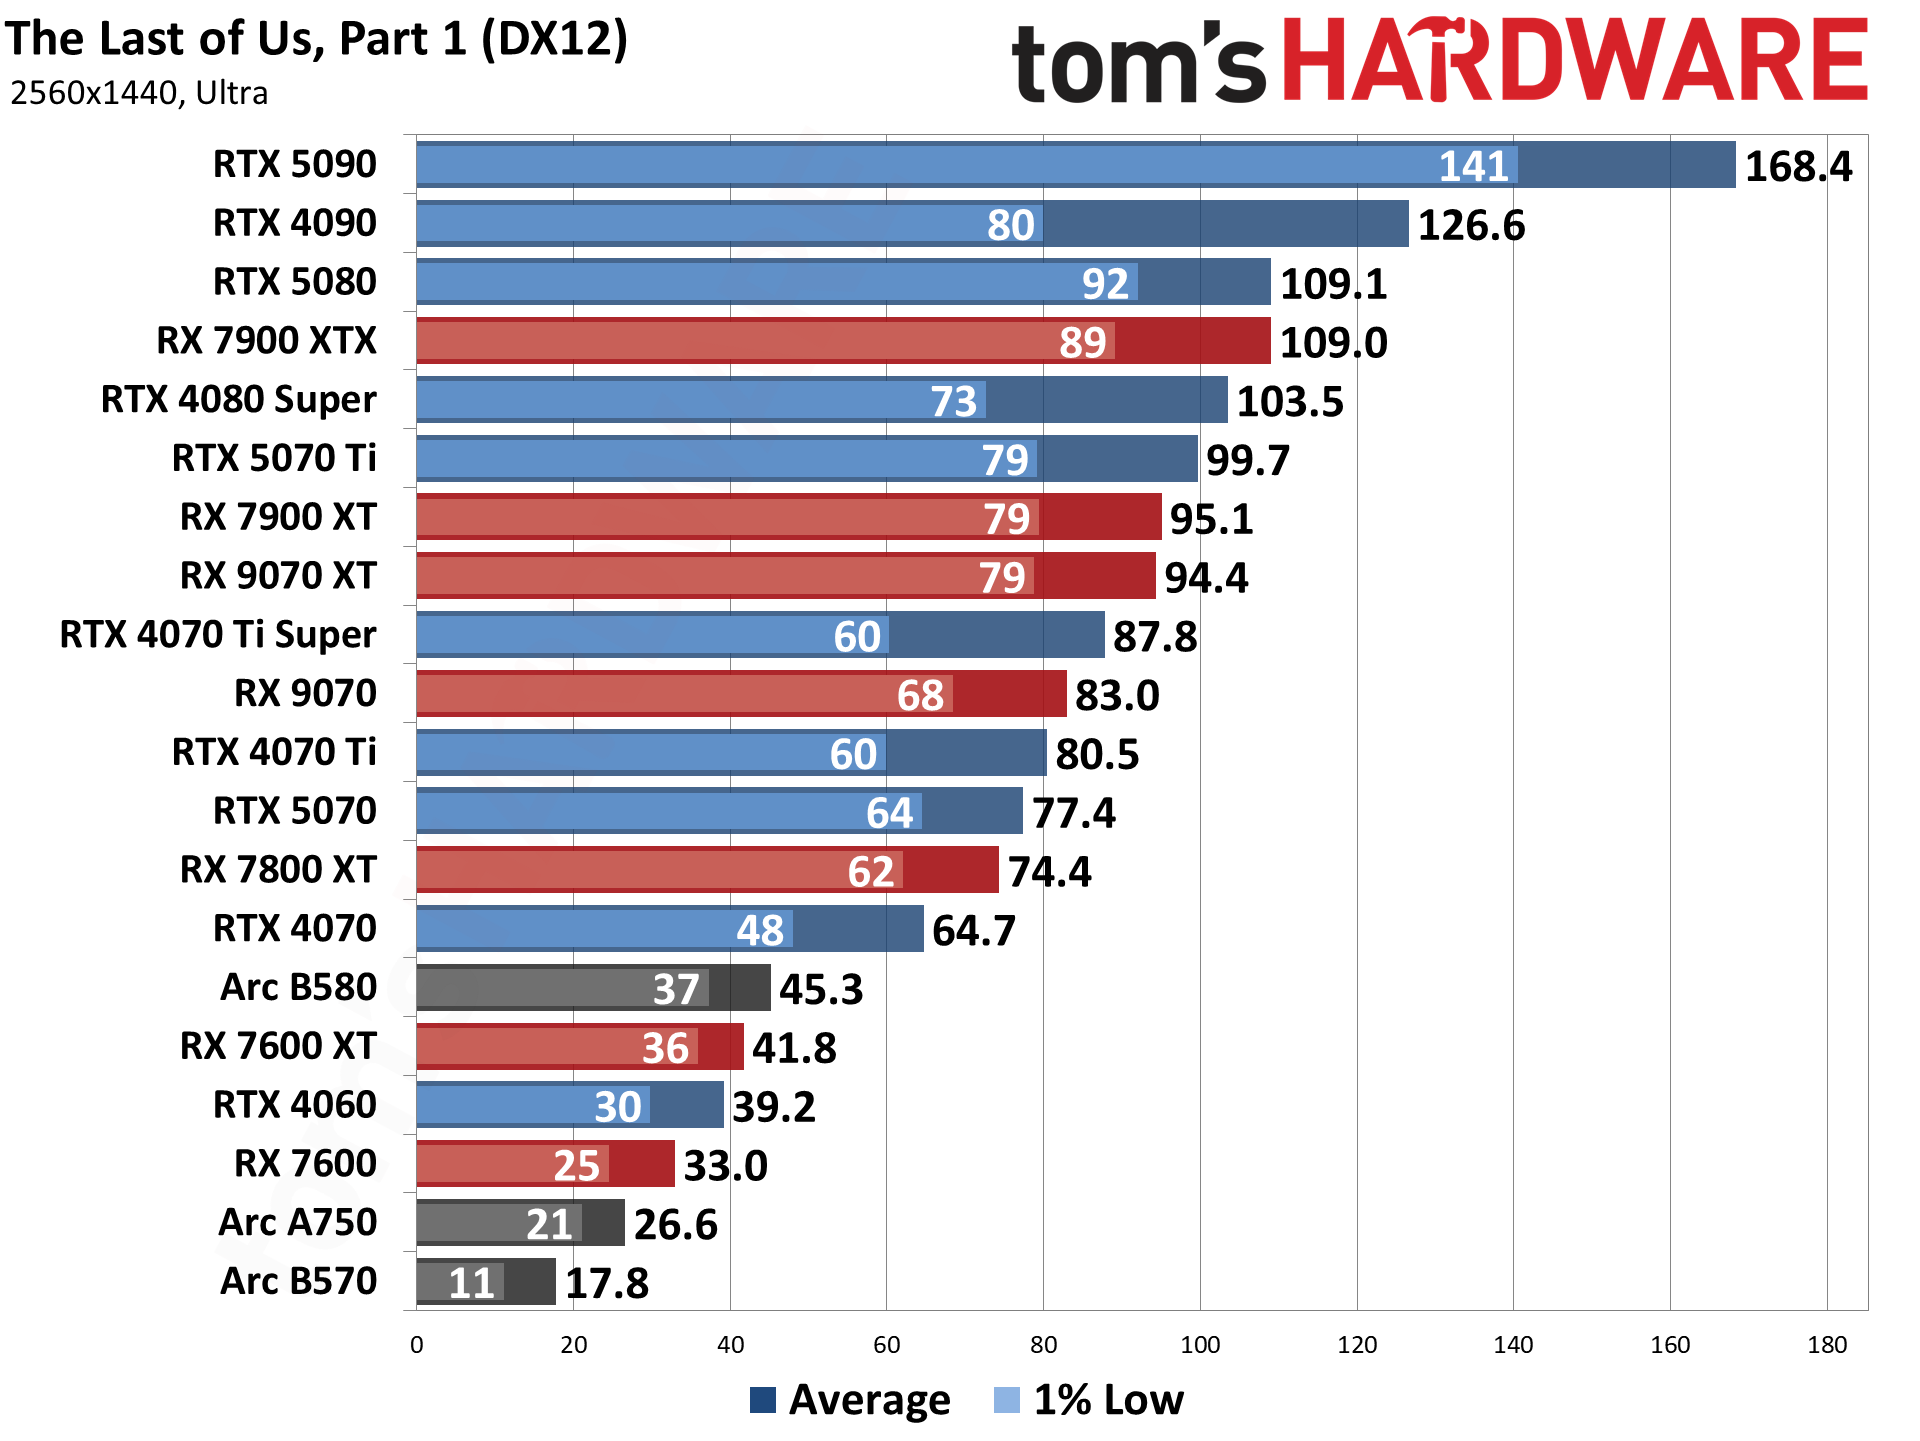
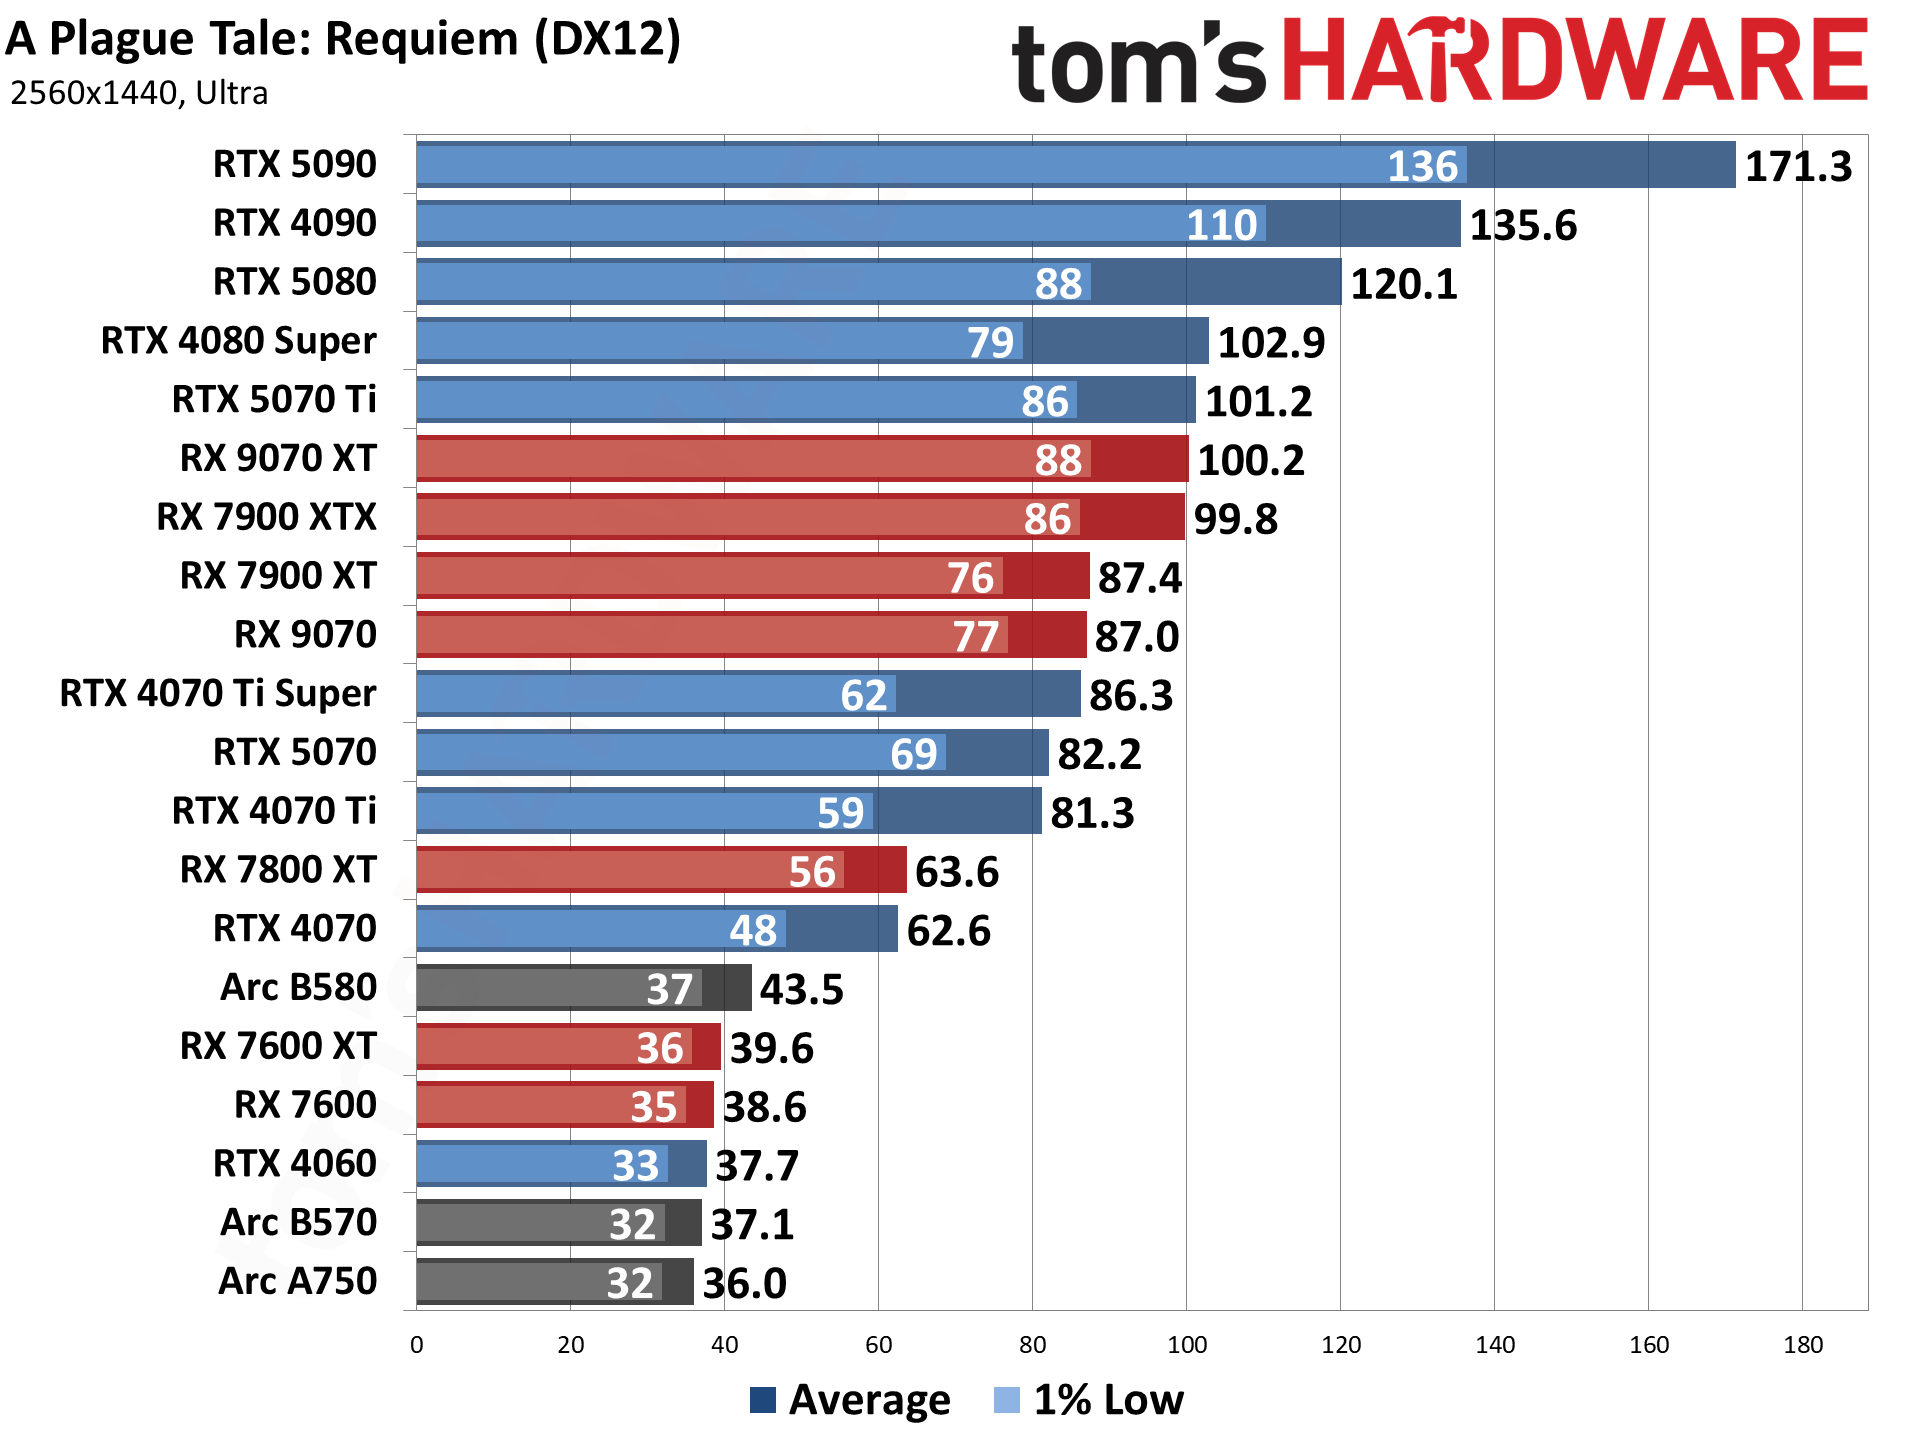
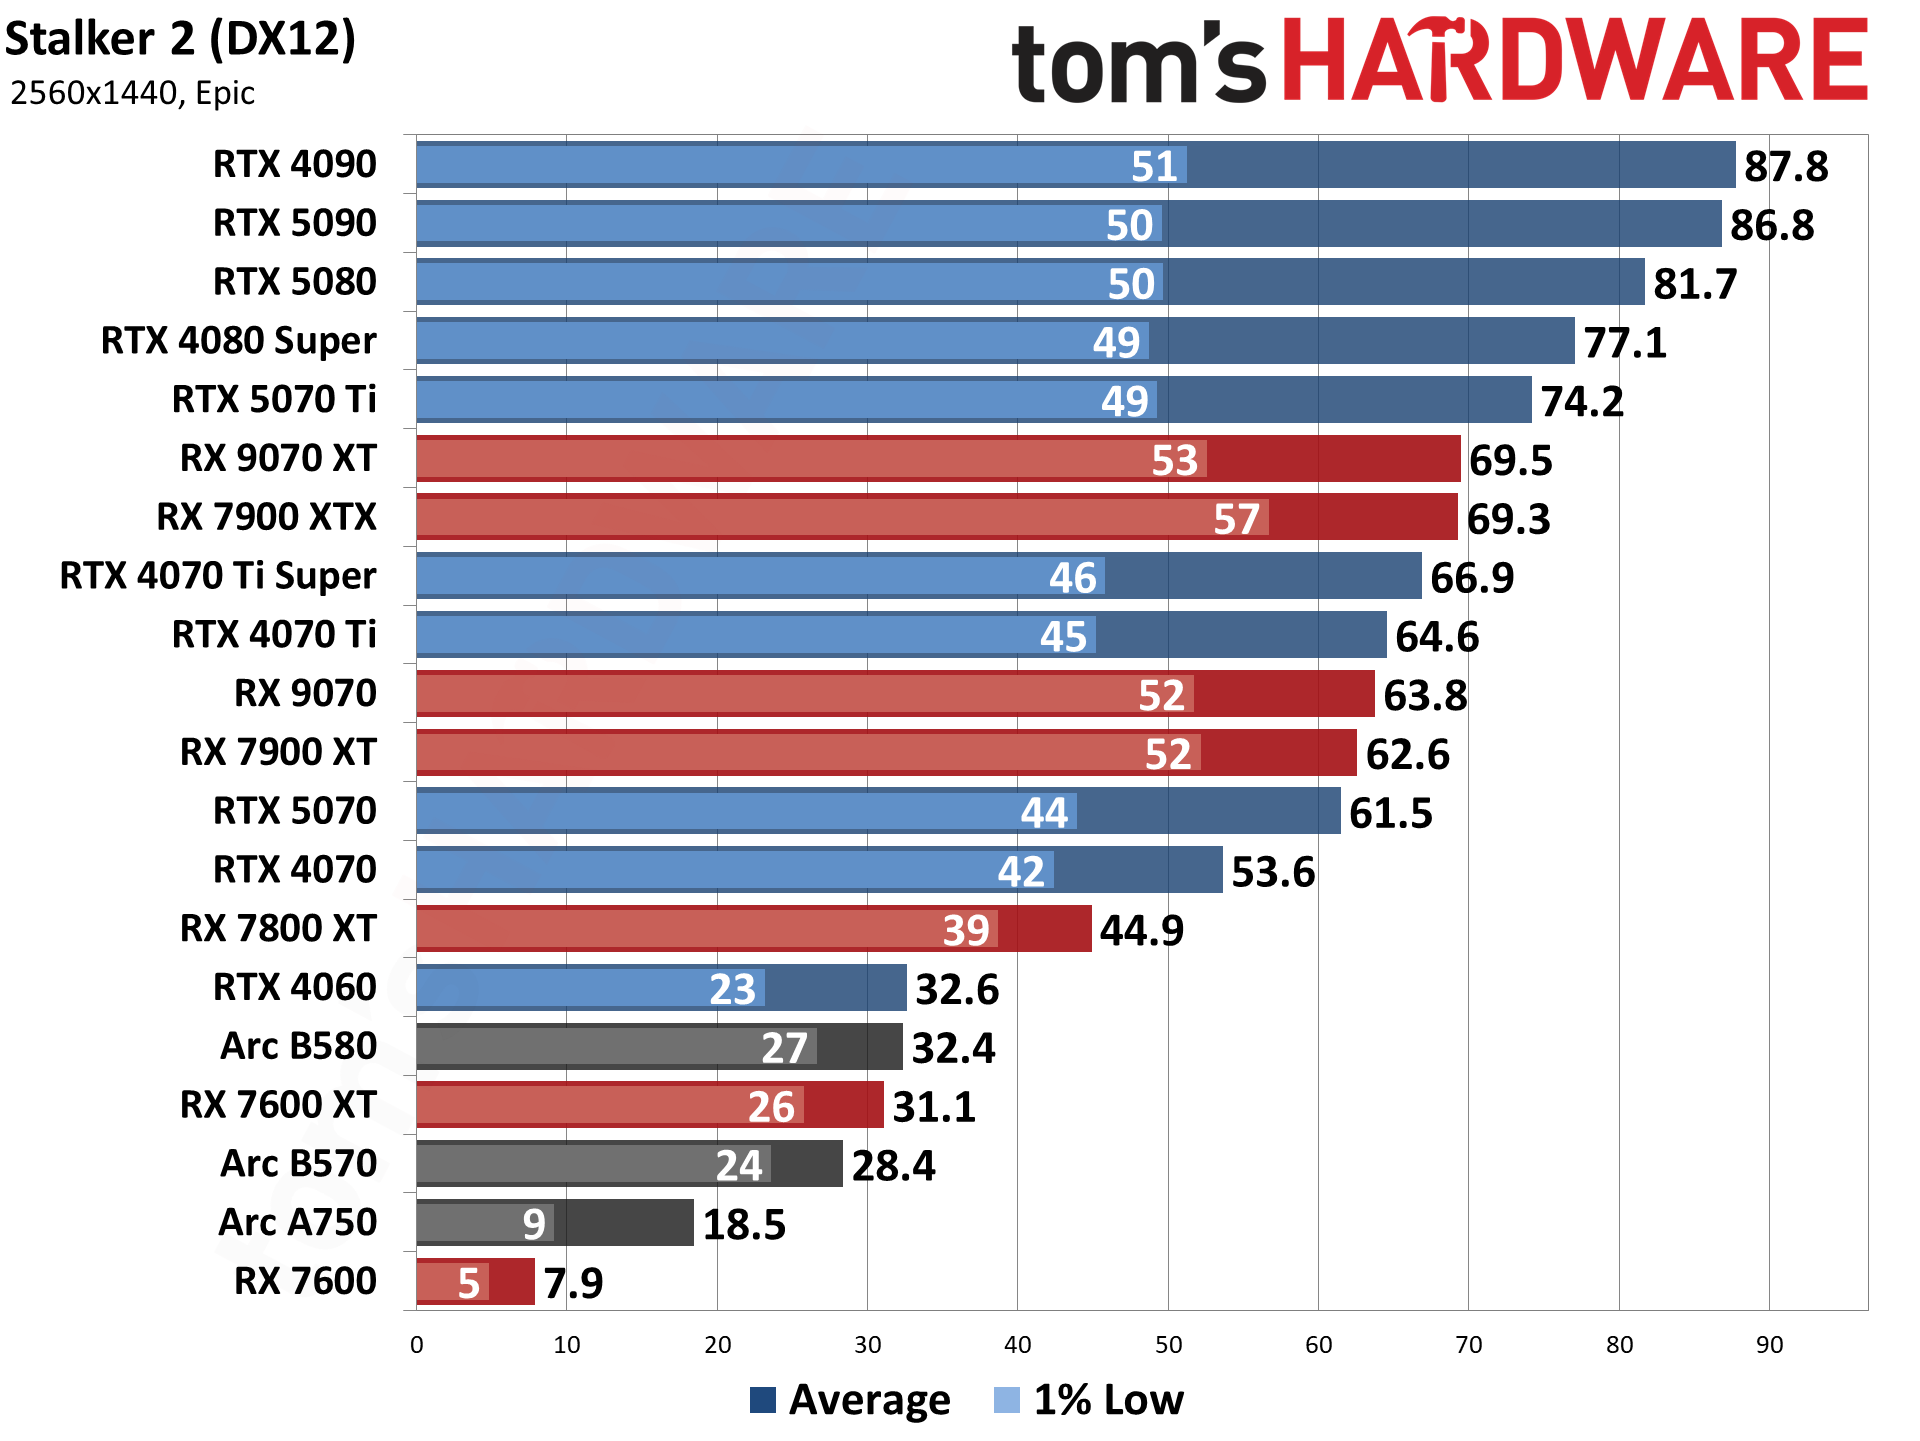
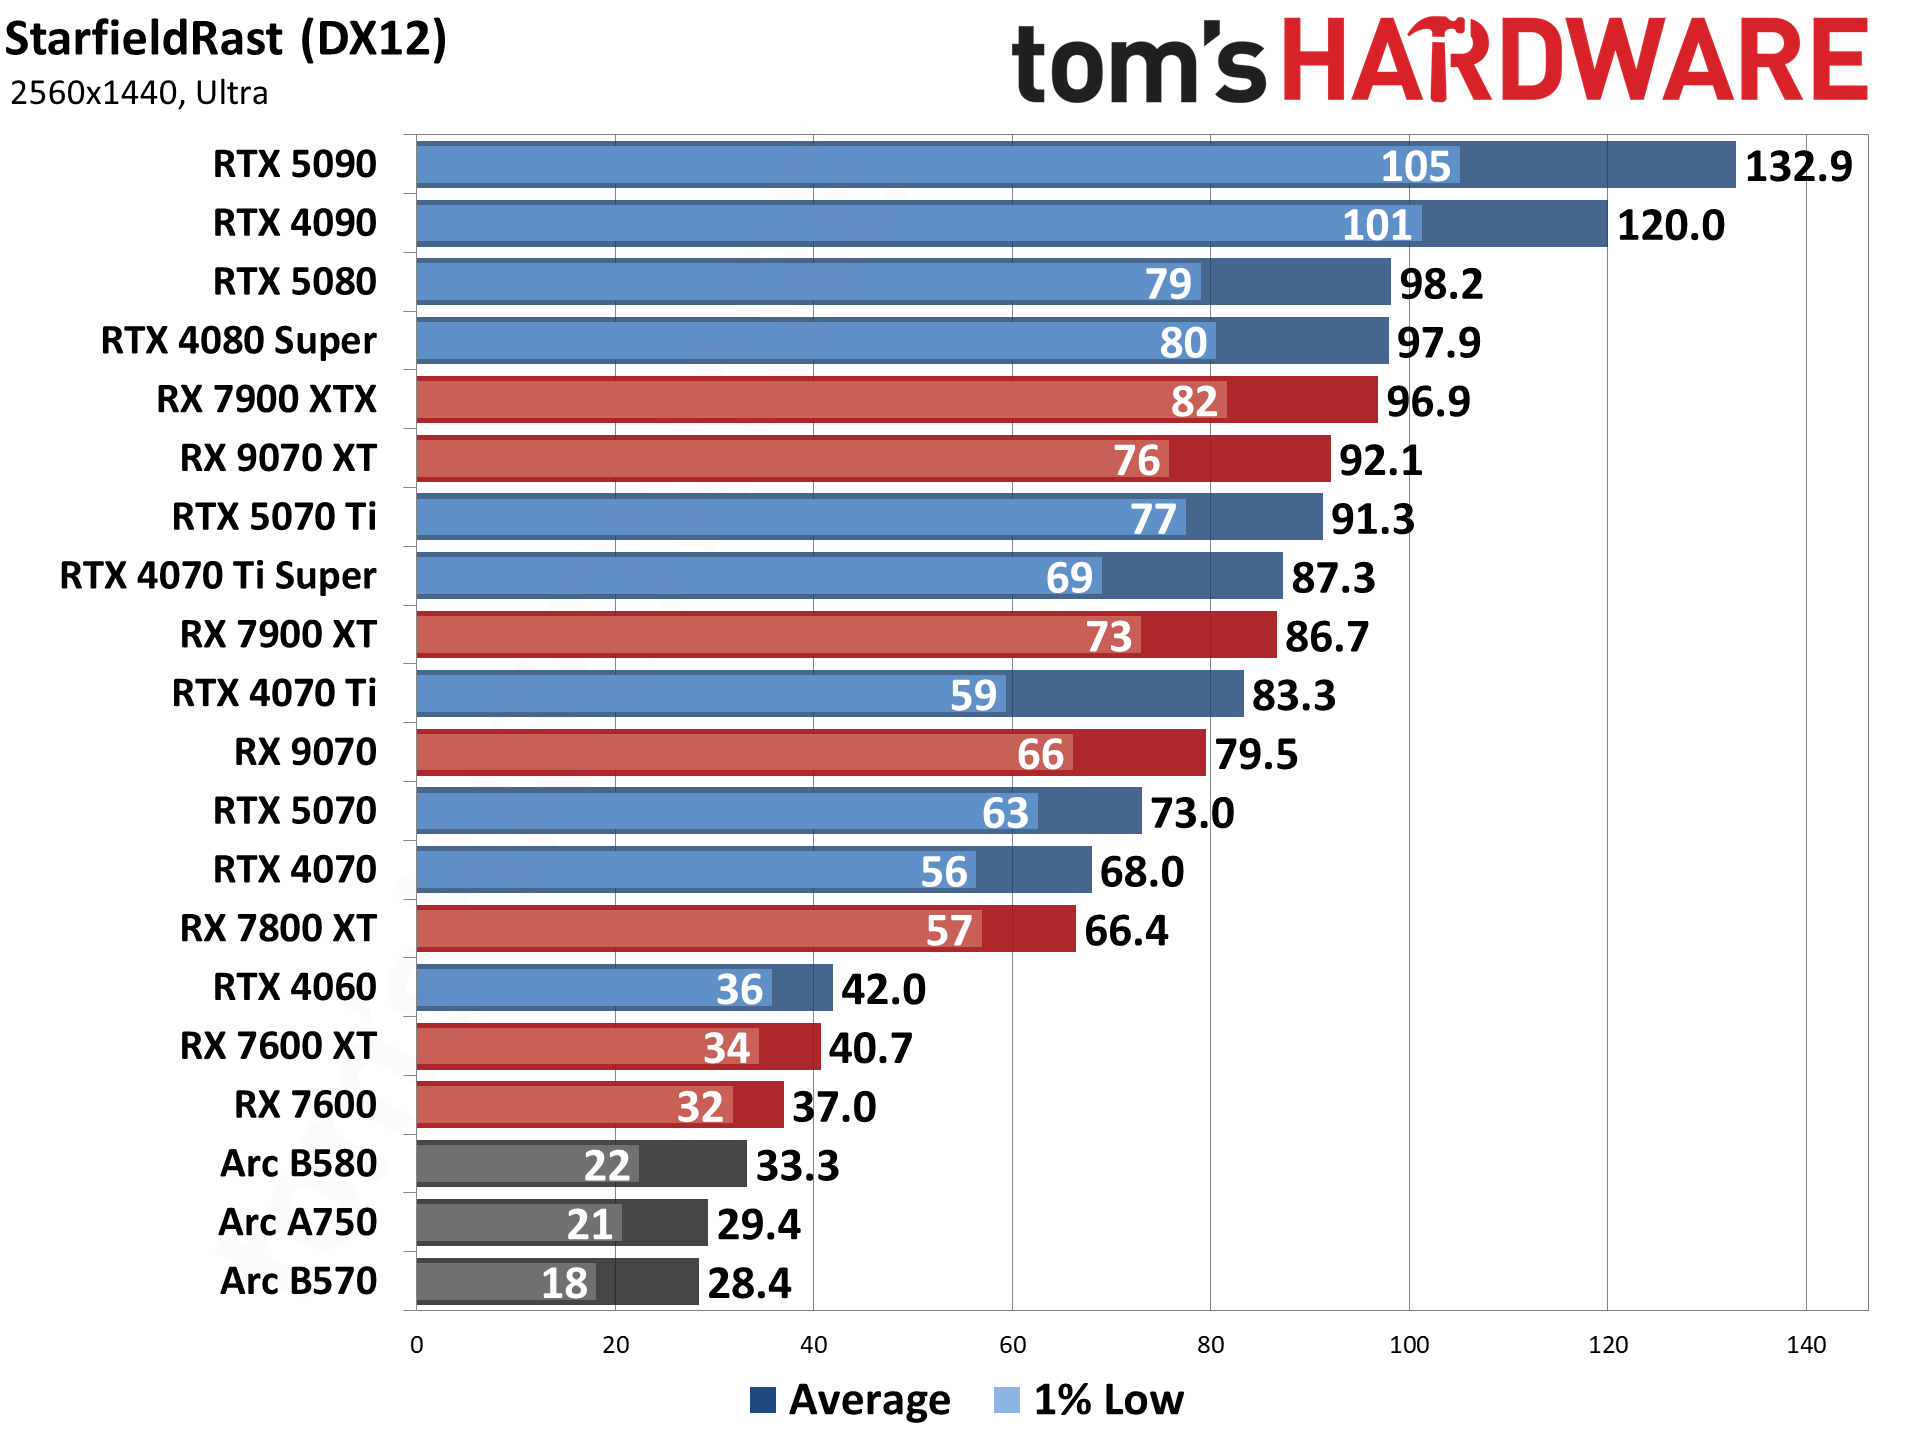
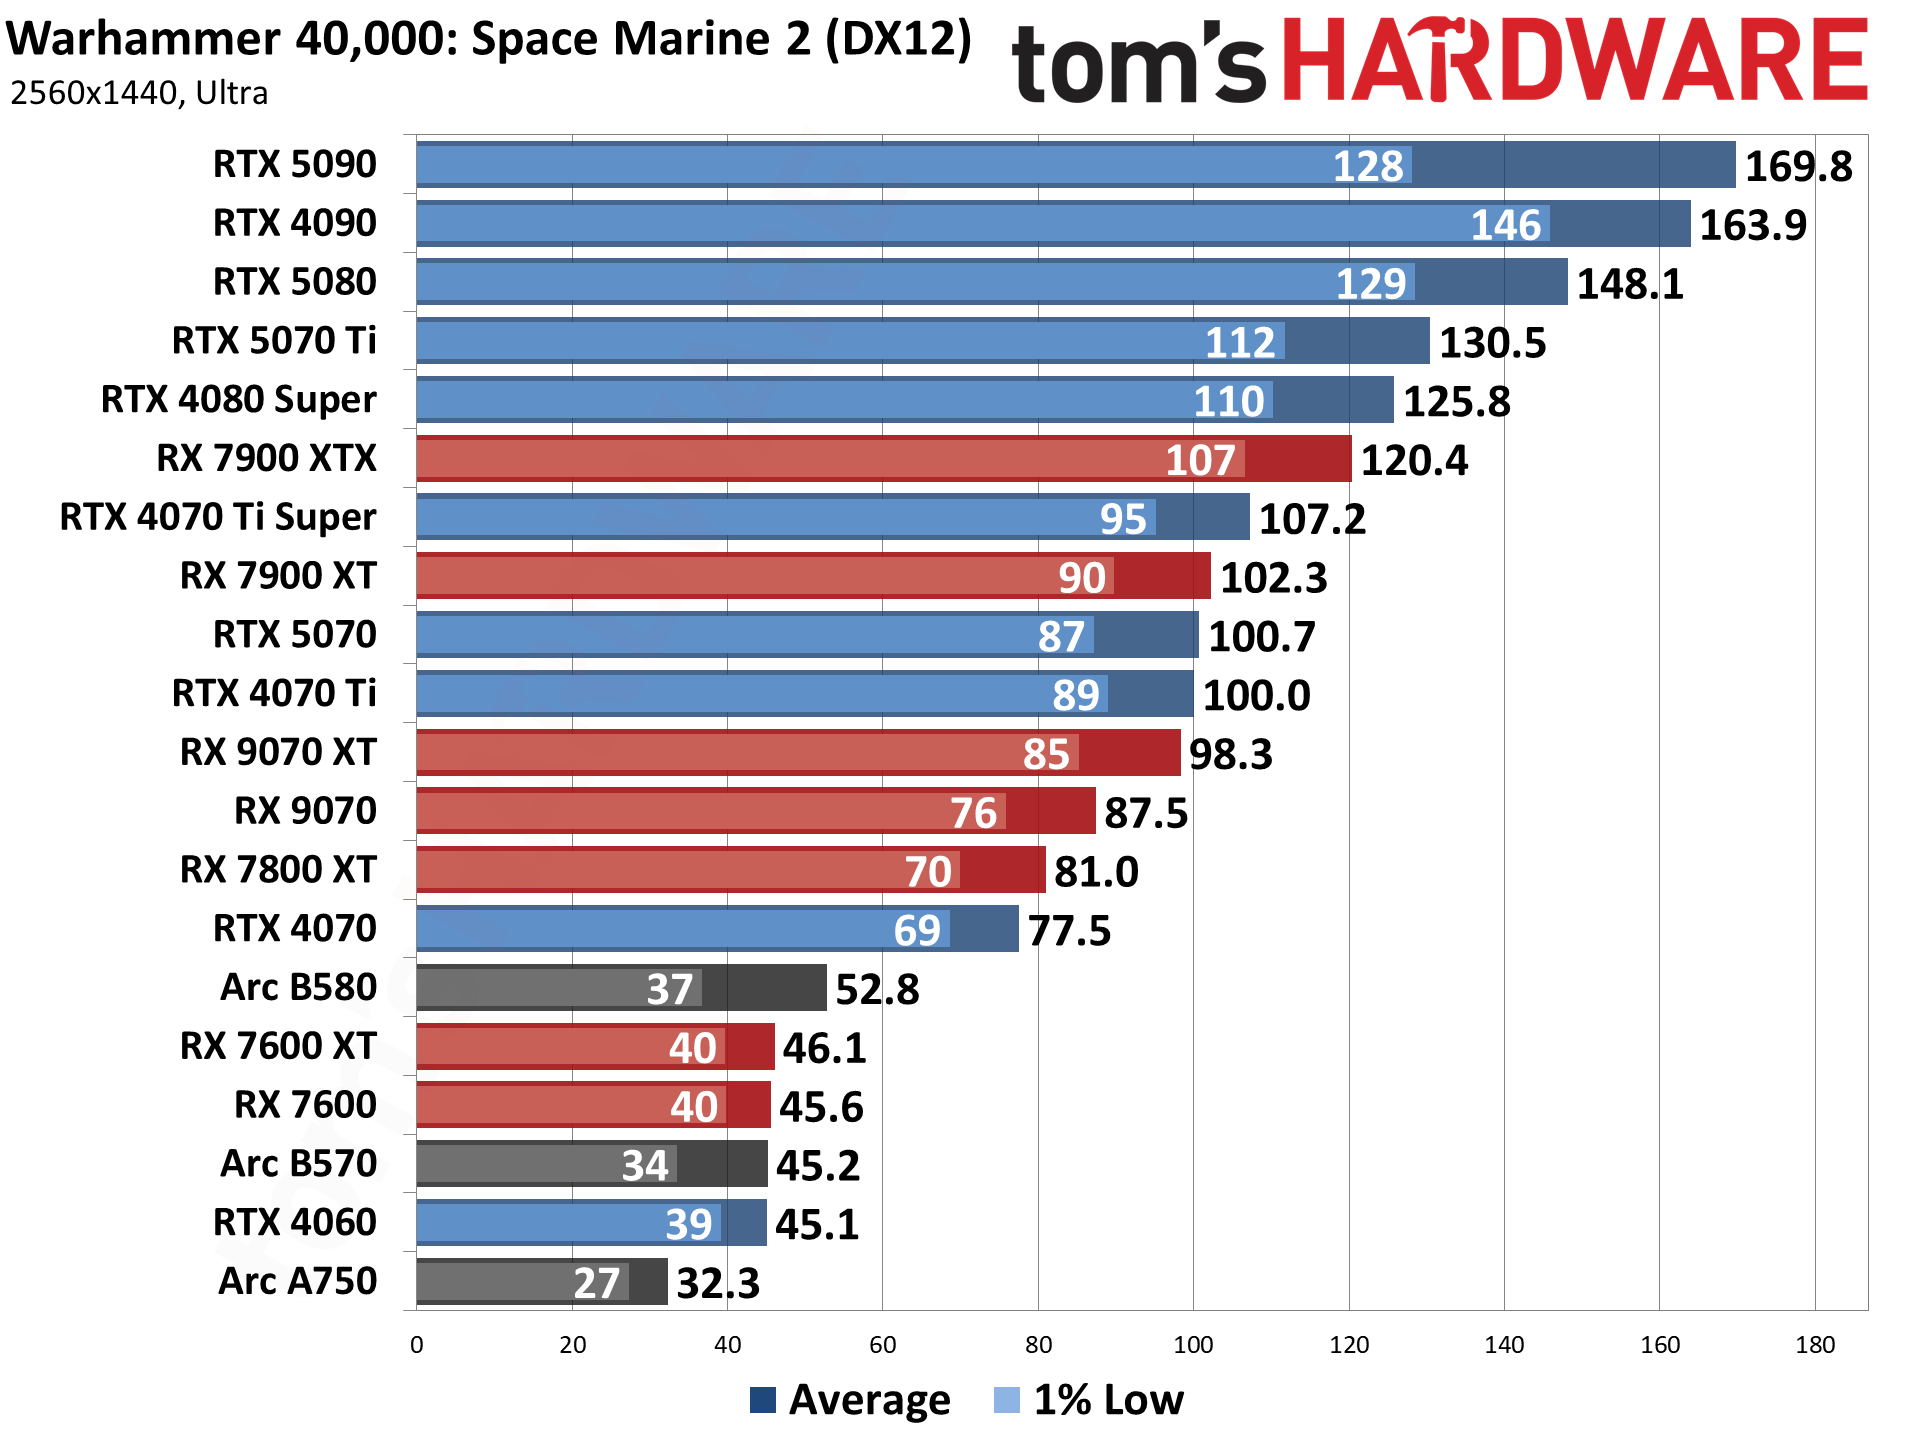
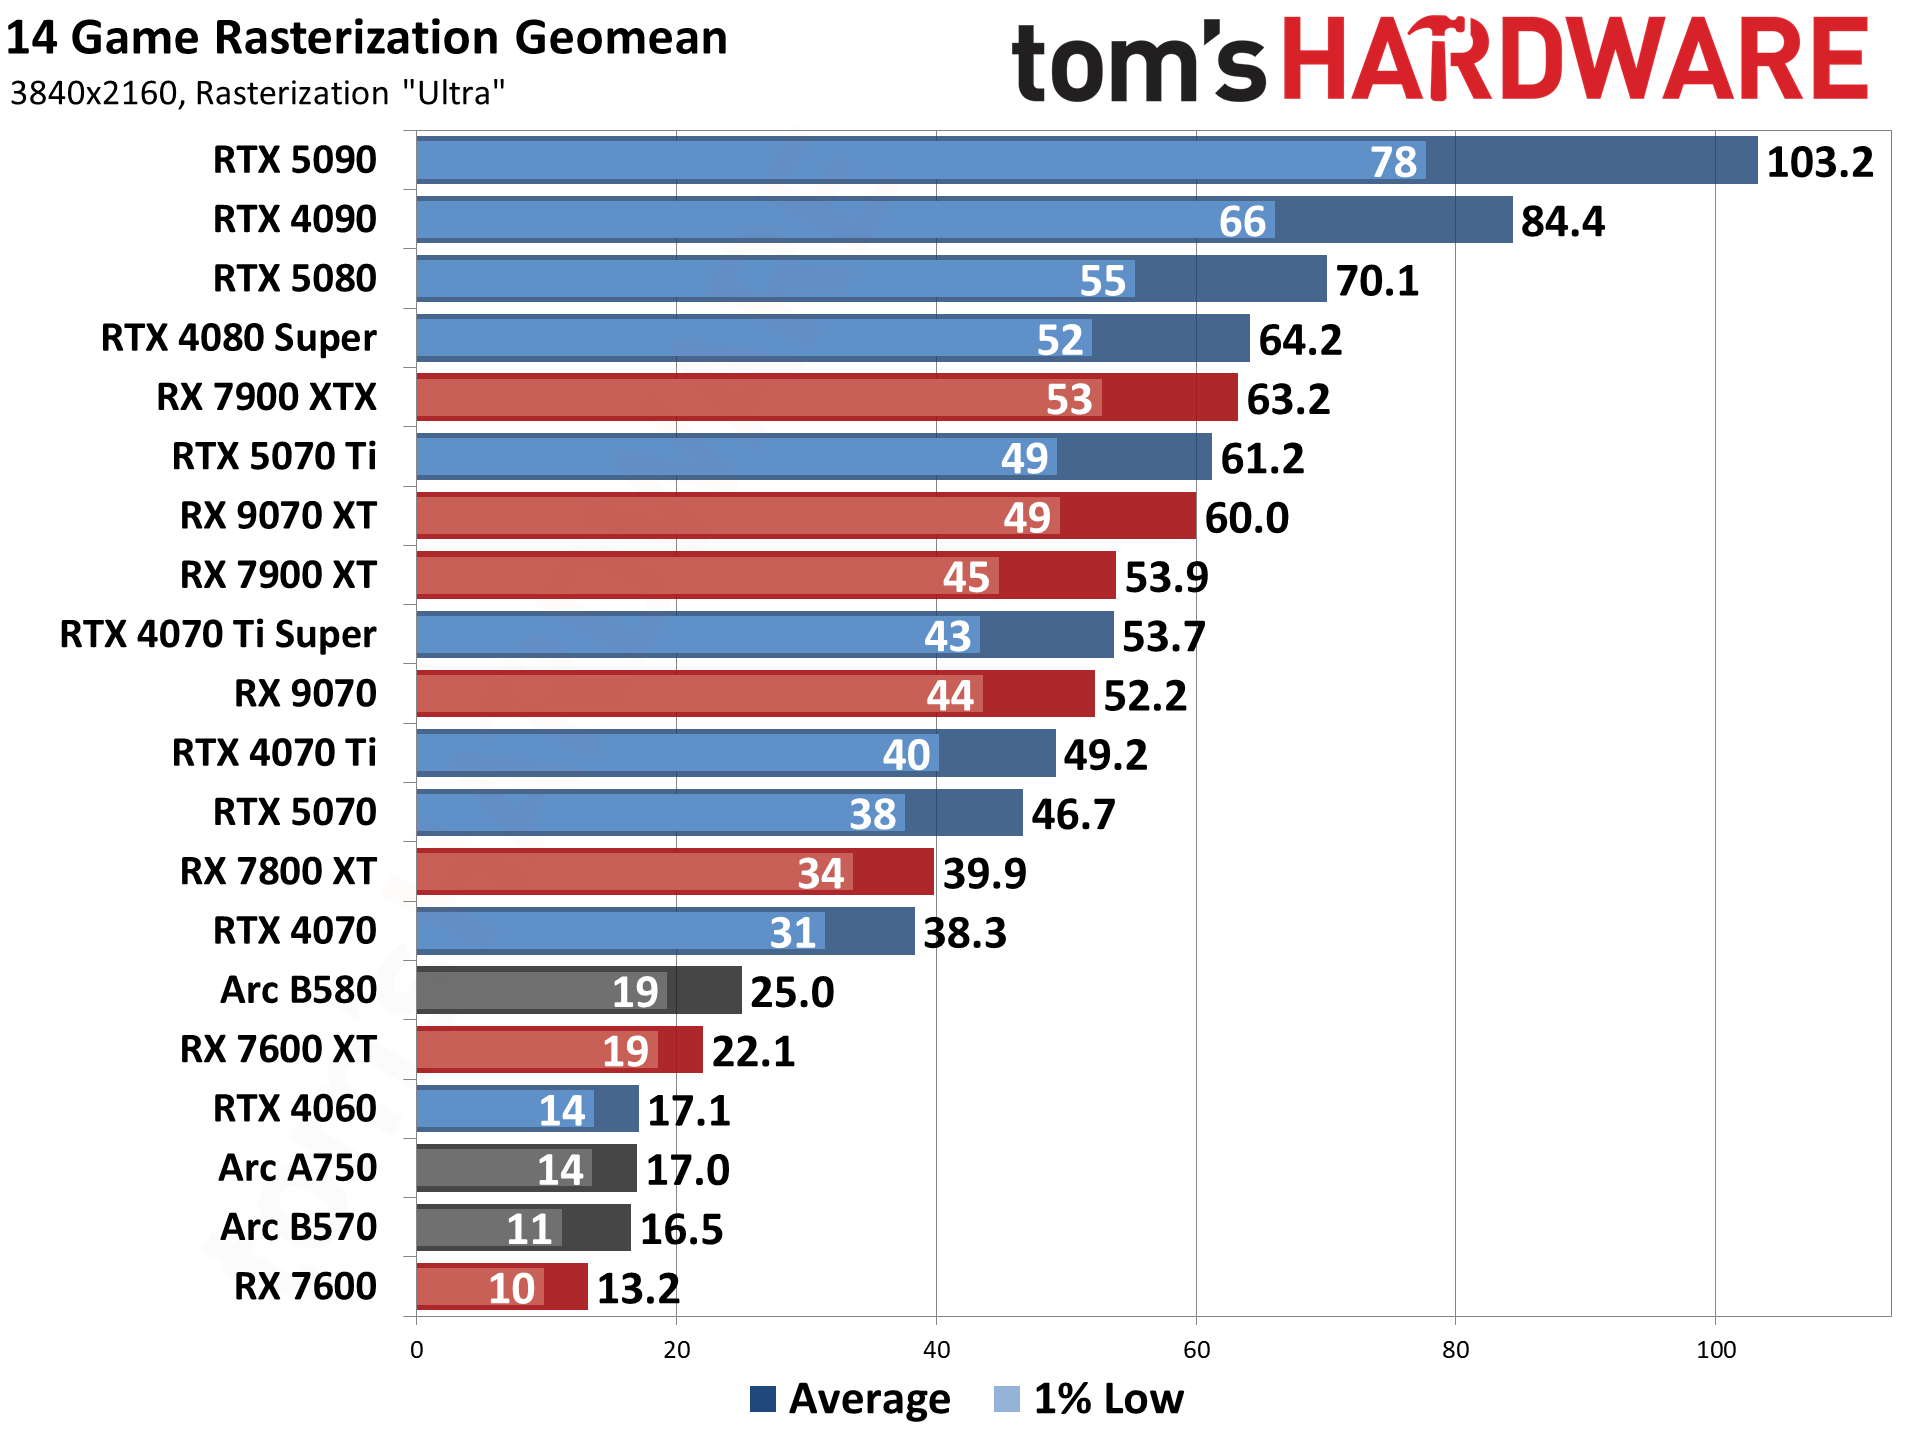
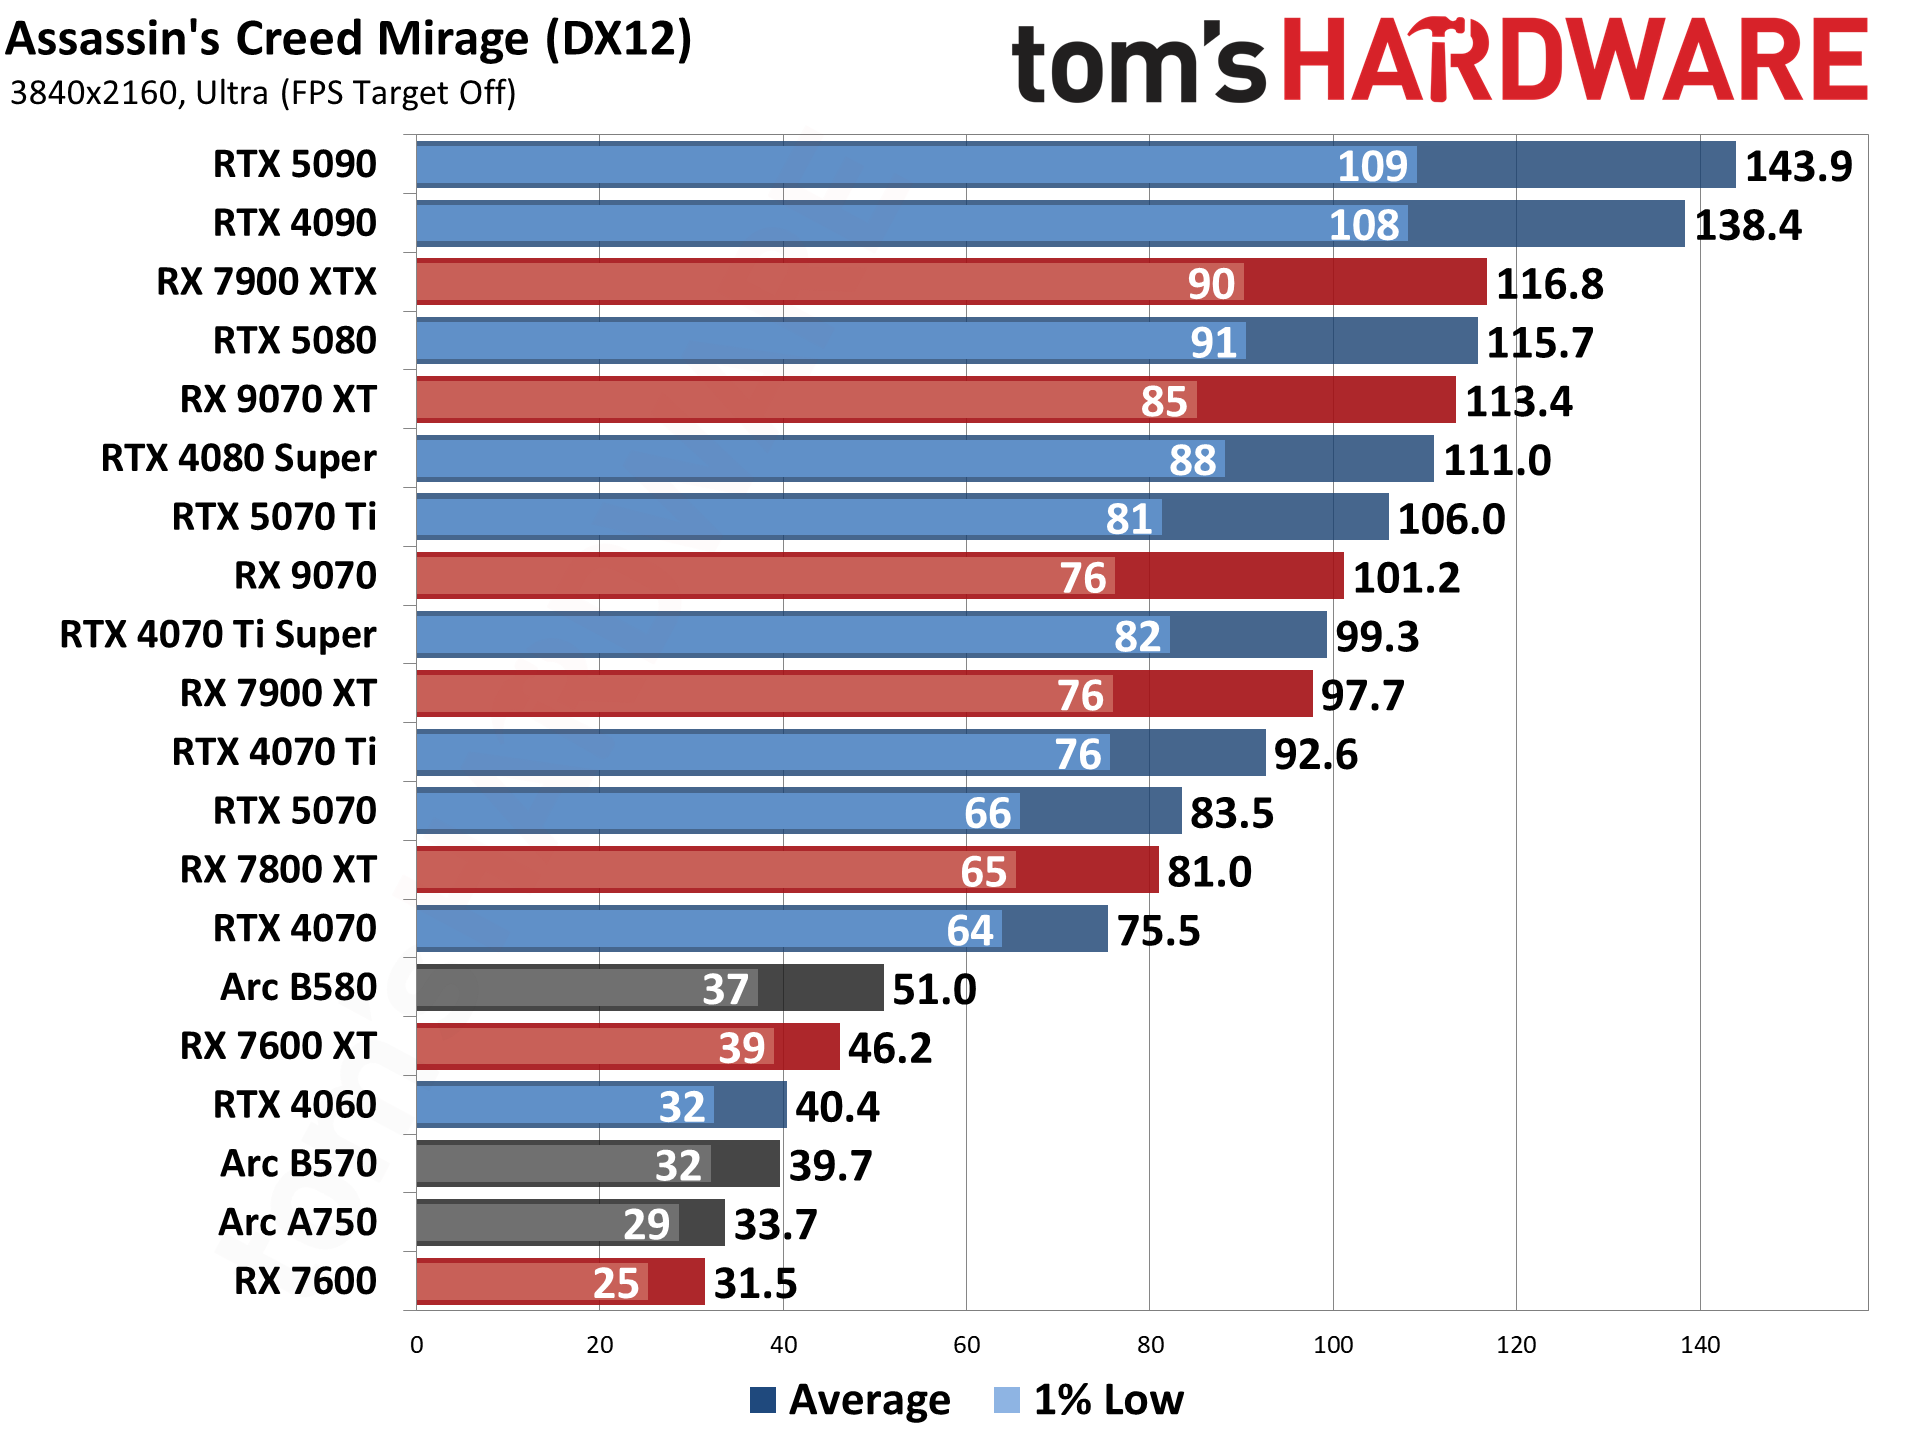
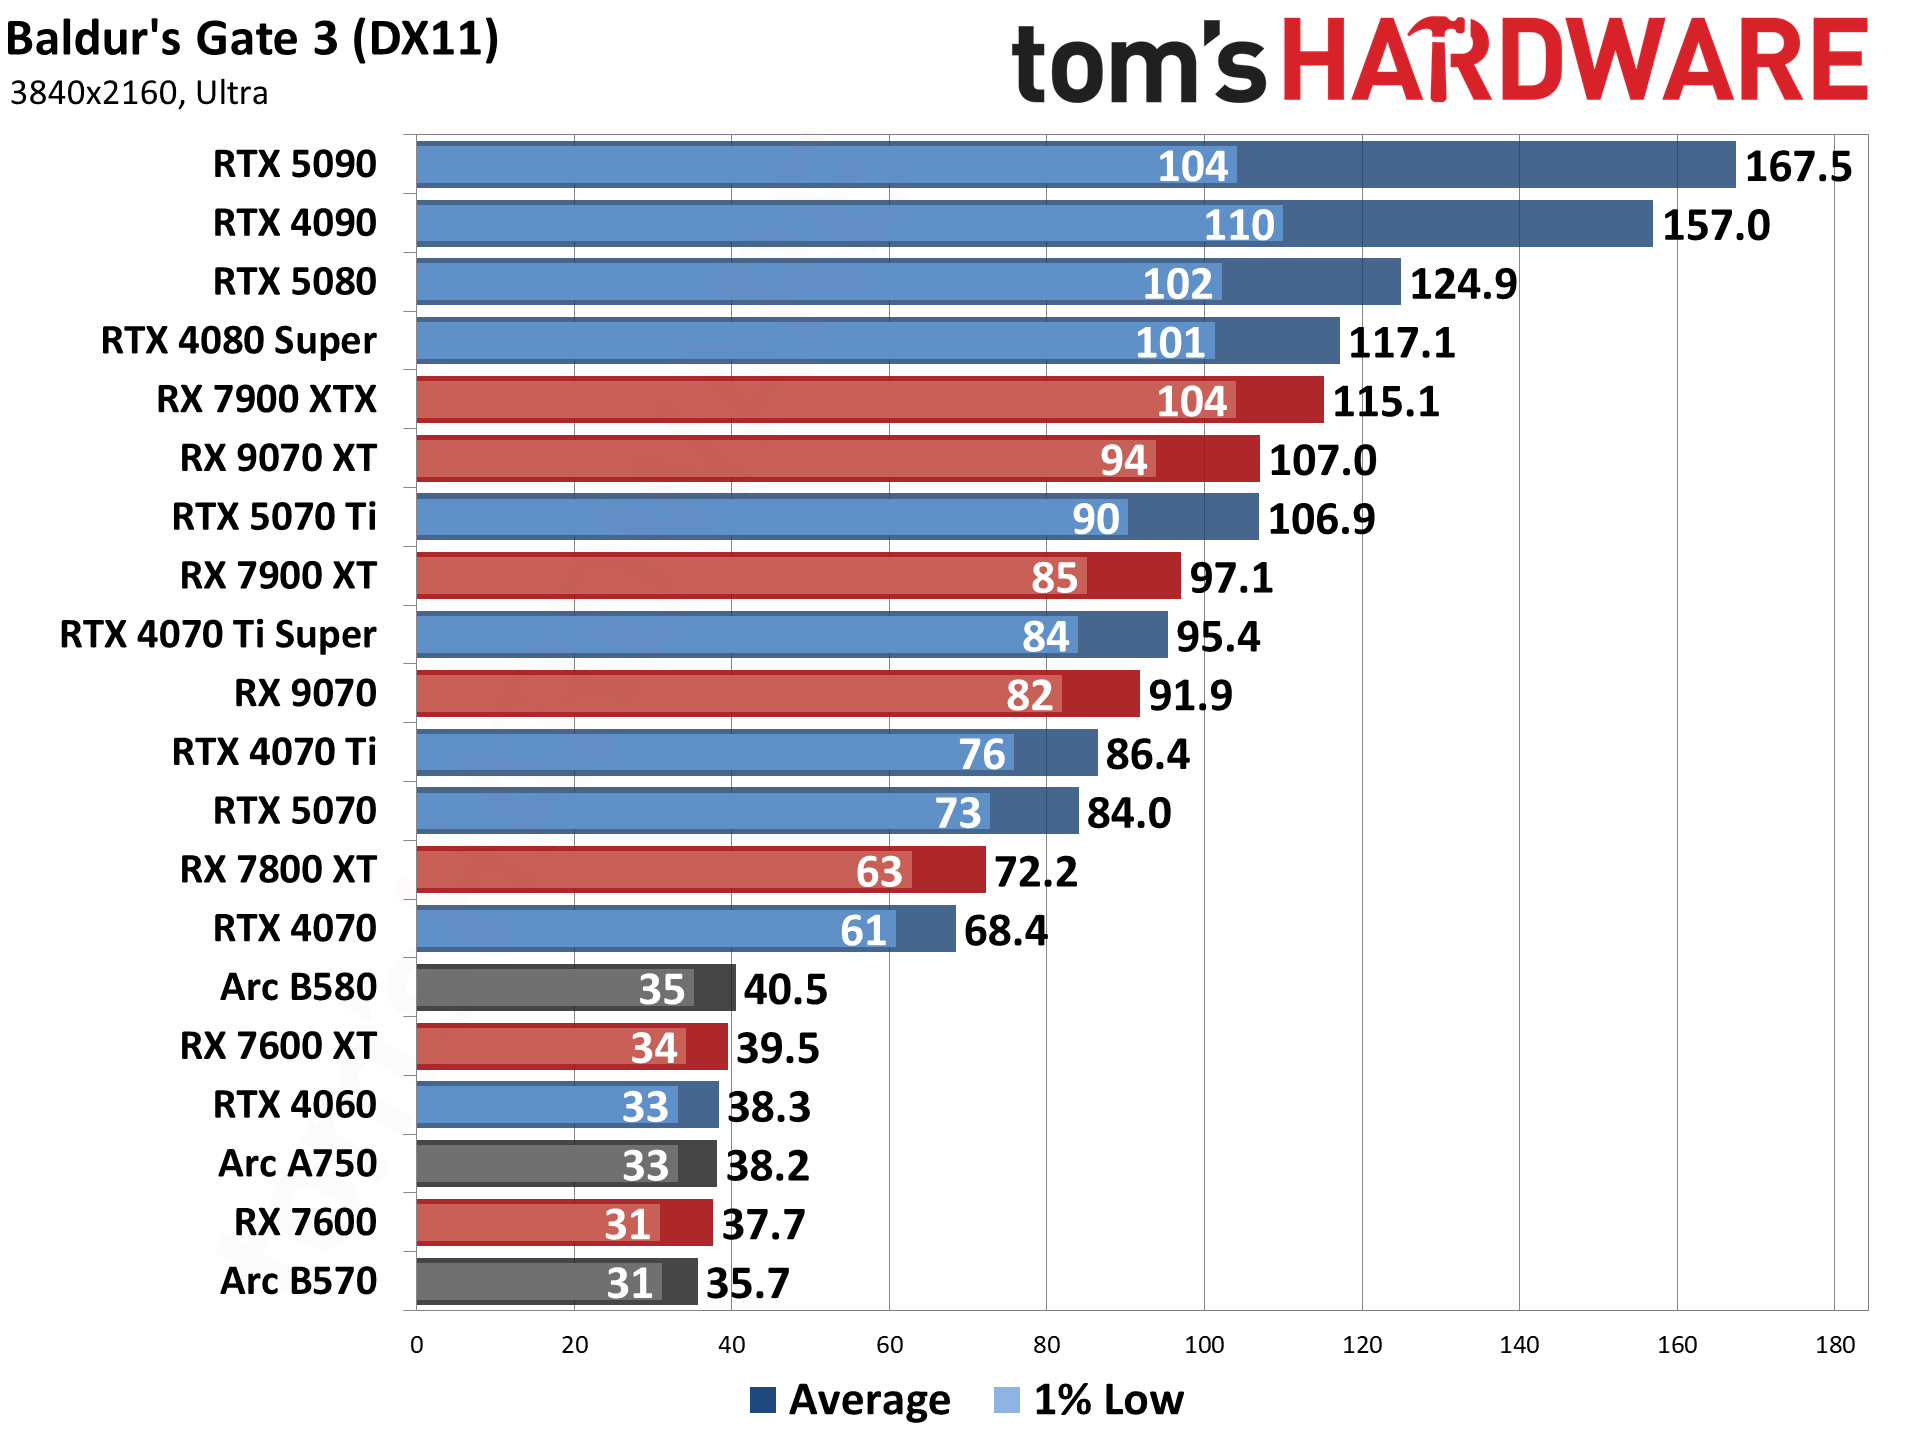
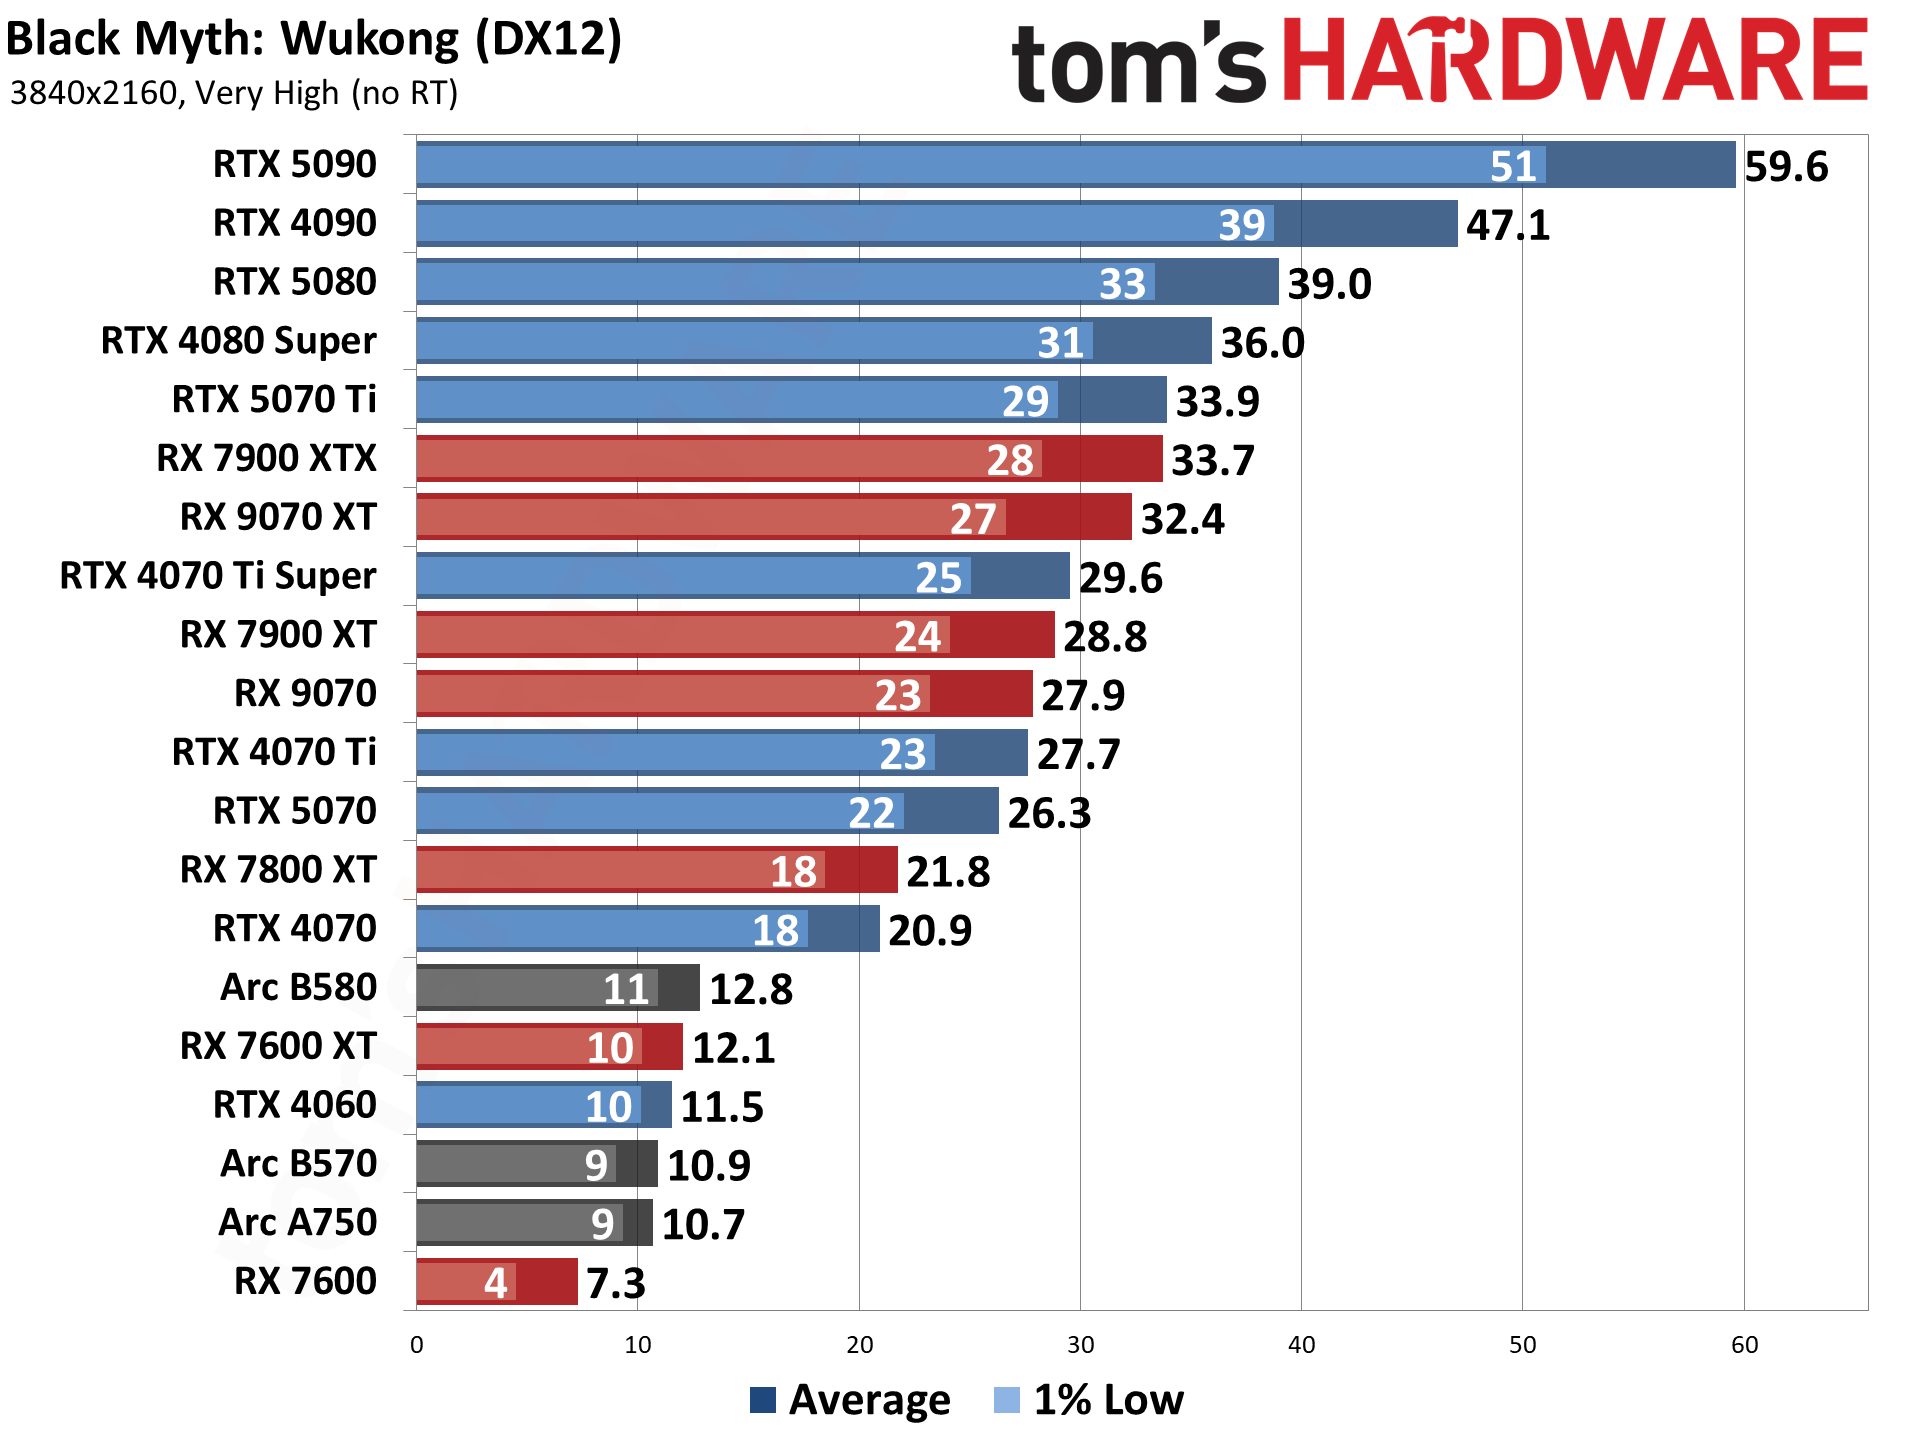
We have 14 rasterization games we’re using for the latest test suite, though we may swap some of these out in the coming days: Assassin’s Creed Mirage, Baldur’s Gate 3, Black Myth Wukong, Dragon Age: The Veilguard, Final Fantasy XVI, Flight Simulator 2020, Flight Simulator 2024, God of War Ragnarök, Horizon Forbidden West, The Last of Us Part 1, A Plague Tale: Requiem, Spider-Man 2, Stalker 2, Starfield, and Warhammer 40,000: Space Marine 2.
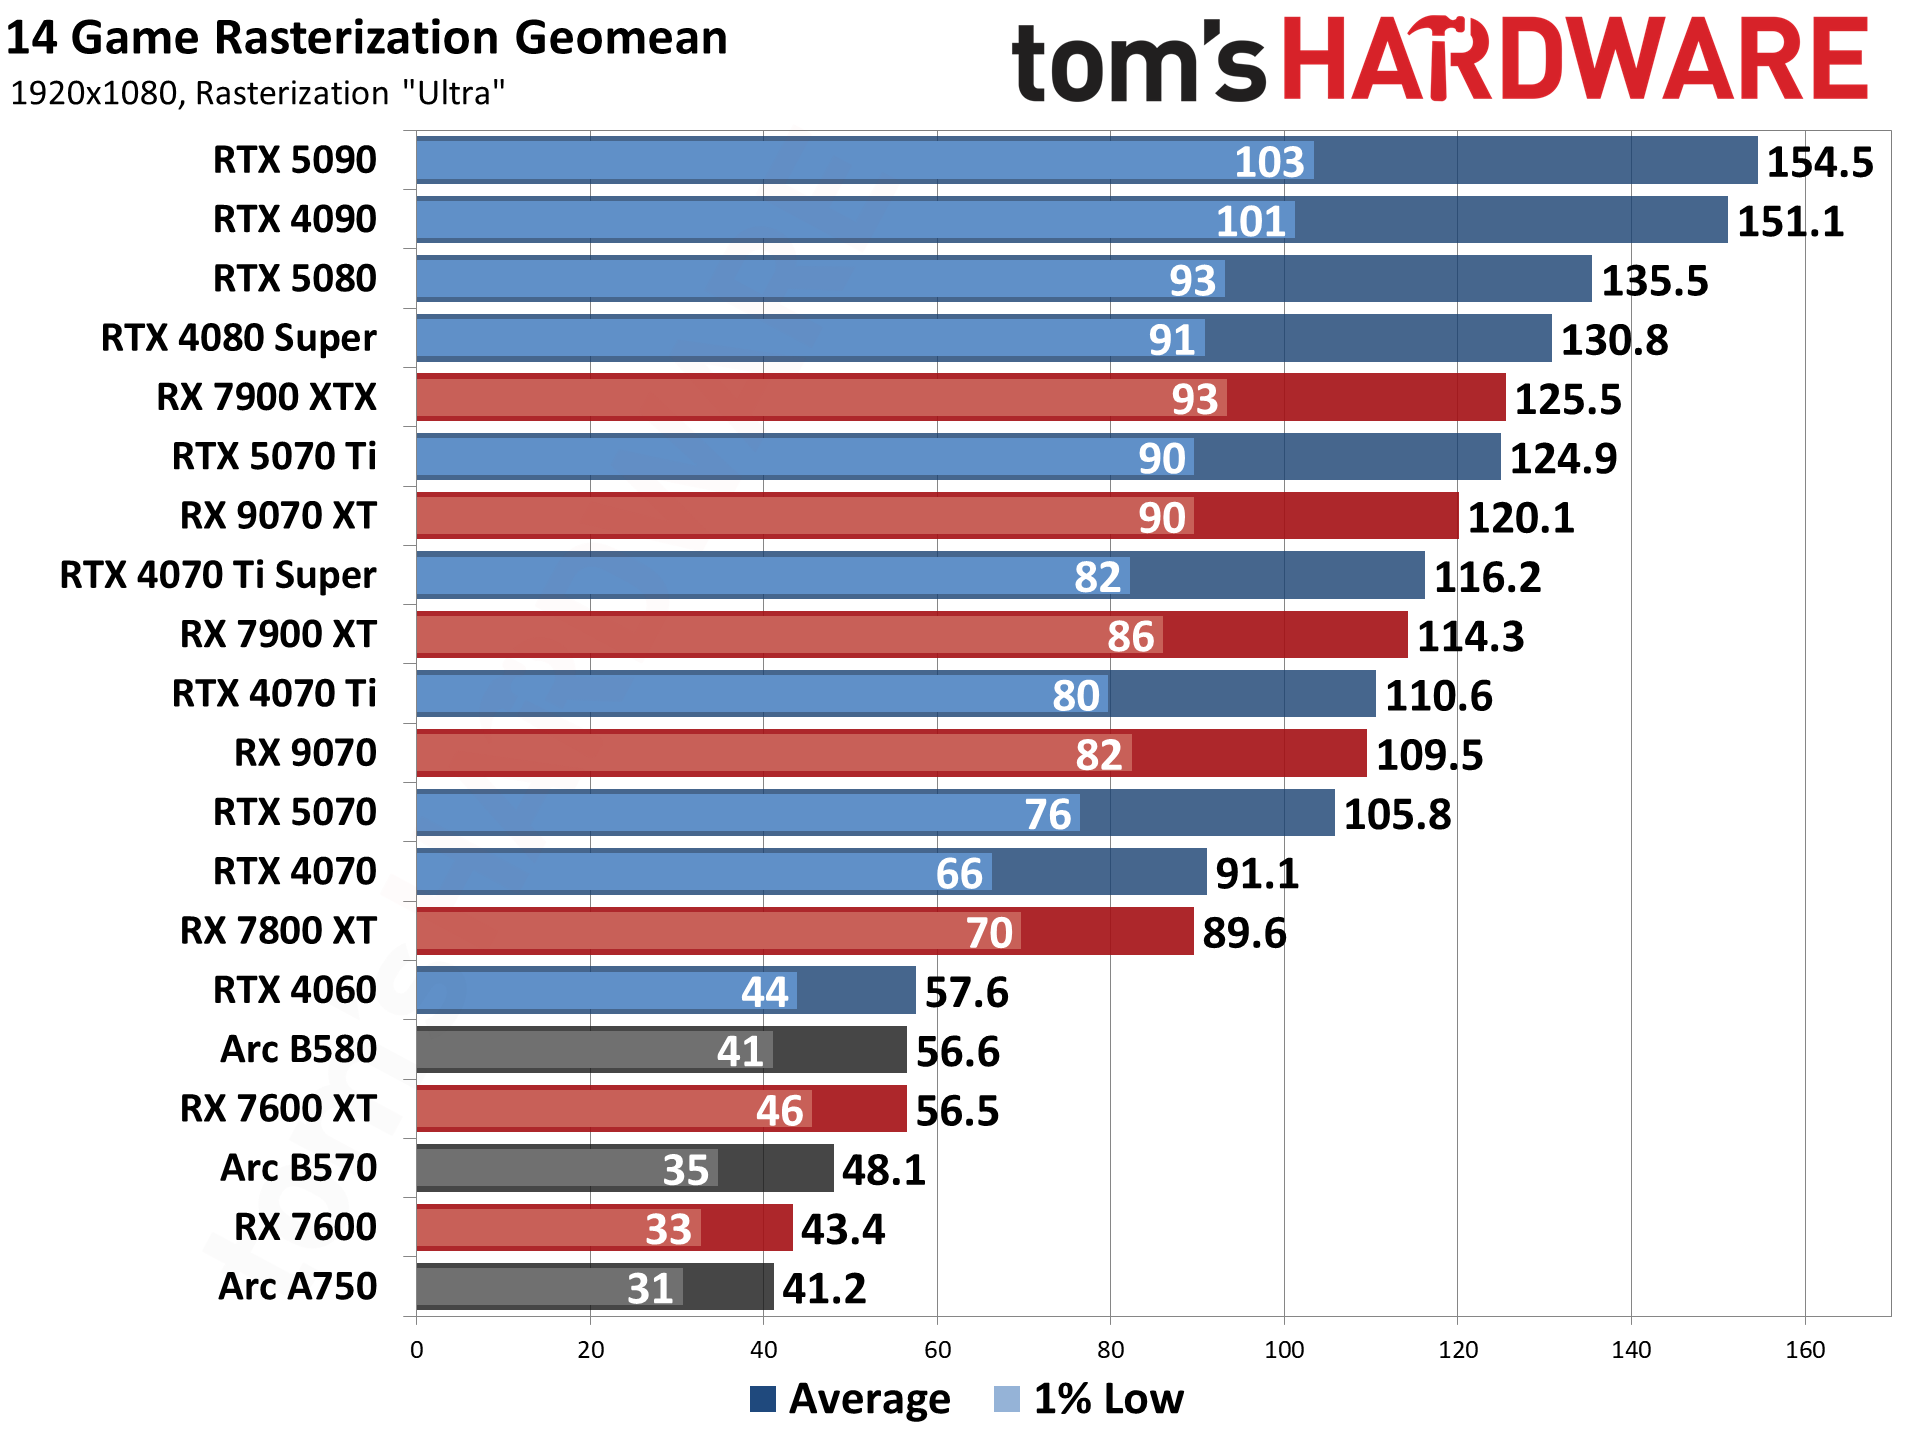
The FPS score is the geometric mean (equal weighting) of all 14 games. Note that the specifications column links directly to our original review for the various GPUs.
GPU Rasterization Hierarchy, Key Findings
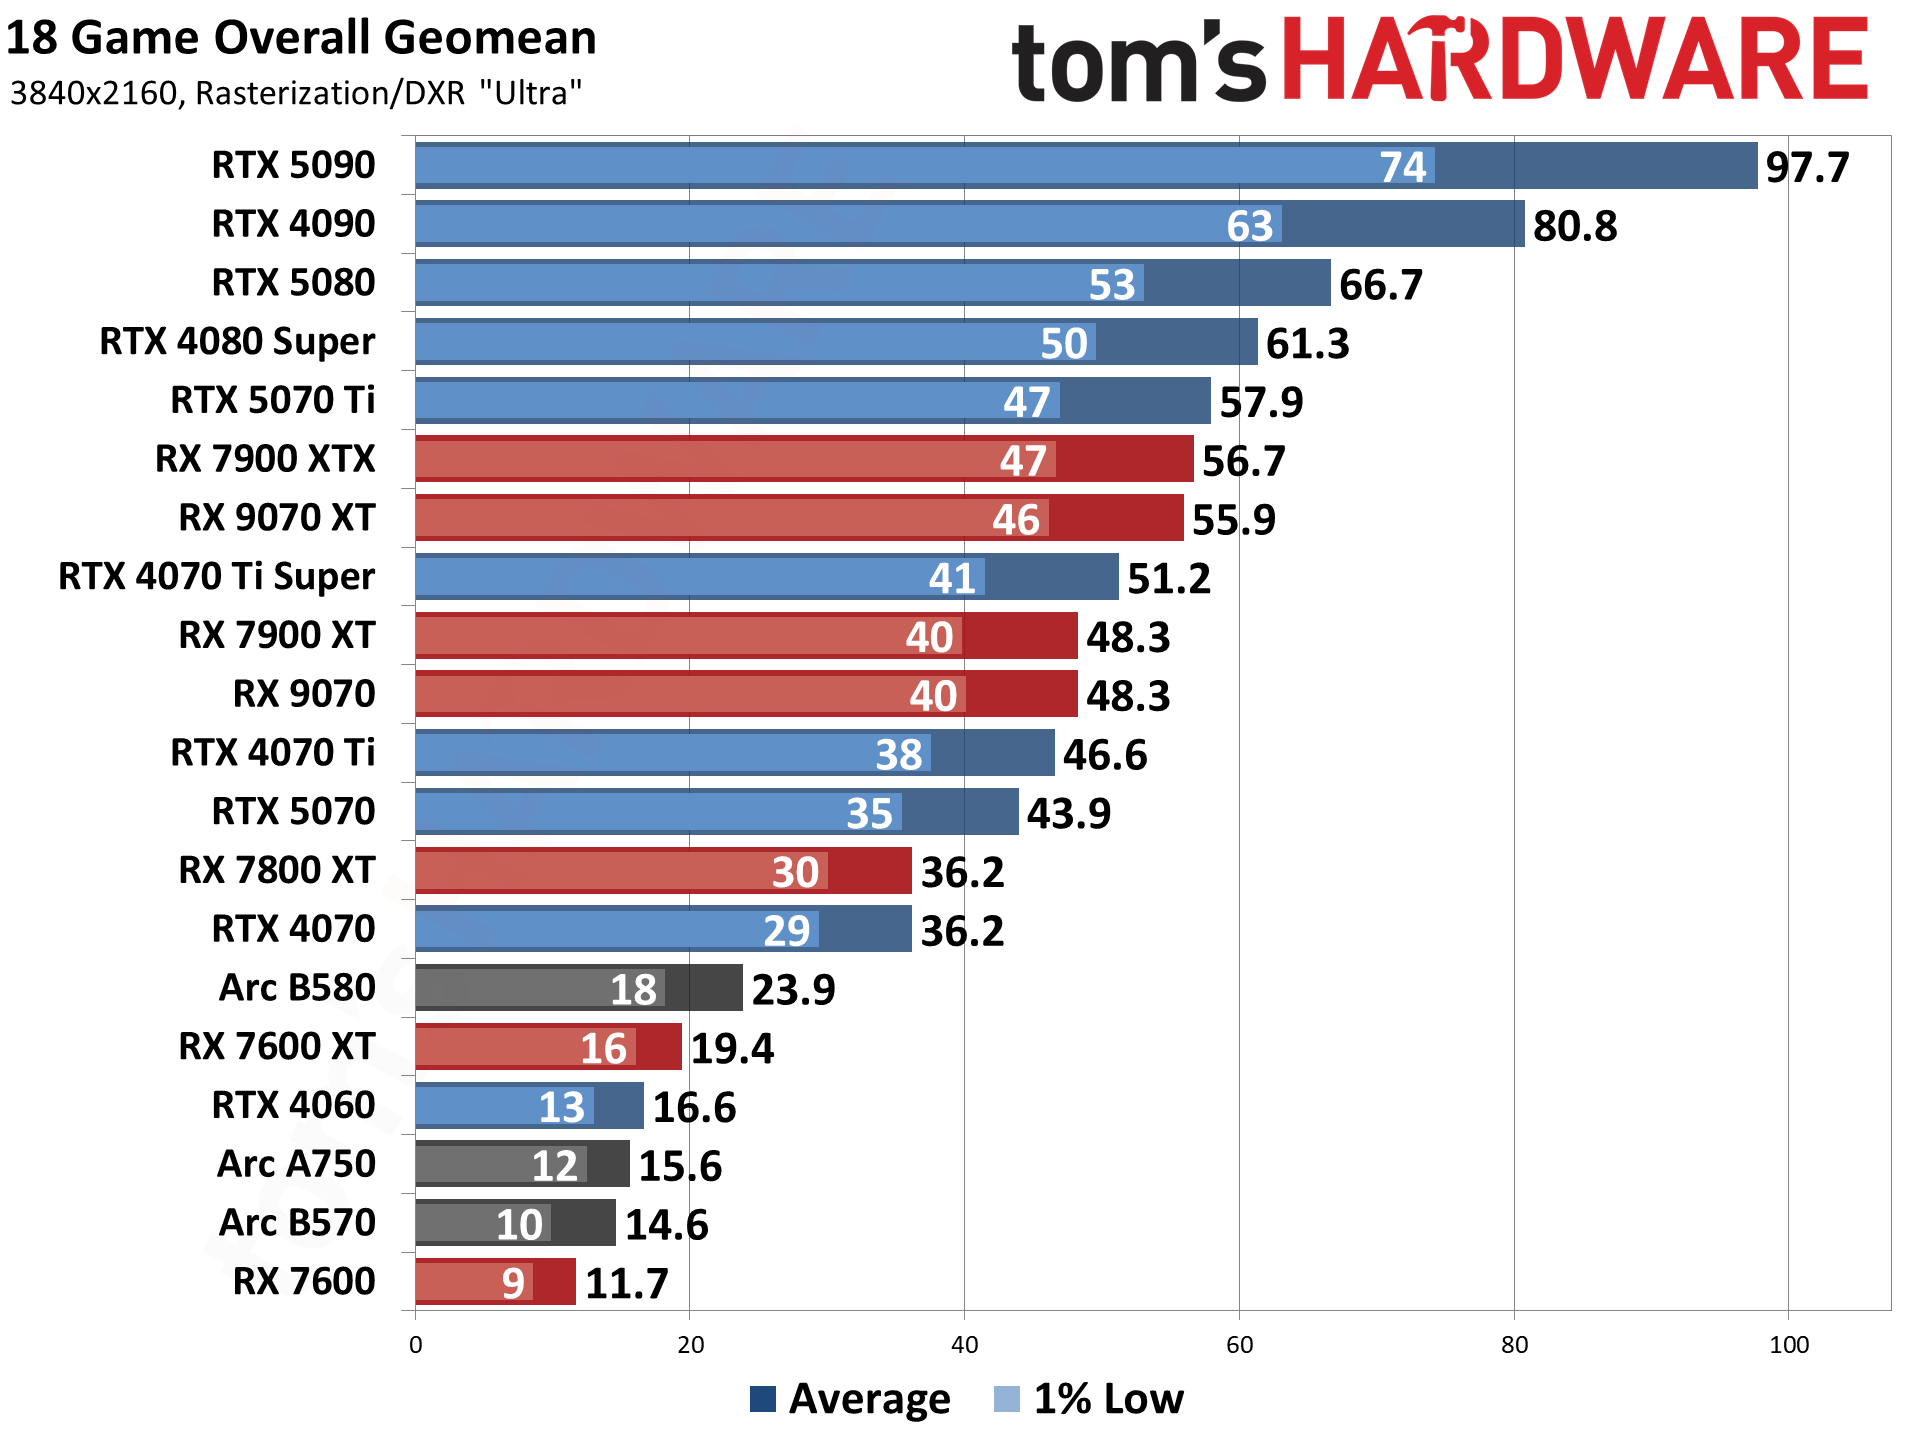
- While the RTX 5090 takes the top spot, pricing is extremely inflated and has been since launch. It’s also largely CPU limited at anything below 4K ultra.
- The latest cards typically match previous gen GPUs that are one or two model tiers “higher” (e.g. RTX 5070 roughly matches the RTX 4070 Ti Super, and RX 9070 XT roughly equals the RX 7900 XTX).
- The best GPU value in FPS per dollar at 1080p and 1440p is the Arc A750. At 4K ultra, the best FPS/$ comes from the RTX 5070. However, the prices on nearly all of the GPUs are inflated and extremely volatile.
- Testing is ongoing and there are quite a few cards we still need to test on the new suite.
| Graphics Card | Lowest Price (MSRP) | 1080p Medium | 1080p Ultra | 1440p Ultra | 4K Ultra | Specifications (Links to Review) |
|---|---|---|---|---|---|---|
| GeForce RTX 5090 | $3,999 ($2,000) | 100.0% (197.5) | 100.0% (157.6) | 100.0% (143.0) | 100.0% (105.8) | GB202, 21760 shaders, 2407MHz, 32GB GDDR7@28Gbps, 1792GB/s, 575W |
| GeForce RTX 4090 | $2,875 ($1,600) | 98.5% (194.6) | 94.9% (149.6) | 88.2% (126.1) | 80.7% (85.4) | AD102, 16384 shaders, 2520MHz, 24GB GDDR6X@21Gbps, 1008GB/s, 450W |
| GeForce RTX 5080 | $1,400 ($1,000) | 90.4% (178.5) | 84.9% (133.9) | 78.1% (111.7) | 67.2% (71.1) | GB203, 10752 shaders, 2617MHz, 16GB GDDR7@30Gbps, 690GB/s, 360W |
| GeForce RTX 4080 Super | $1,600 ($1,000) | 88.2% (174.1) | 82.4% (129.9) | 73.5% (105.1) | 61.5% (65.0) | AD103, 10240 shaders, 2550MHz, 16GB GDDR6X@23Gbps, 736GB/s, 320W |
| Radeon RX 7900 XTX | $1,270 ($1,000) | 88.1% (174.1) | 79.4% (125.1) | 71.8% (102.6) | 60.8% (64.3) | Navi 31, 6144 shaders, 2500MHz, 24GB GDDR6@20Gbps, 960GB/s, 355W |
| GeForce RTX 5070 Ti | $960 ($750) | 85.8% (169.4) | 79.1% (124.7) | 71.0% (101.5) | 58.7% (62.1) | GB203, 8960 shaders, 2452MHz, 16GB GDDR7@28Gbps, 896GB/s, 300W |
| Radeon RX 9070 XT | $850 ($600) | 85.6% (169.0) | 76.1% (119.9) | 68.7% (98.3) | 57.6% (61.0) | Navi 48, 4096 shaders, 2970MHz, 16GB GDDR6@20Gbps, 640GB/s, 304W |
| Radeon RX 7900 XT | $894 ($750) | 84.6% (167.1) | 75.8% (119.4) | 67.7% (96.9) | 56.0% (59.3) | Navi 31, 5376 shaders, 2400MHz, 20GB GDDR6@20Gbps, 800GB/s, 315W |
| Radeon RX 9070 | $670 ($550) | 82.5% (162.9) | 72.8% (114.7) | 64.8% (92.7) | 53.8% (56.9) | Navi 48, 3584 shaders, 2520MHz, 16GB GDDR6@20Gbps, 640GB/s, 220W |
| GeForce RTX 4070 Ti Super | $1,096 ($800) | 80.8% (159.5) | 73.7% (116.1) | 64.0% (91.5) | 51.4% (54.4) | AD103, 8448 shaders, 2610MHz, 16GB GDDR6X@21Gbps, 672GB/s, 285W |
| GeForce RTX 5070 | $600 ($550) | 80.0% (158.0) | 73.1% (115.2) | 63.5% (90.8) | 51.3% (54.3) | GB205, 6144 shaders, 2512MHz, 12GB GDDR7@28Gbps, 672GB/s, 250W |
| GeForce RTX 4070 Ti | $1,096 ($800) | 79.2% (156.4) | 72.0% (113.4) | 61.9% (88.5) | 49.2% (52.1) | AD104, 7680 shaders, 2610MHz, 12GB GDDR6X@21Gbps, 504GB/s, 285W |
| GeForce RTX 4070 | $734 ($550) | 74.4% (146.9) | 67.1% (105.8) | 56.8% (81.3) | 44.8% (47.4) | AD104, 5888 shaders, 2475MHz, 12GB GDDR6X@21Gbps, 504GB/s, 200W |
| Radeon RX 7800 XT | $590 ($500) | 67.3% (132.8) | 57.2% (90.1) | 48.6% (69.5) | 38.5% (40.7) | Navi 32, 3840 shaders, 2430MHz, 16GB [email protected], 624GB/s, 263W |
| Intel Arc B580 | $341 ($250) | 41.4% (81.8) | 35.8% (56.4) | 30.2% (43.2) | 23.7% (25.1) | BMG-G21, 2560 shaders, 2850MHz, 12GB GDDR6@19Gbps, 456GB/s, 190W |
| Radeon RX 7600 XT | $420 ($330) | 43.4% (85.6) | 36.7% (57.8) | 29.4% (42.1) | 21.4% (22.7) | Navi 33, 2048 shaders, 2755MHz, 16GB GDDR6@18Gbps, 288GB/s, 190W |
| Intel Arc A770 16GB | $439 ($330) | 32.1% (63.4) | 29.8% (46.9) | 25.7% (36.7) | 21.0% (22.2) | ACM-G10, 4096 shaders, 2400MHz, 16GB [email protected], 560GB/s, 225W |
| GeForce RTX 4060 | $320 ($300) | 42.6% (84.2) | 36.9% (58.1) | 28.4% (40.7) | 16.1% (17.0) | AD107, 3072 shaders, 2460MHz, 8GB GDDR6@17Gbps, 272GB/s, 115W |
| Radeon RX 7600 | $260 ($270) | 42.0% (82.8) | 31.5% (49.7) | 24.1% (34.4) | 16.0% (17.0) | Navi 33, 2048 shaders, 2655MHz, 8GB GDDR6@18Gbps, 288GB/s, 165W |
| Intel Arc A750 | $200 ($200) | 29.0% (57.4) | 25.8% (40.7) | 21.6% (30.9) | 15.9% (16.9) | ACM-G10, 3584 shaders, 2350MHz, 8GB GDDR6@16Gbps, 512GB/s, 225W |
| Intel Arc B570 | $296 ($220) | 36.6% (72.3) | 30.3% (47.8) | 24.6% (35.2) | 15.2% (16.1) | BMG-G21, 2304 shaders, 2750MHz, 10GB GDDR6@19Gbps, 380GB/s, 150W |
Keep in mind that we’re not including any ray tracing or DLSS results in the above table, as we use the same test suite with the same settings on all current and previous generation graphics cards. Only RTX cards support DLSS, with FSR 2/3/4 and XeSS being less supported in general, but all three upscaling solutions offer different results and we want to keep things more directly comparable.
We’ll hold off on further analysis for now — check the next page to see where older generation GPUs land. Hopefully, prices become a bit more palatable by the time we’ve finished additional tests. But let’s switch over to the ray tracing hierarchy.
Ray Tracing GPU Benchmarks Ranking 2025
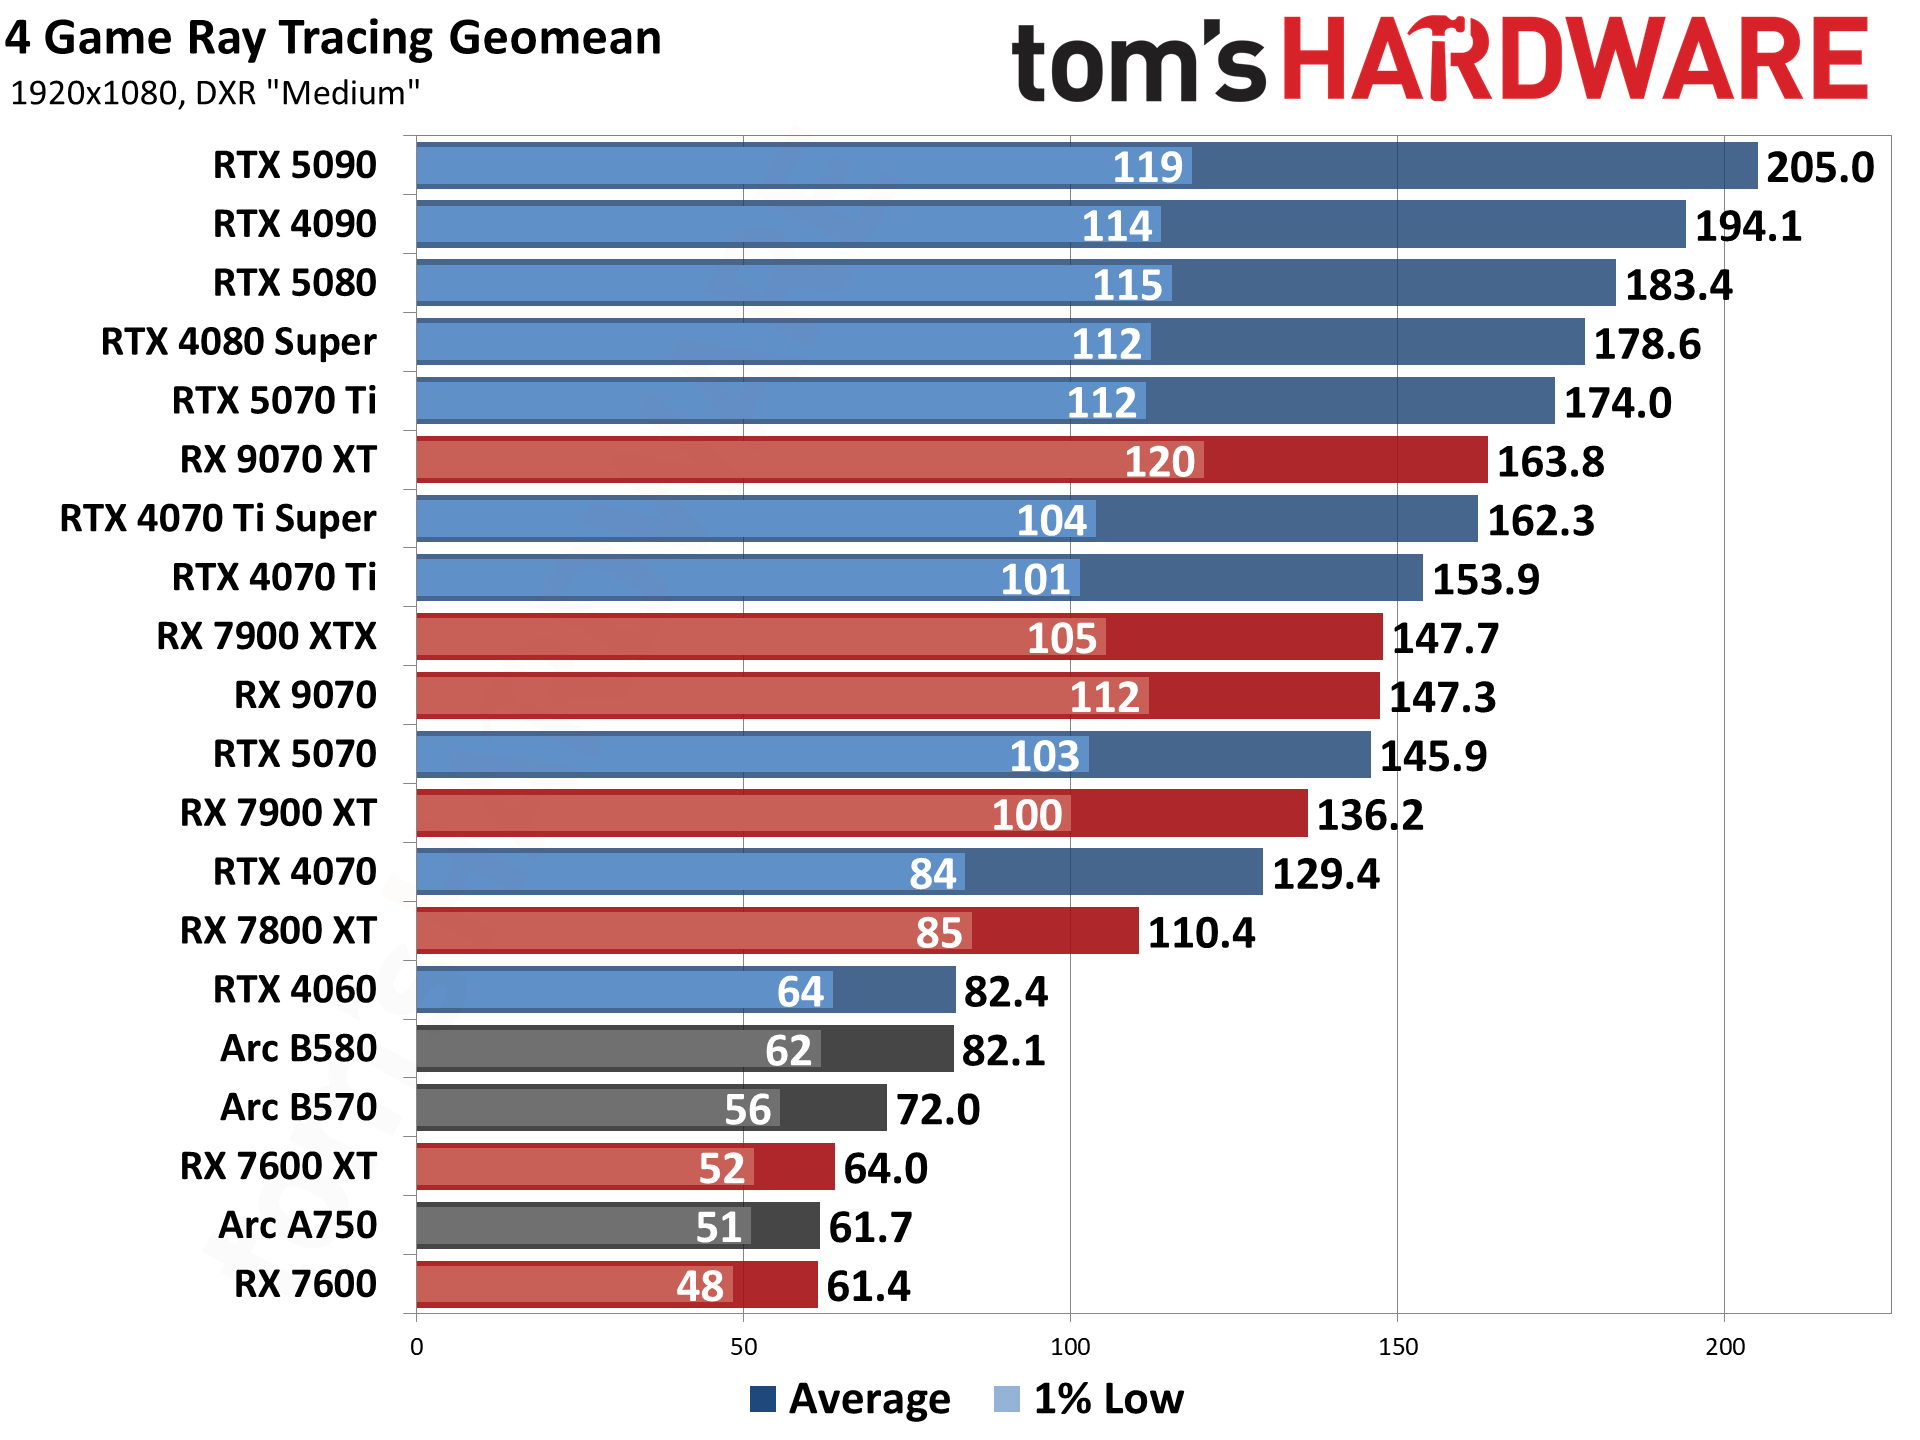
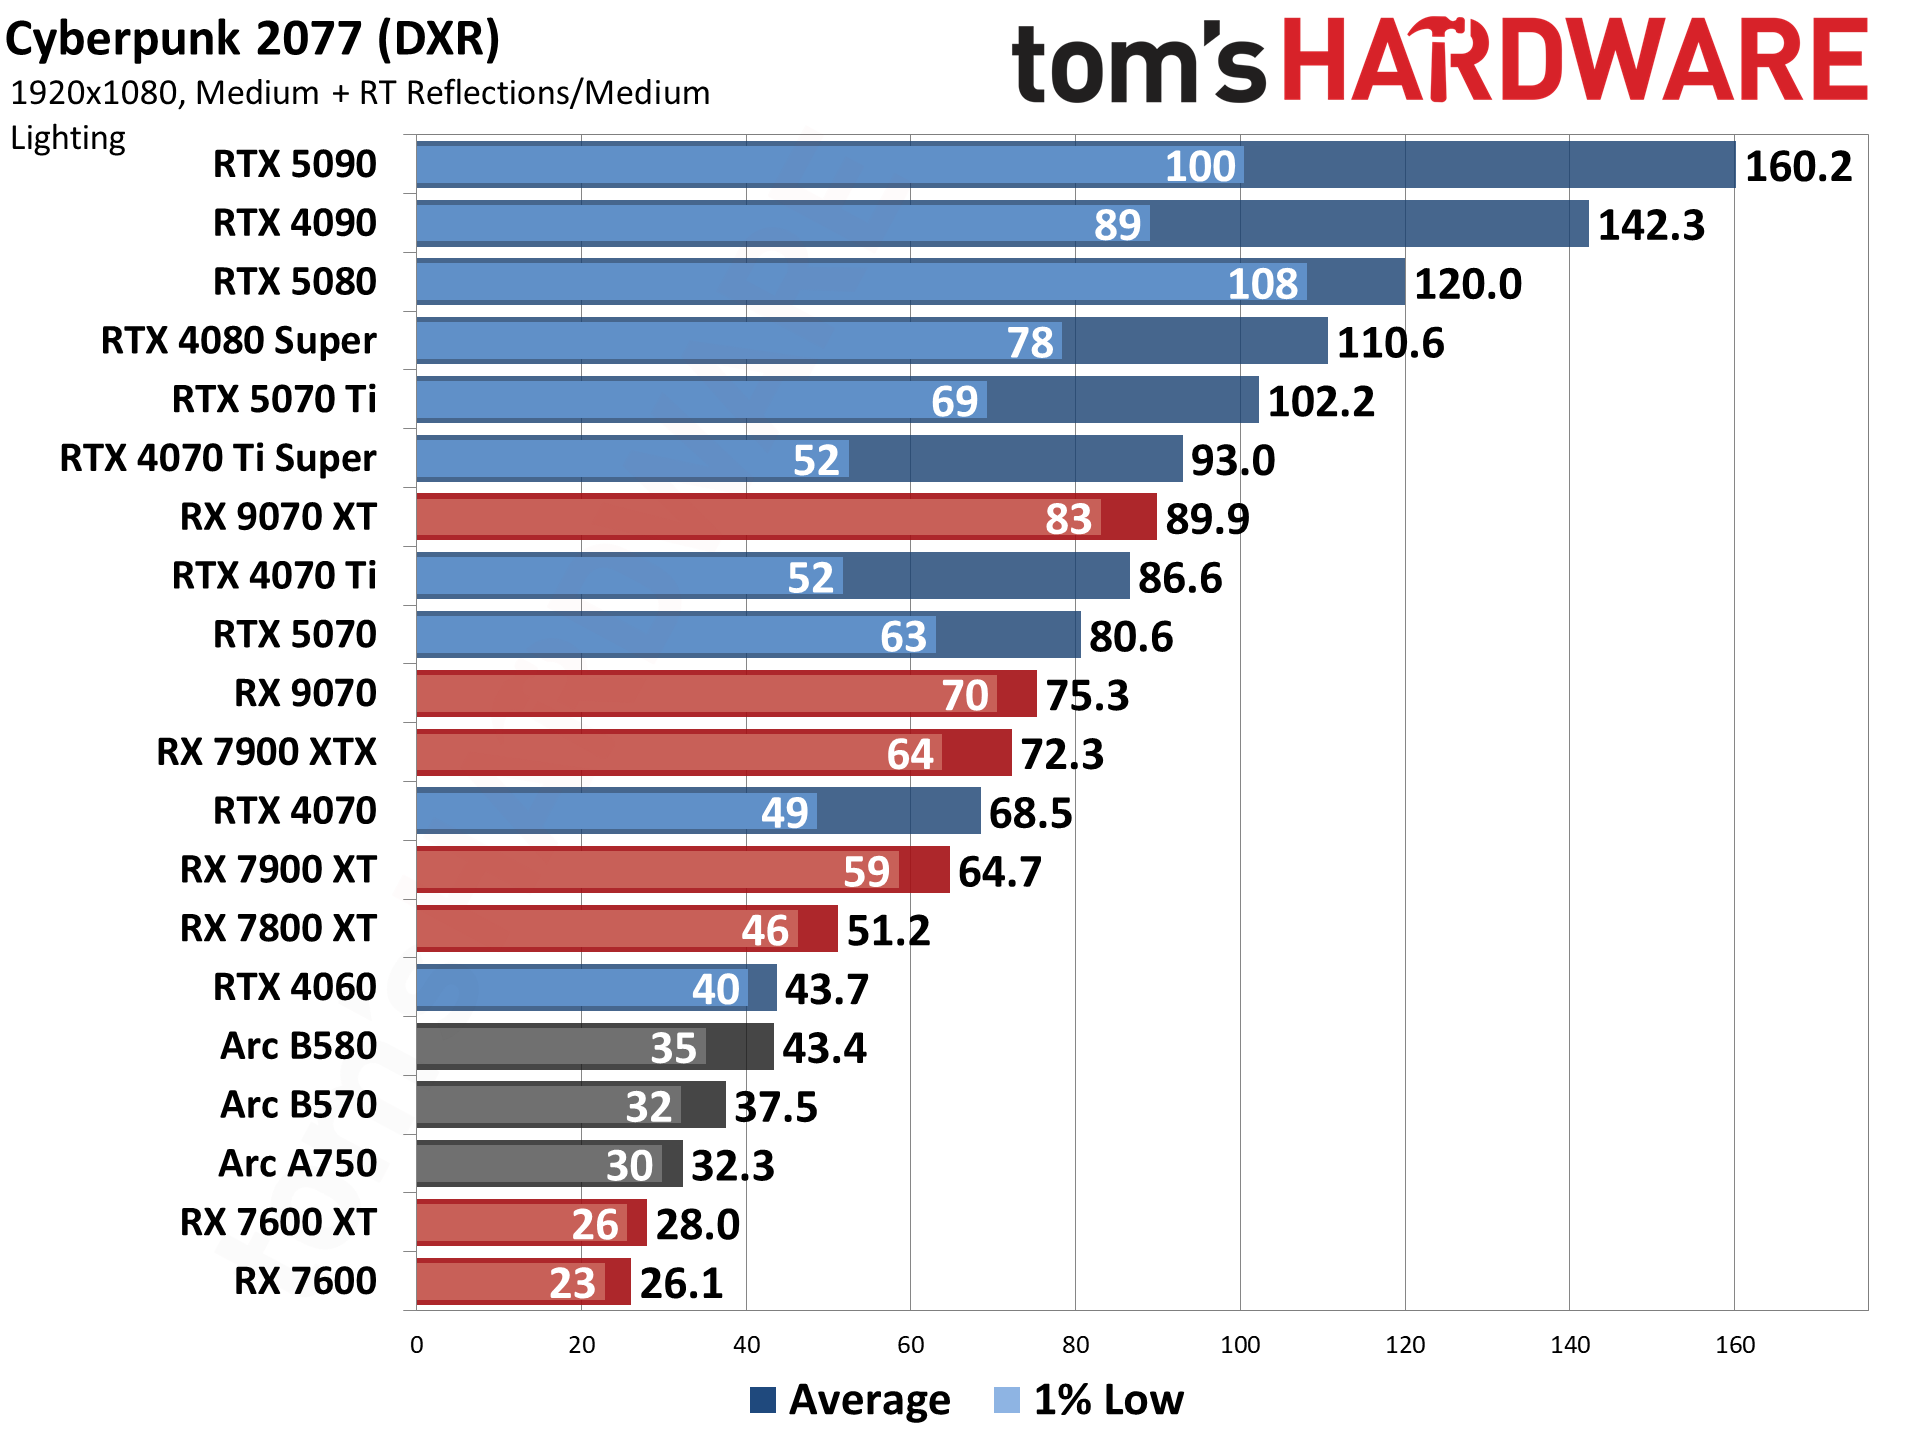
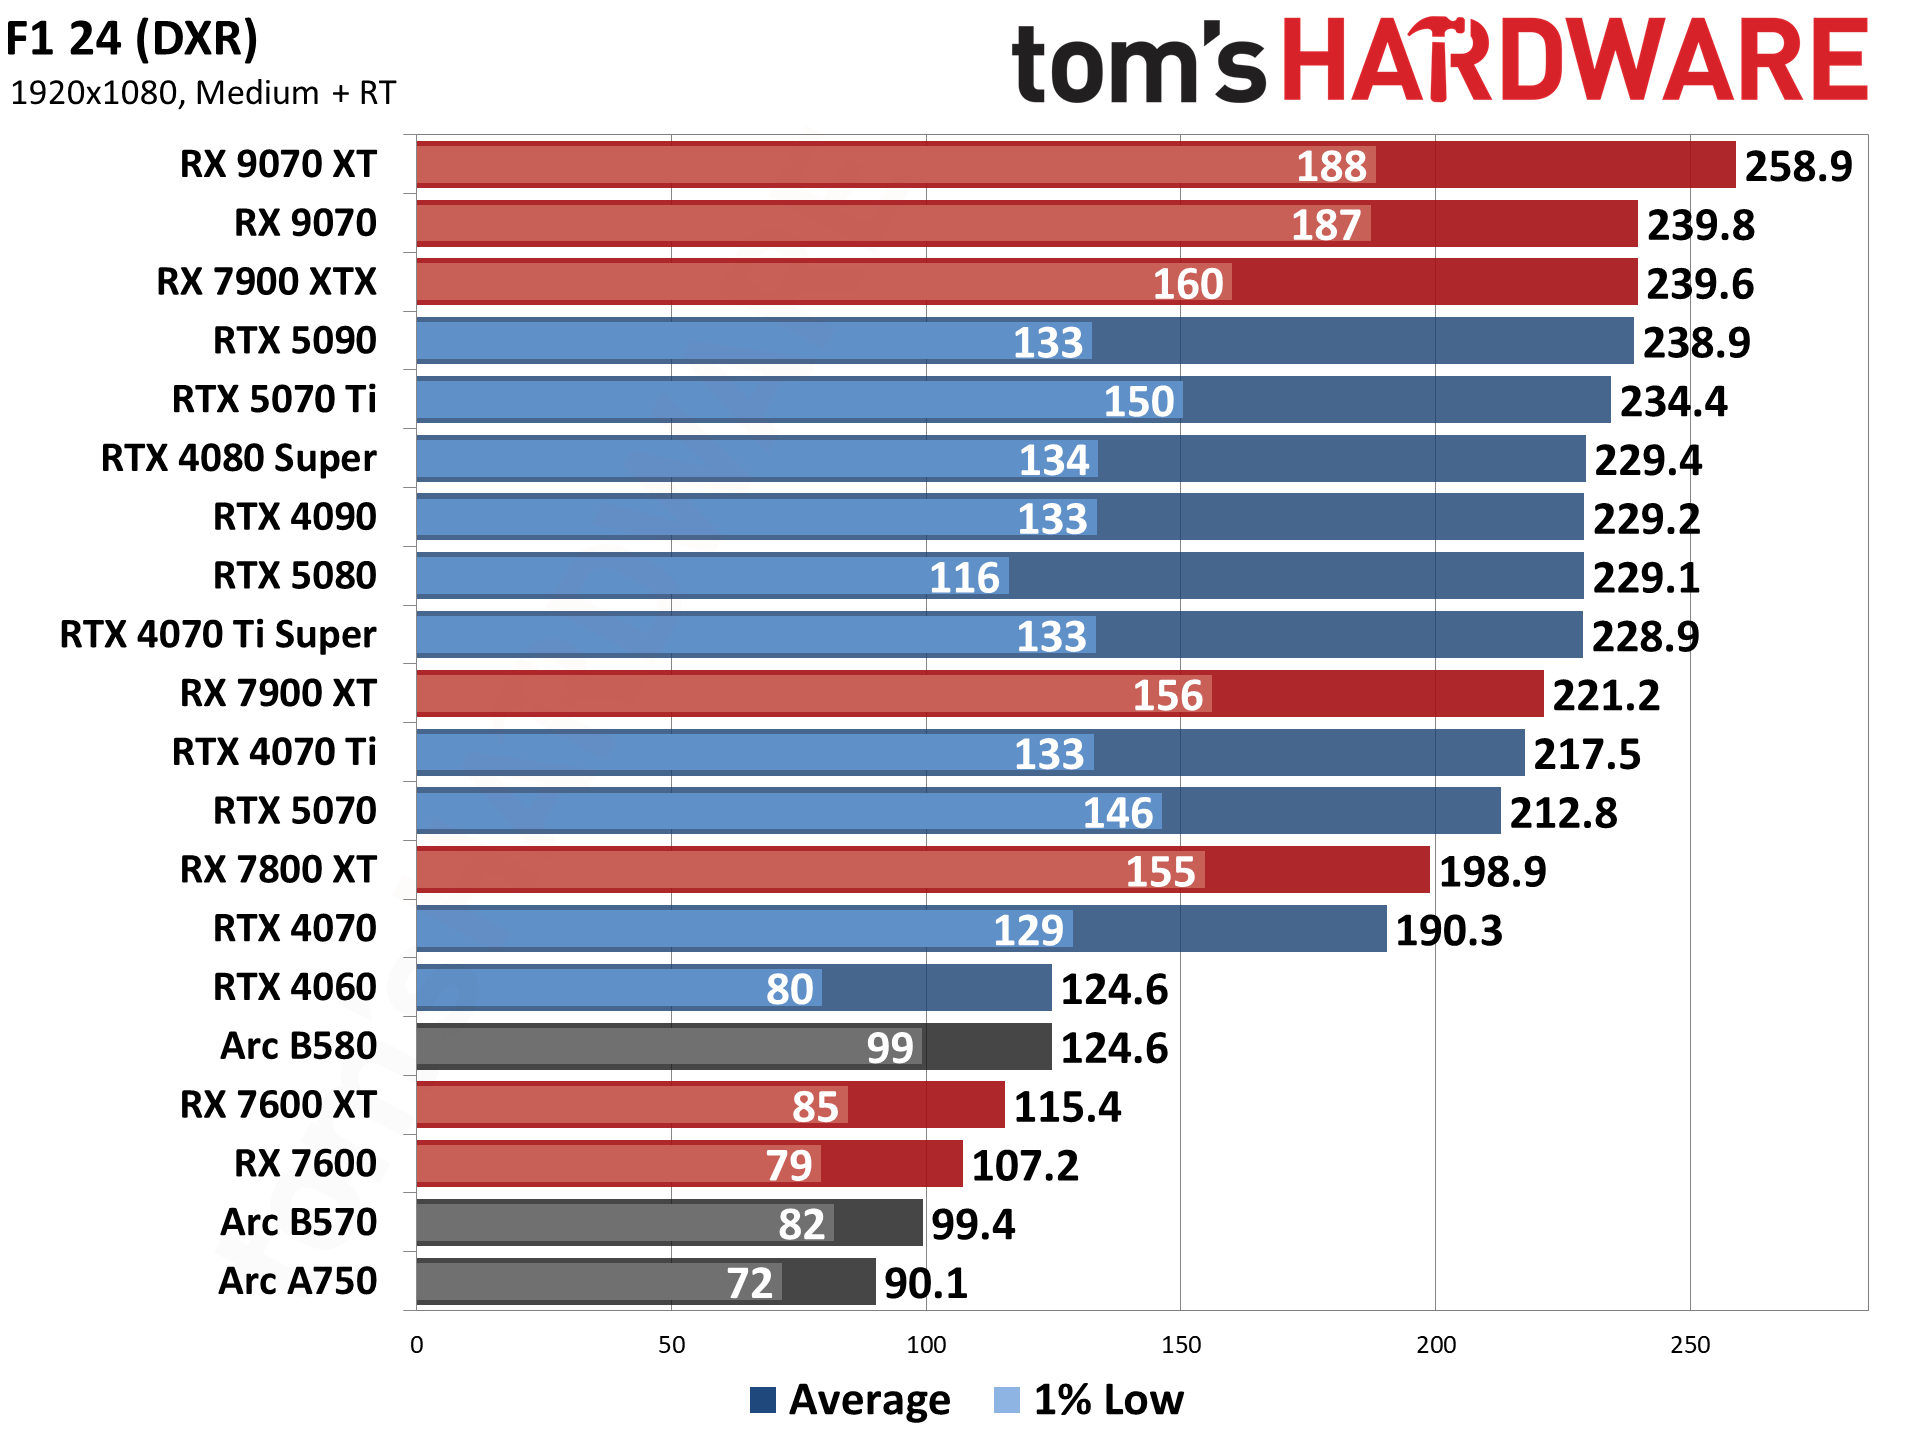
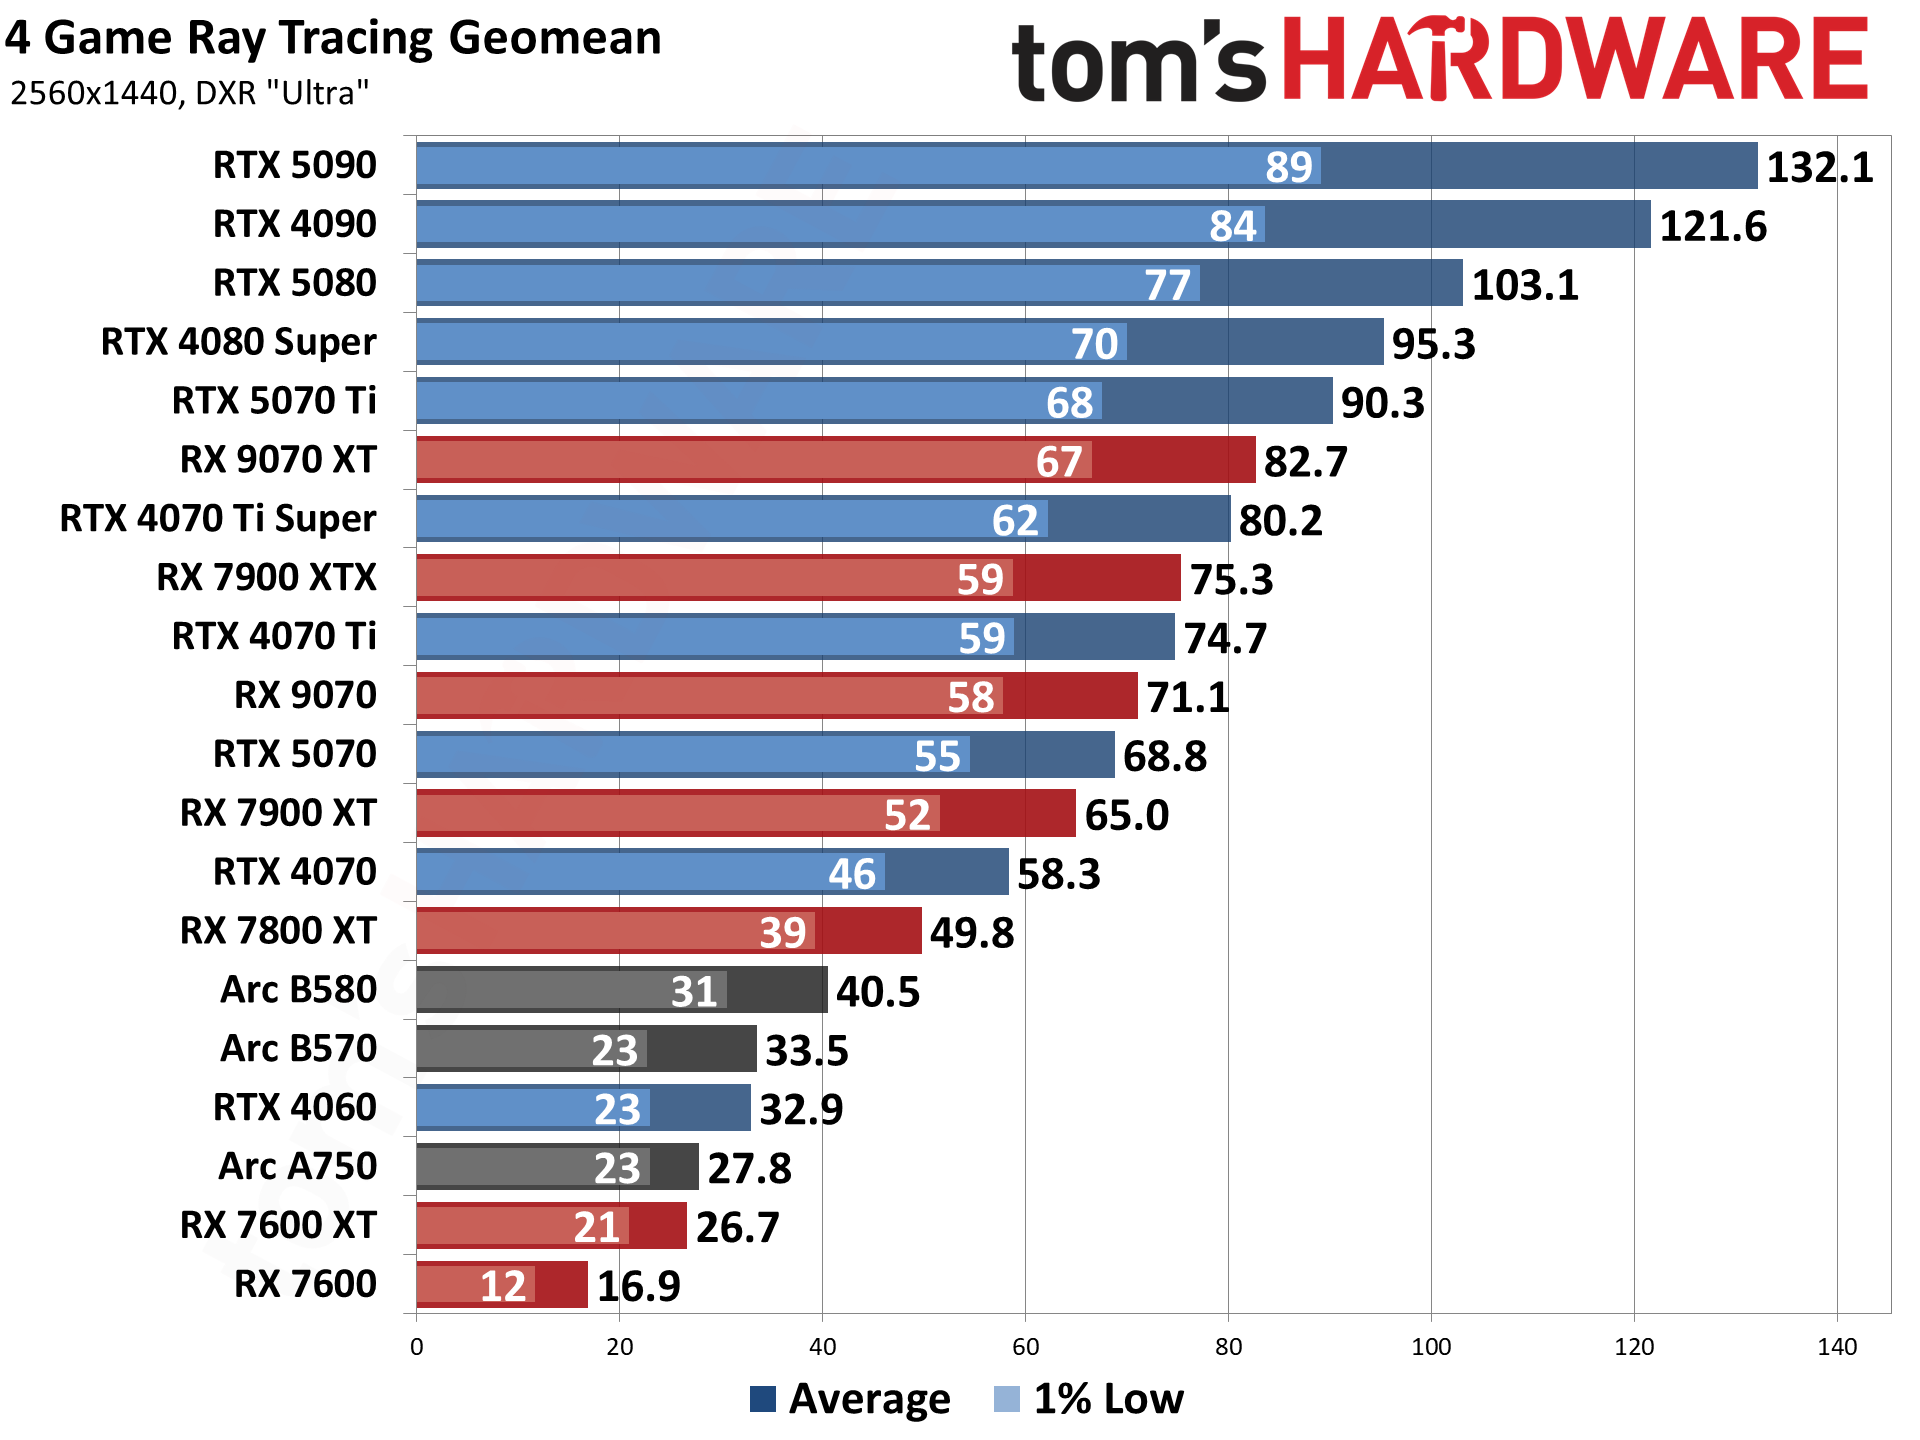
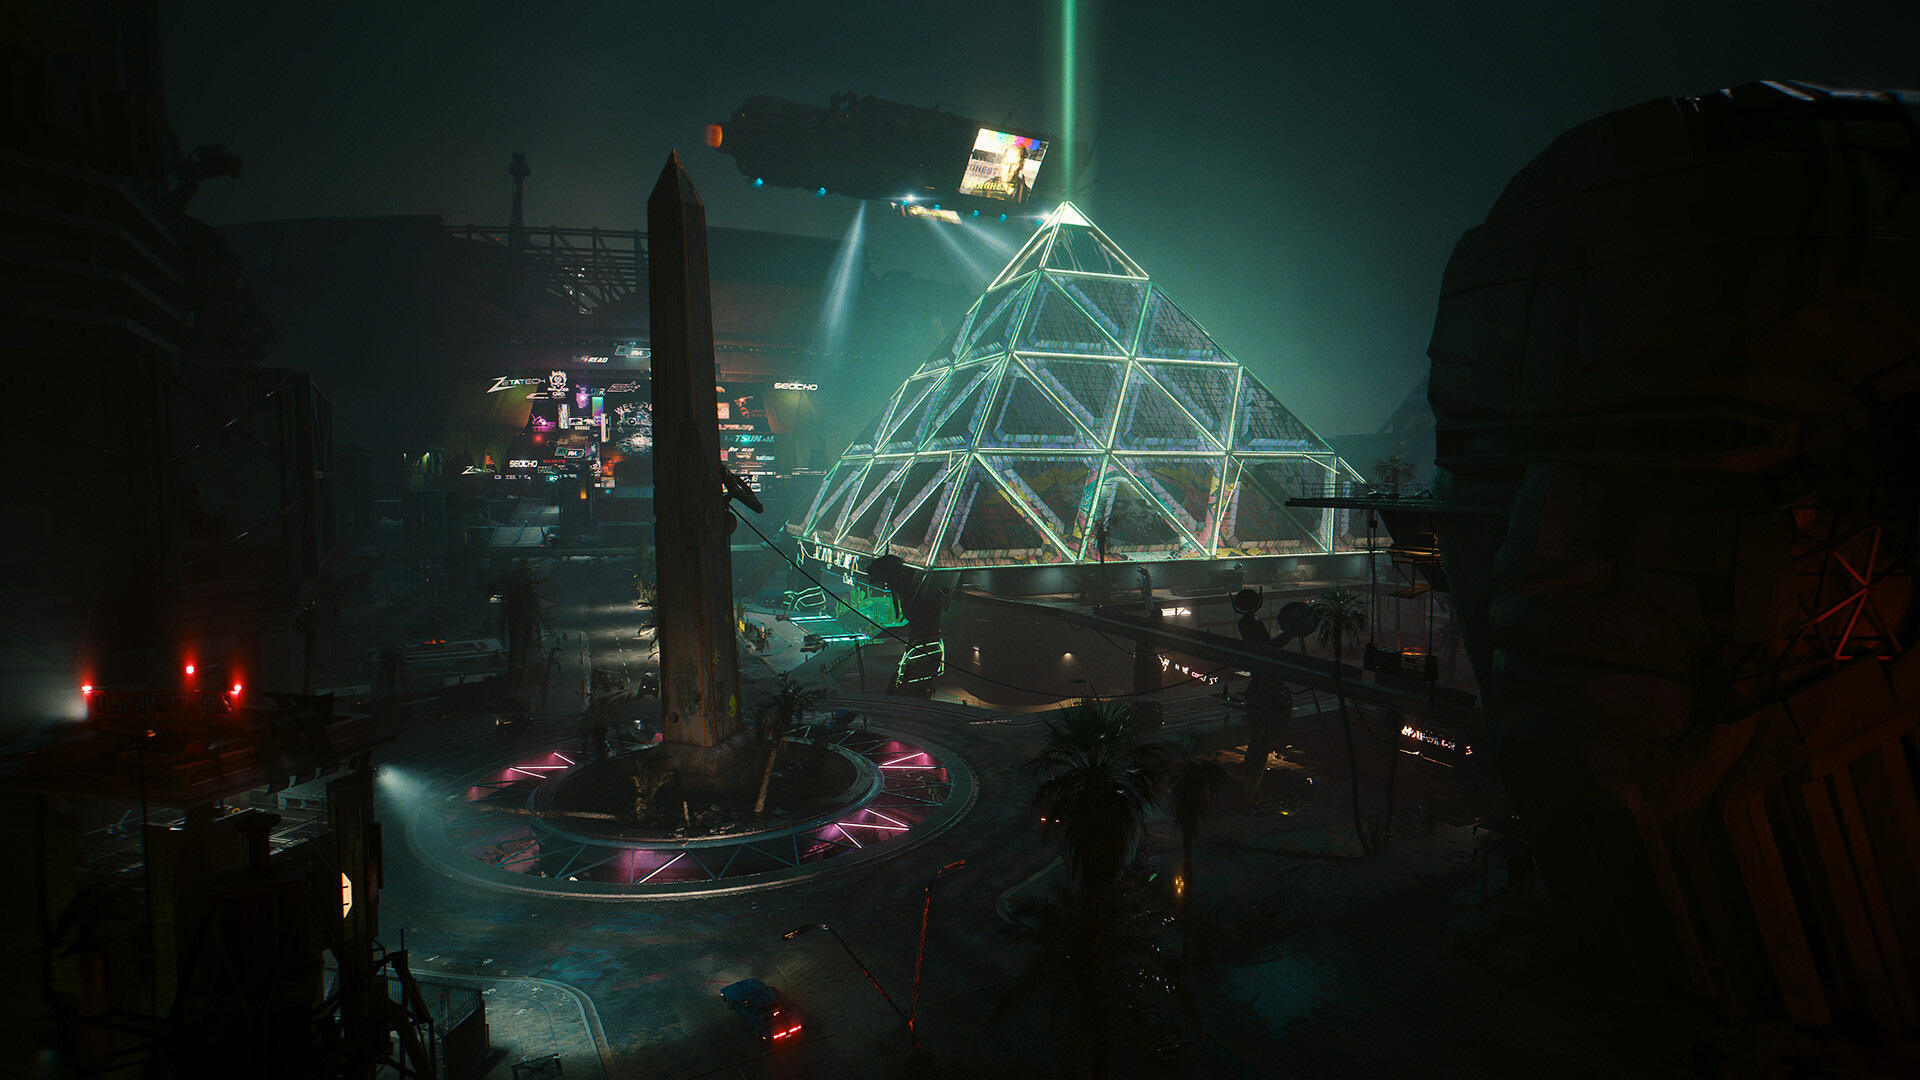
Enabling ray tracing, particularly with the most demanding games, can cause framerates to drop off a cliff. We’re testing with “medium” and “ultra” ray tracing settings. Medium generally means using the medium graphics preset but turning on ray tracing effects (set to “medium” if that’s an option; otherwise, “on”), while ultra turns on all of the RT options at more or less maximum quality.
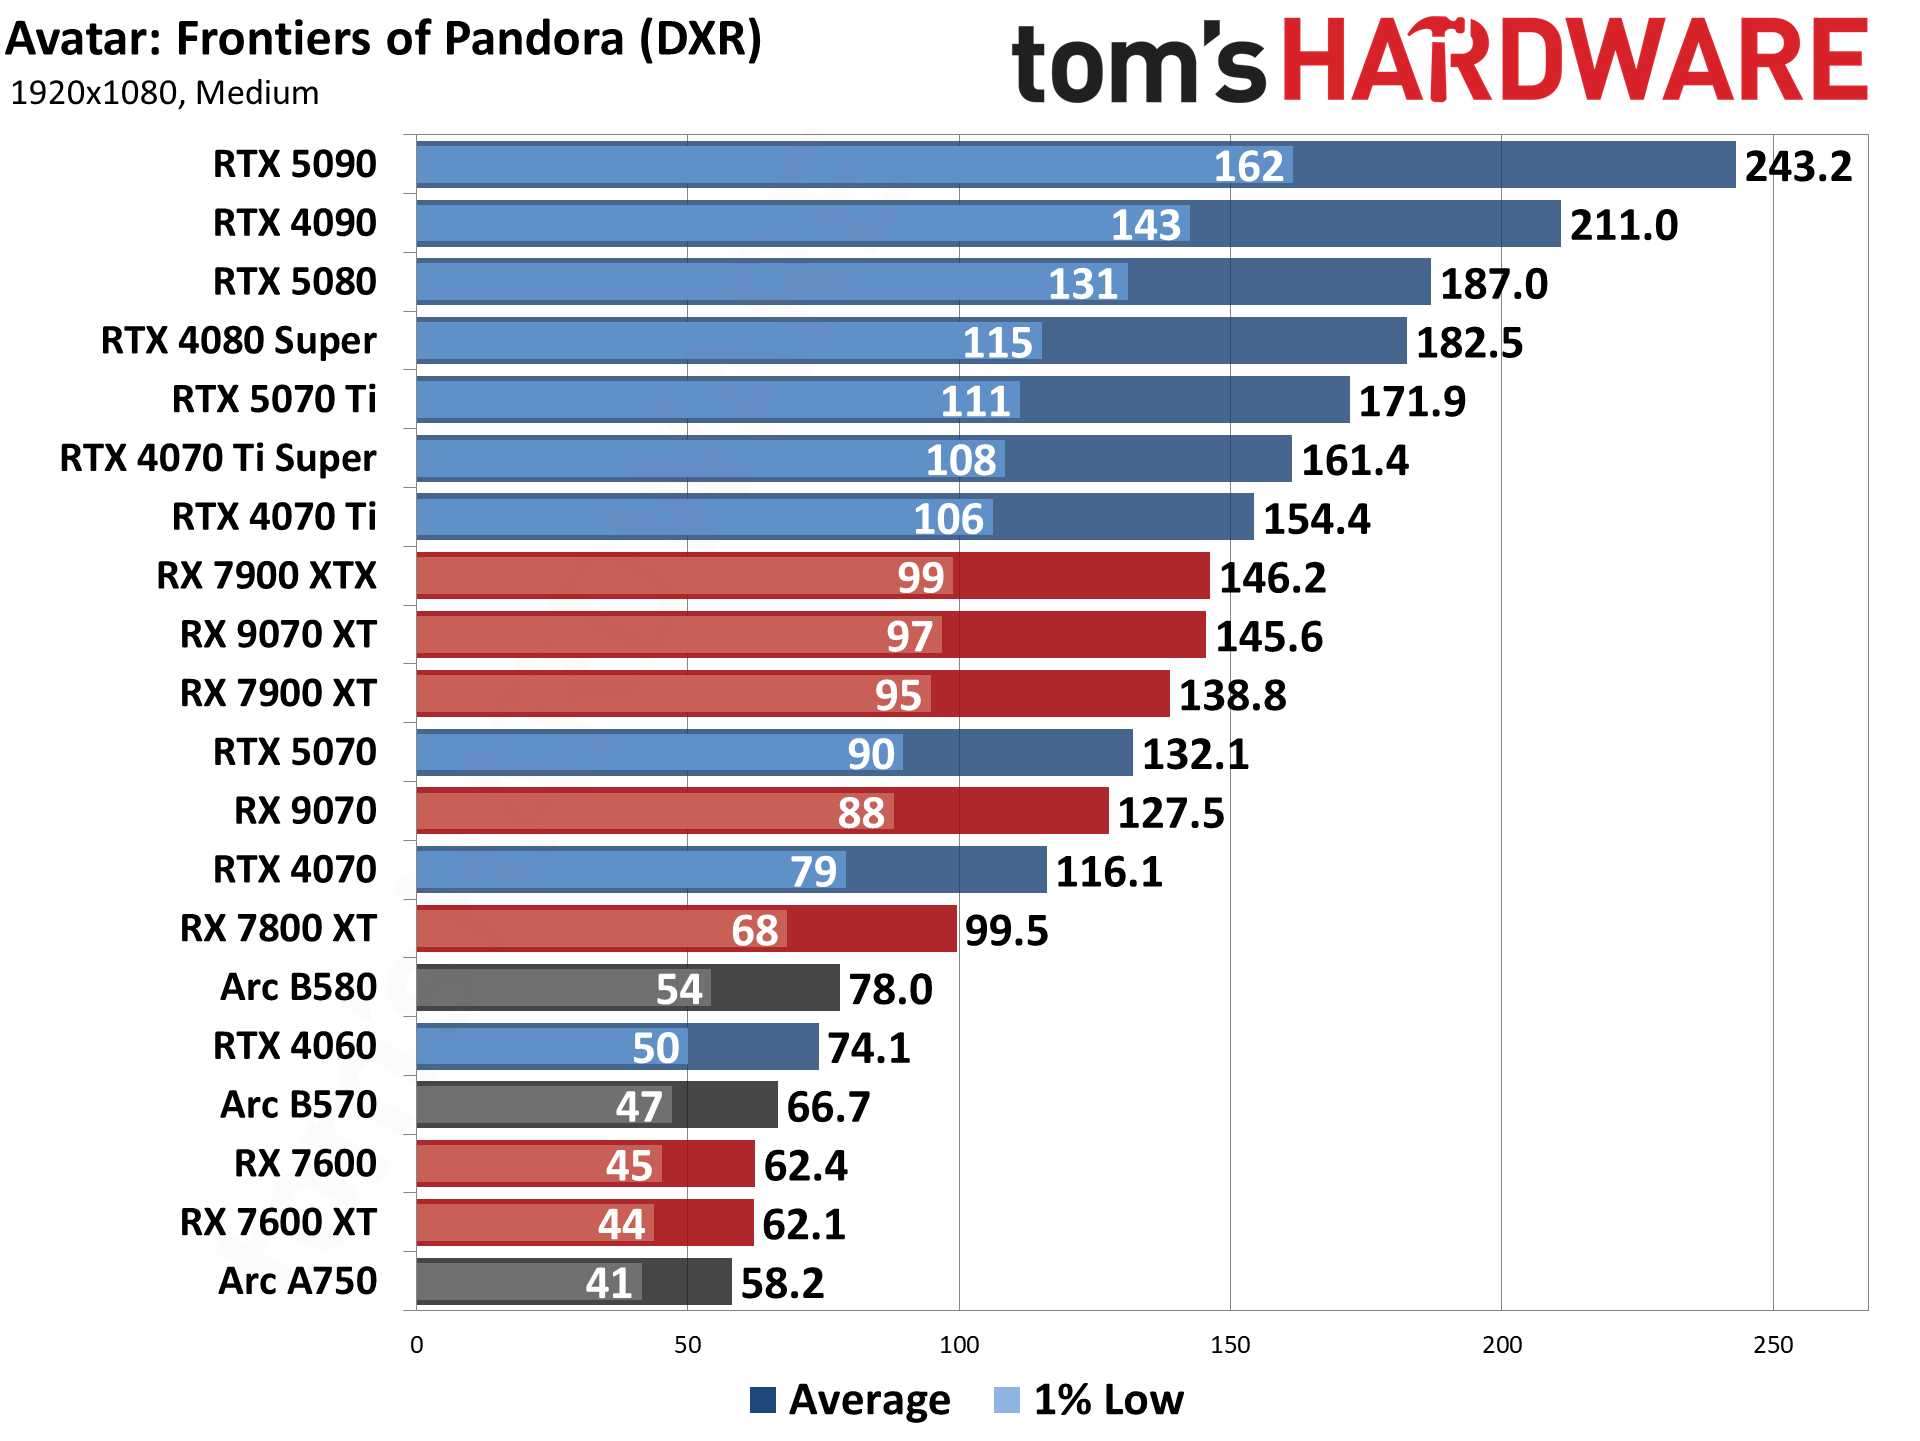
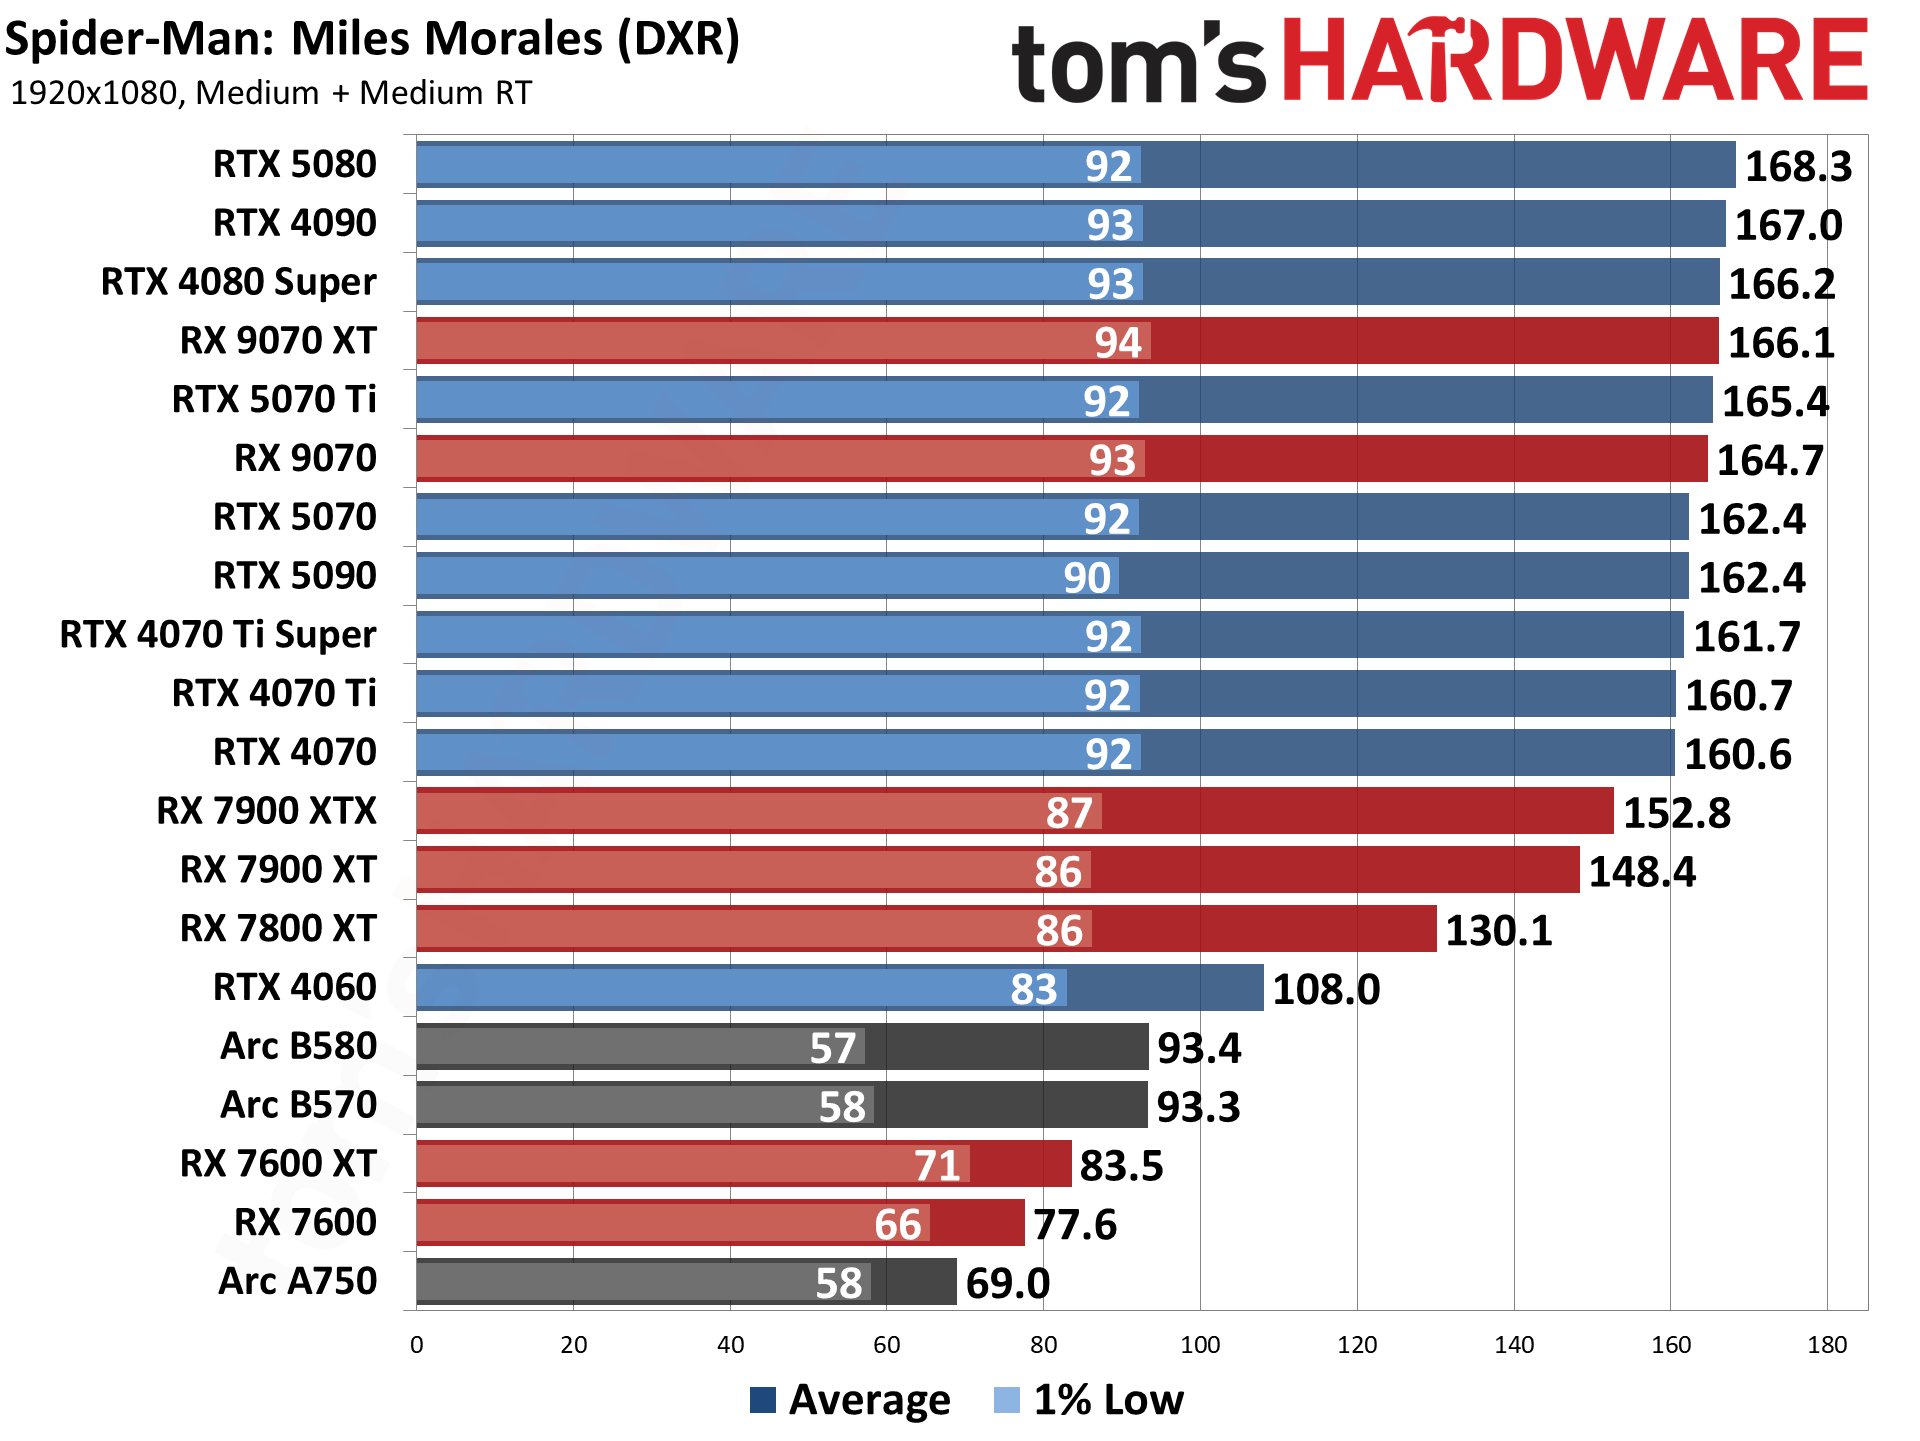
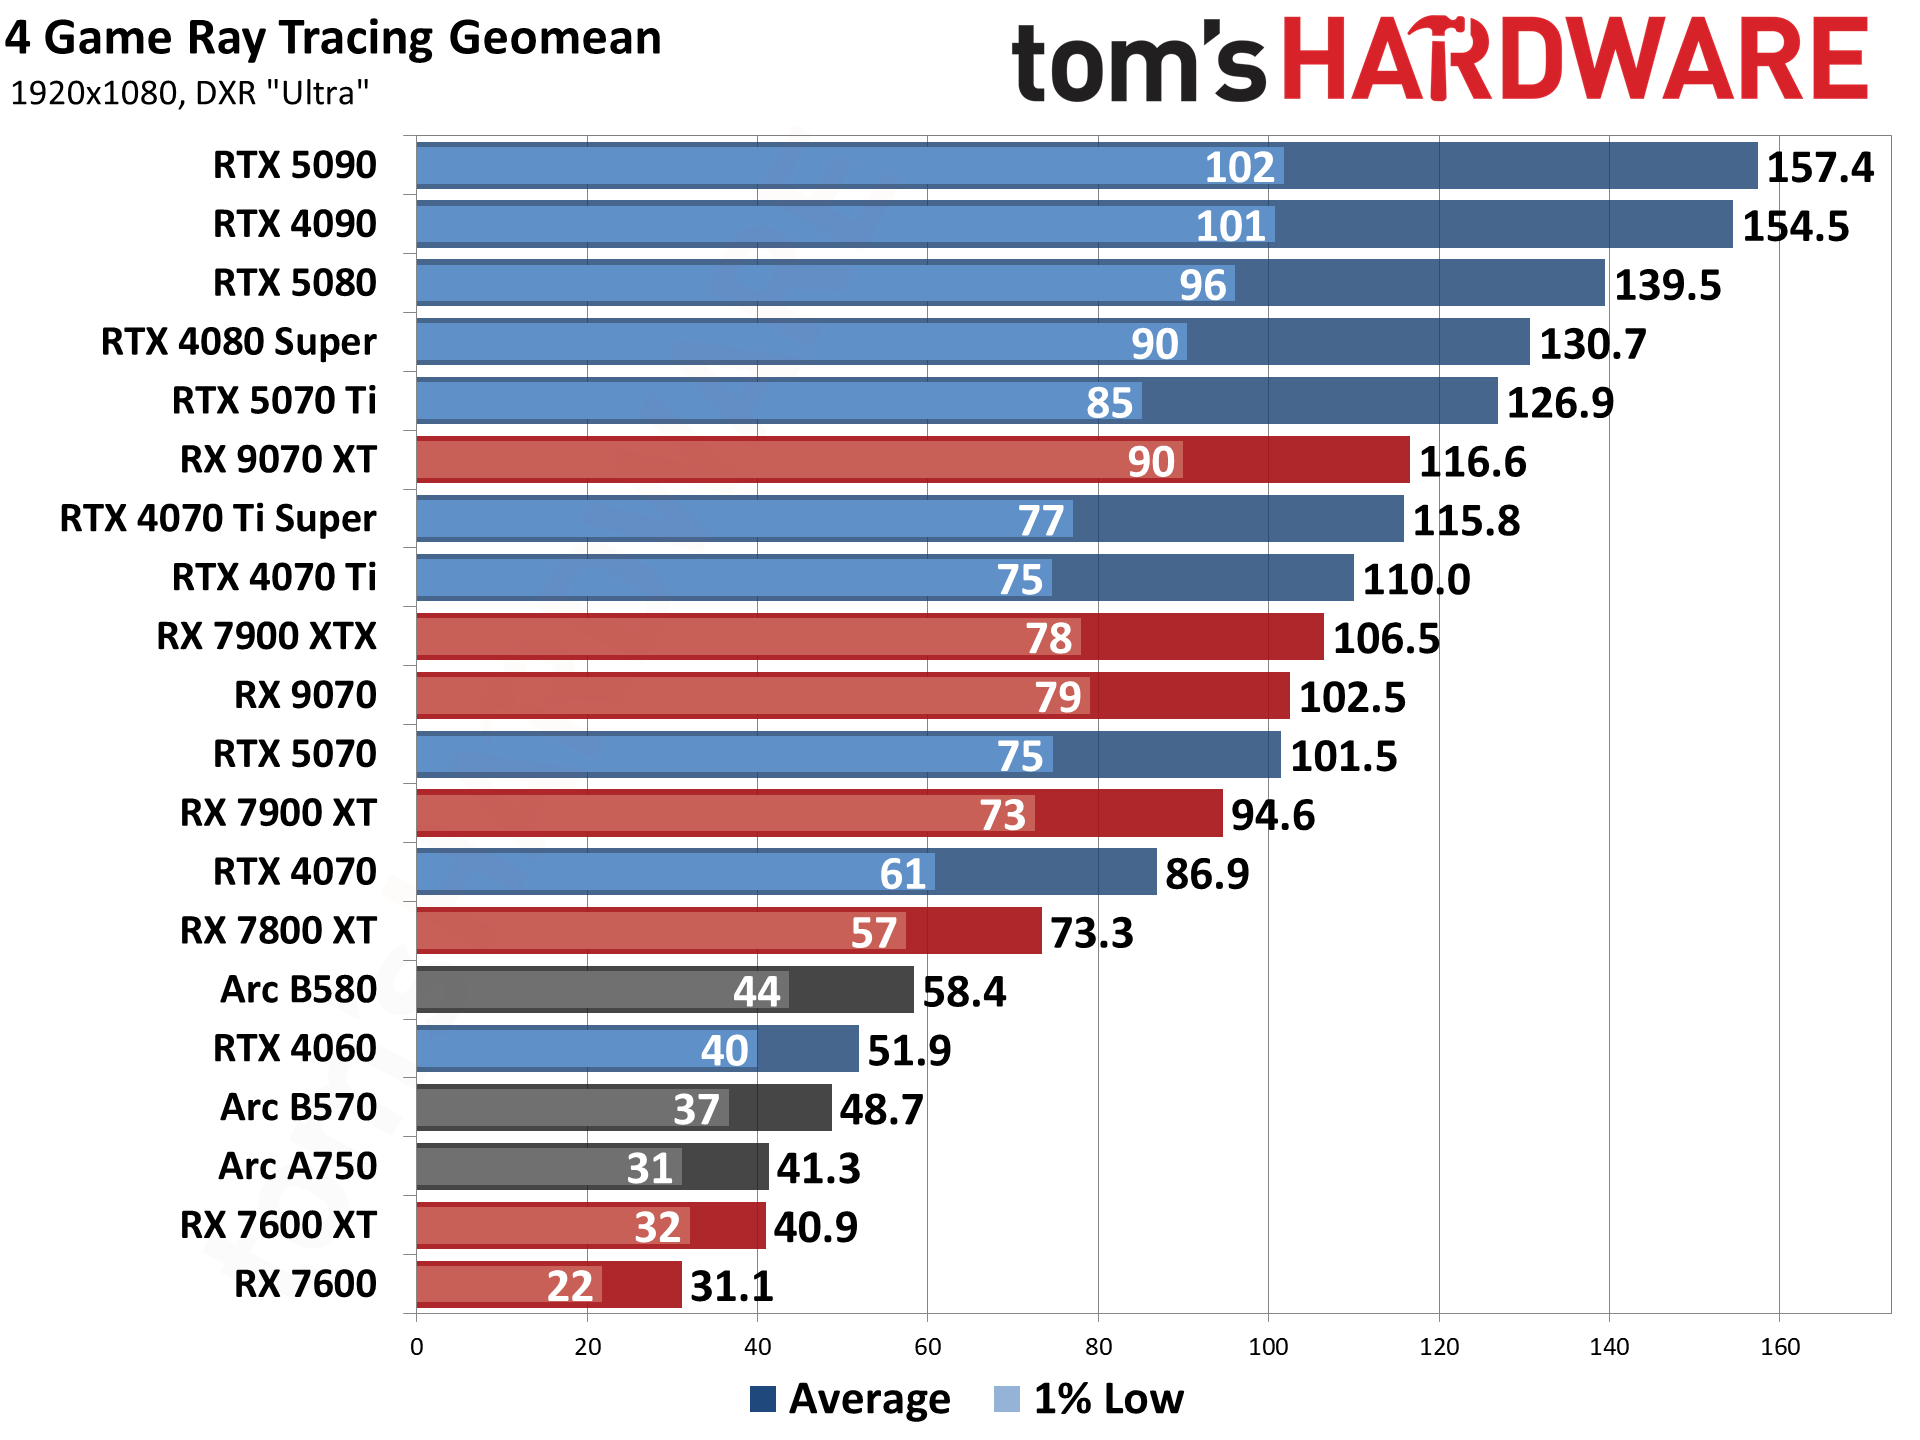
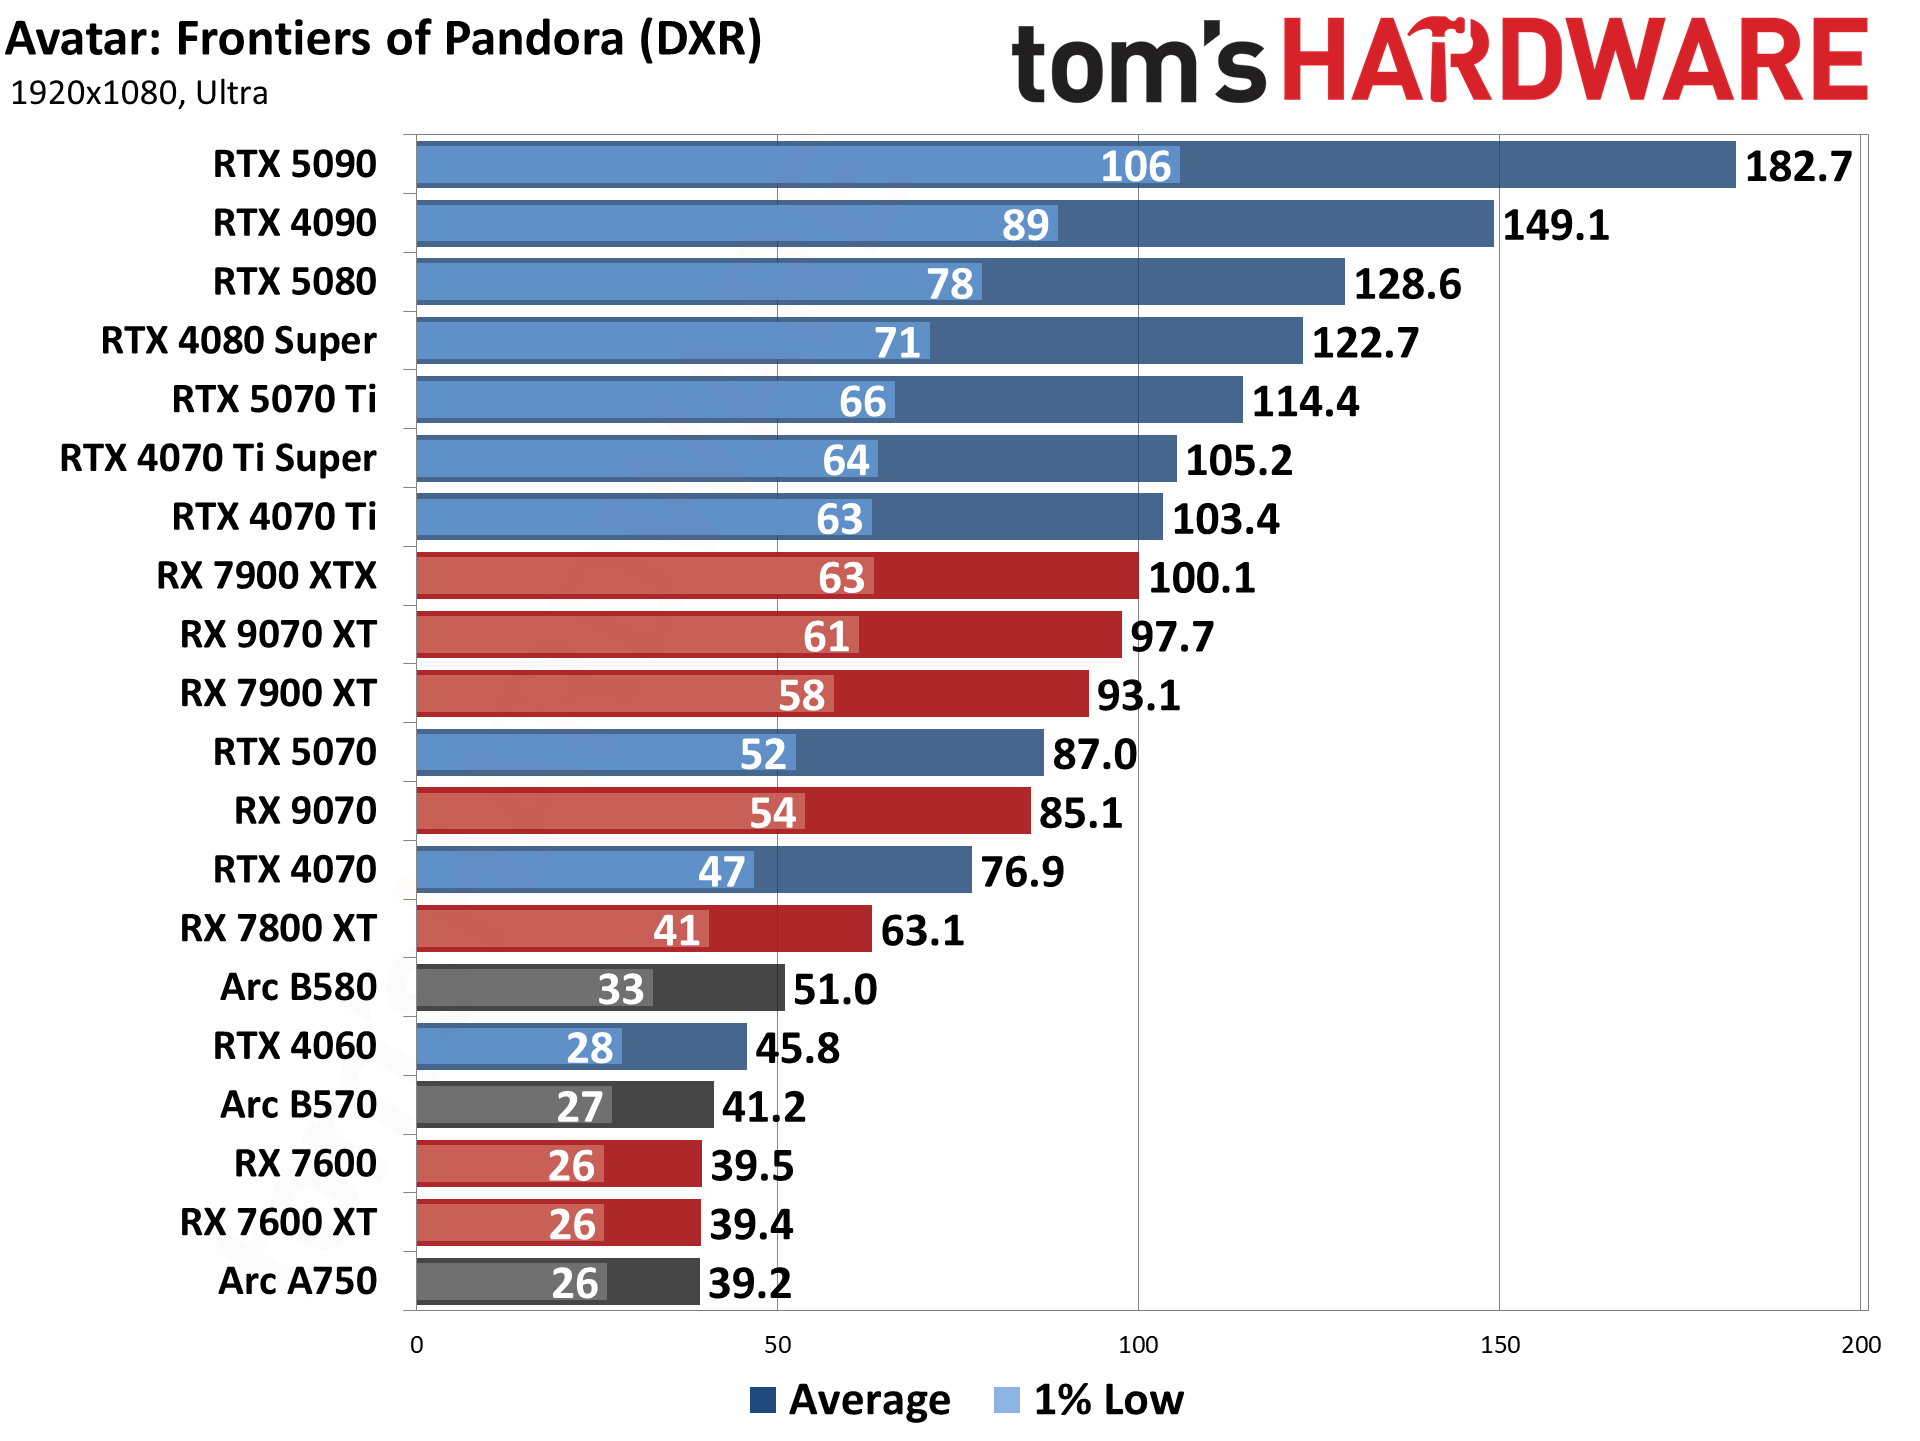
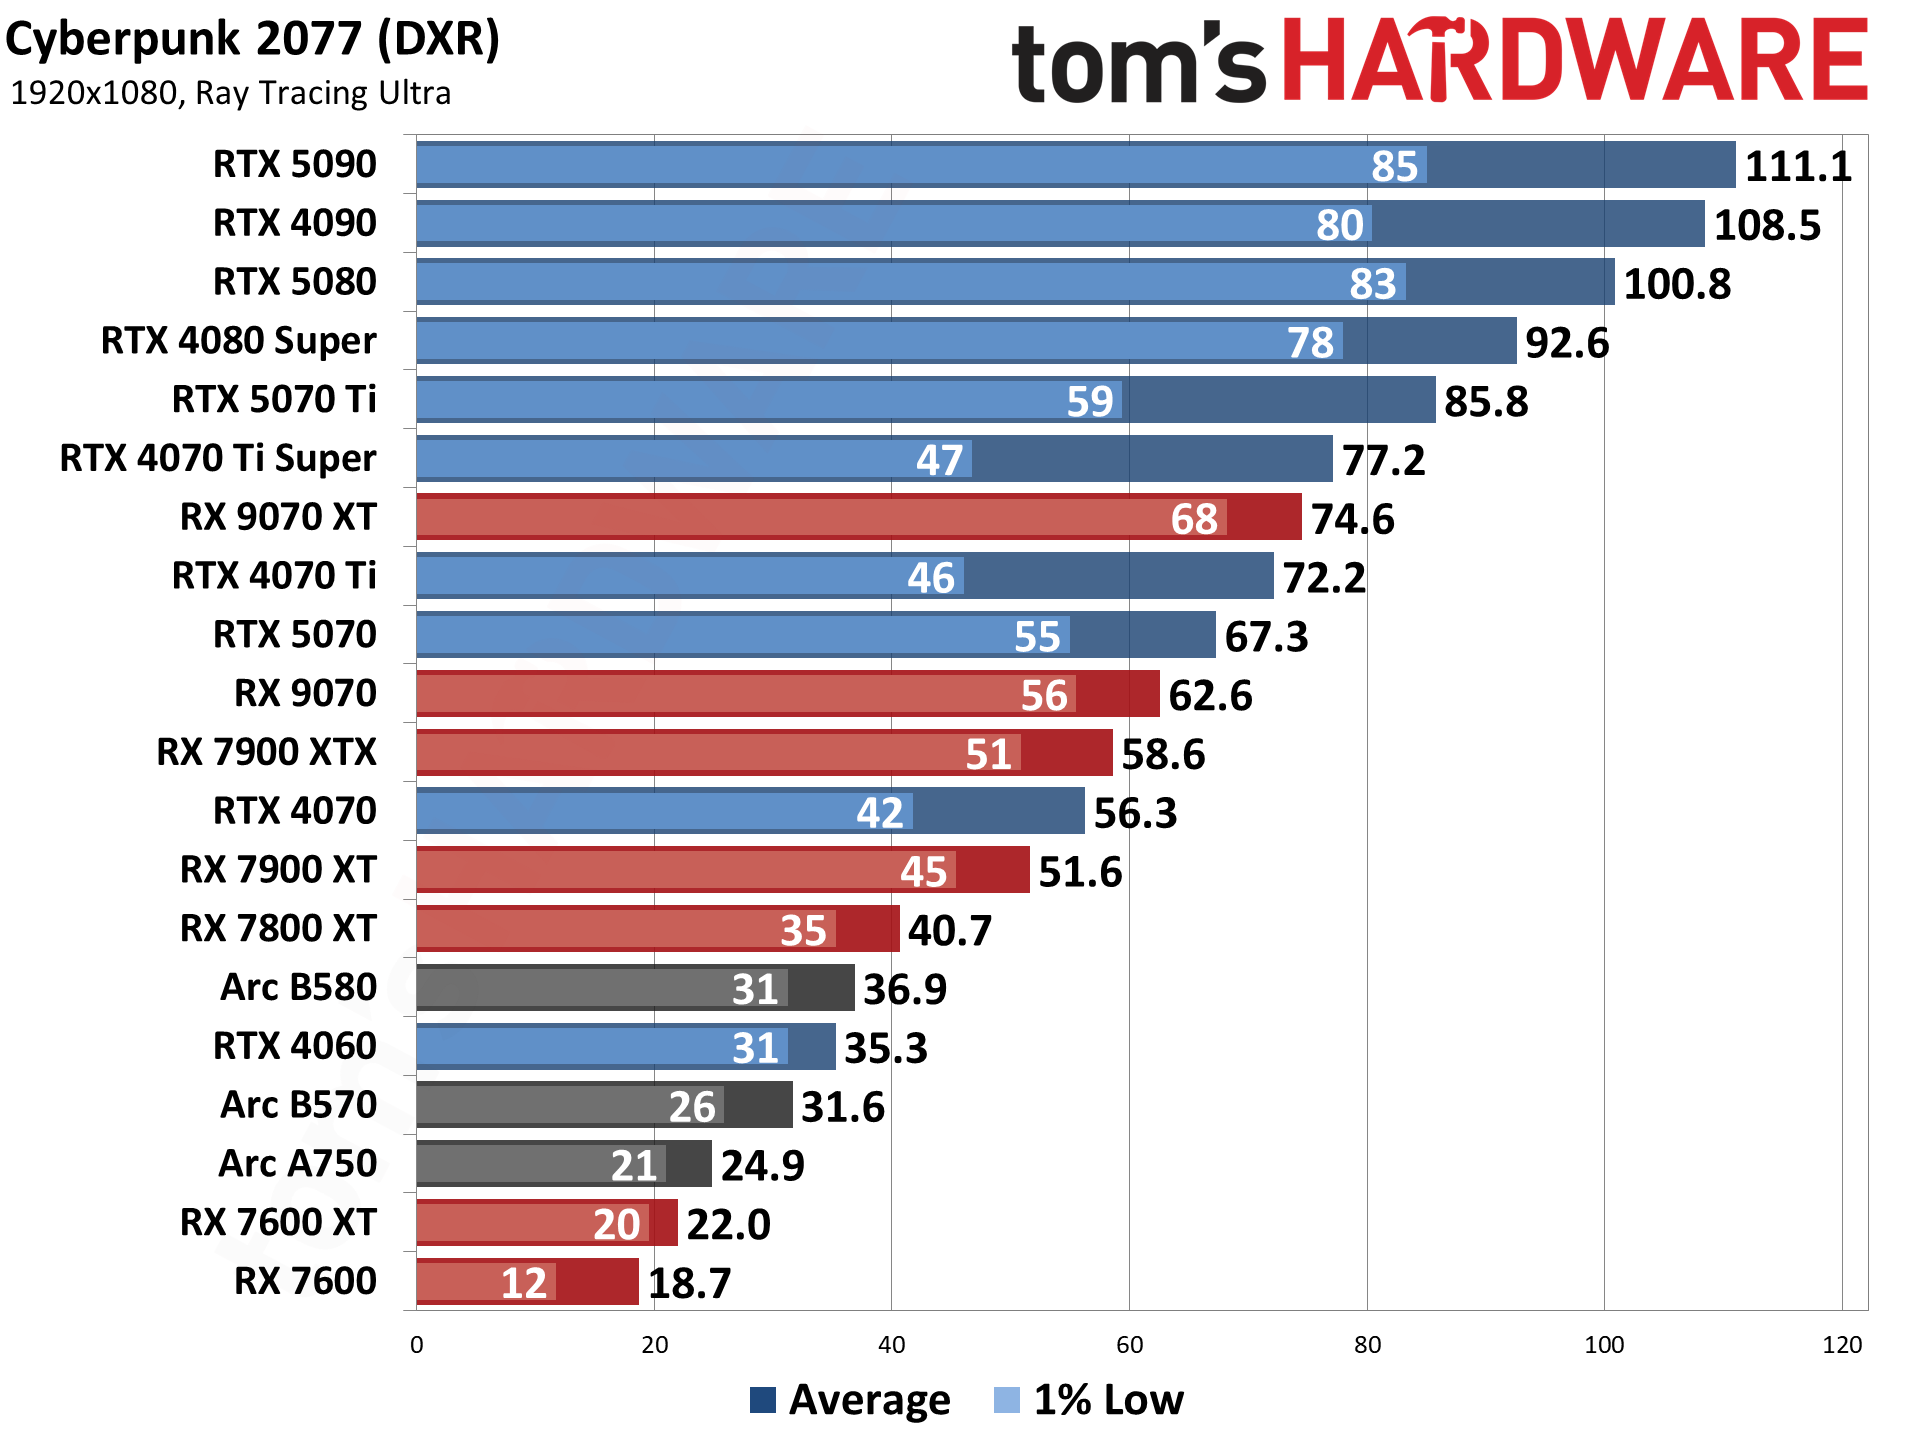
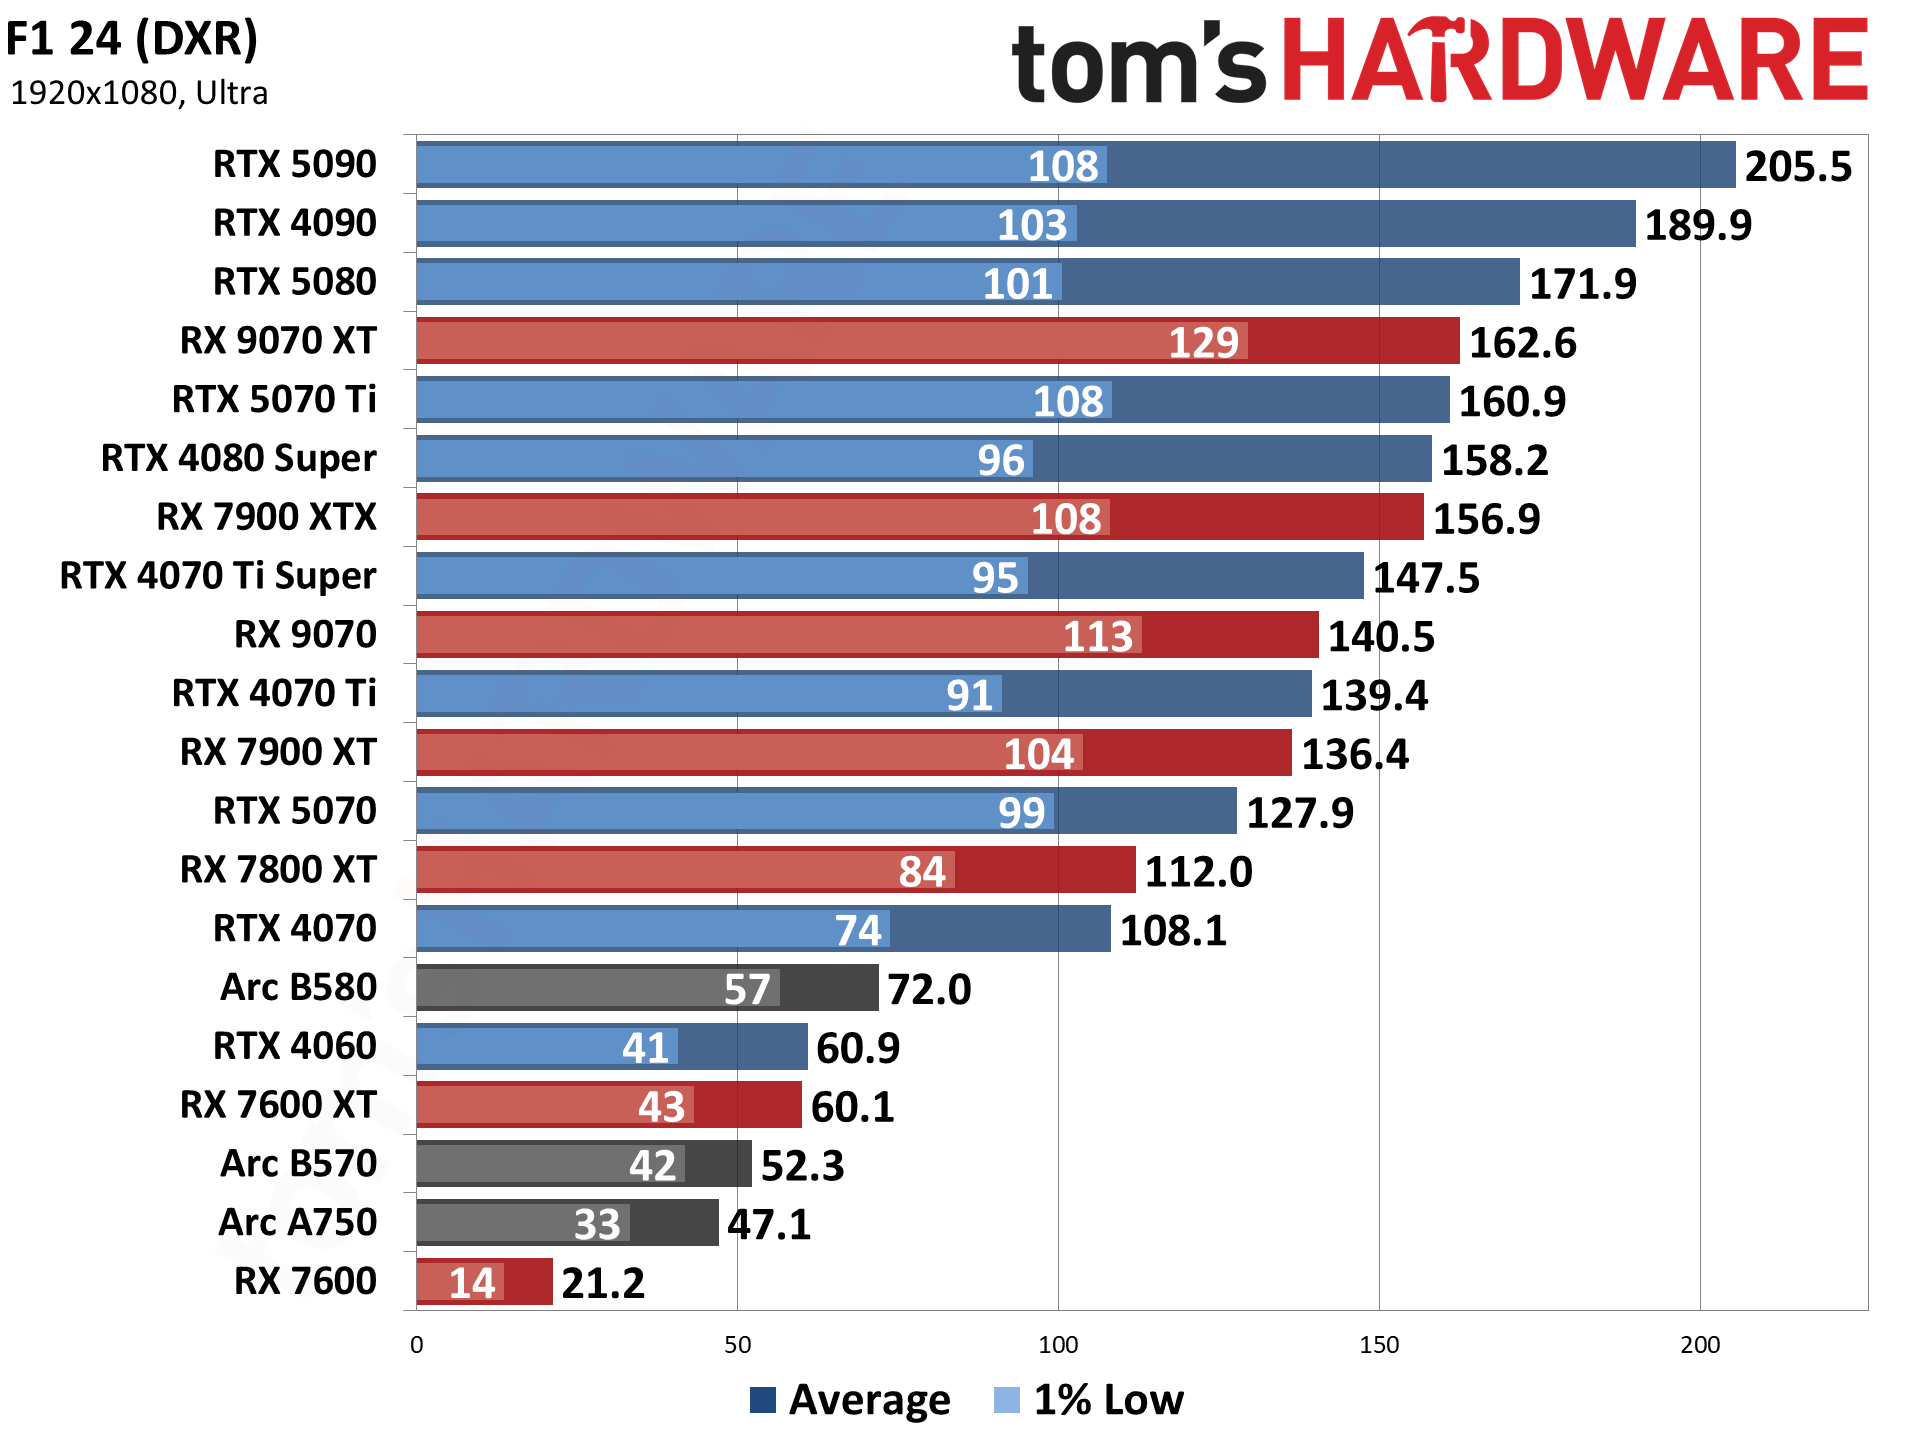
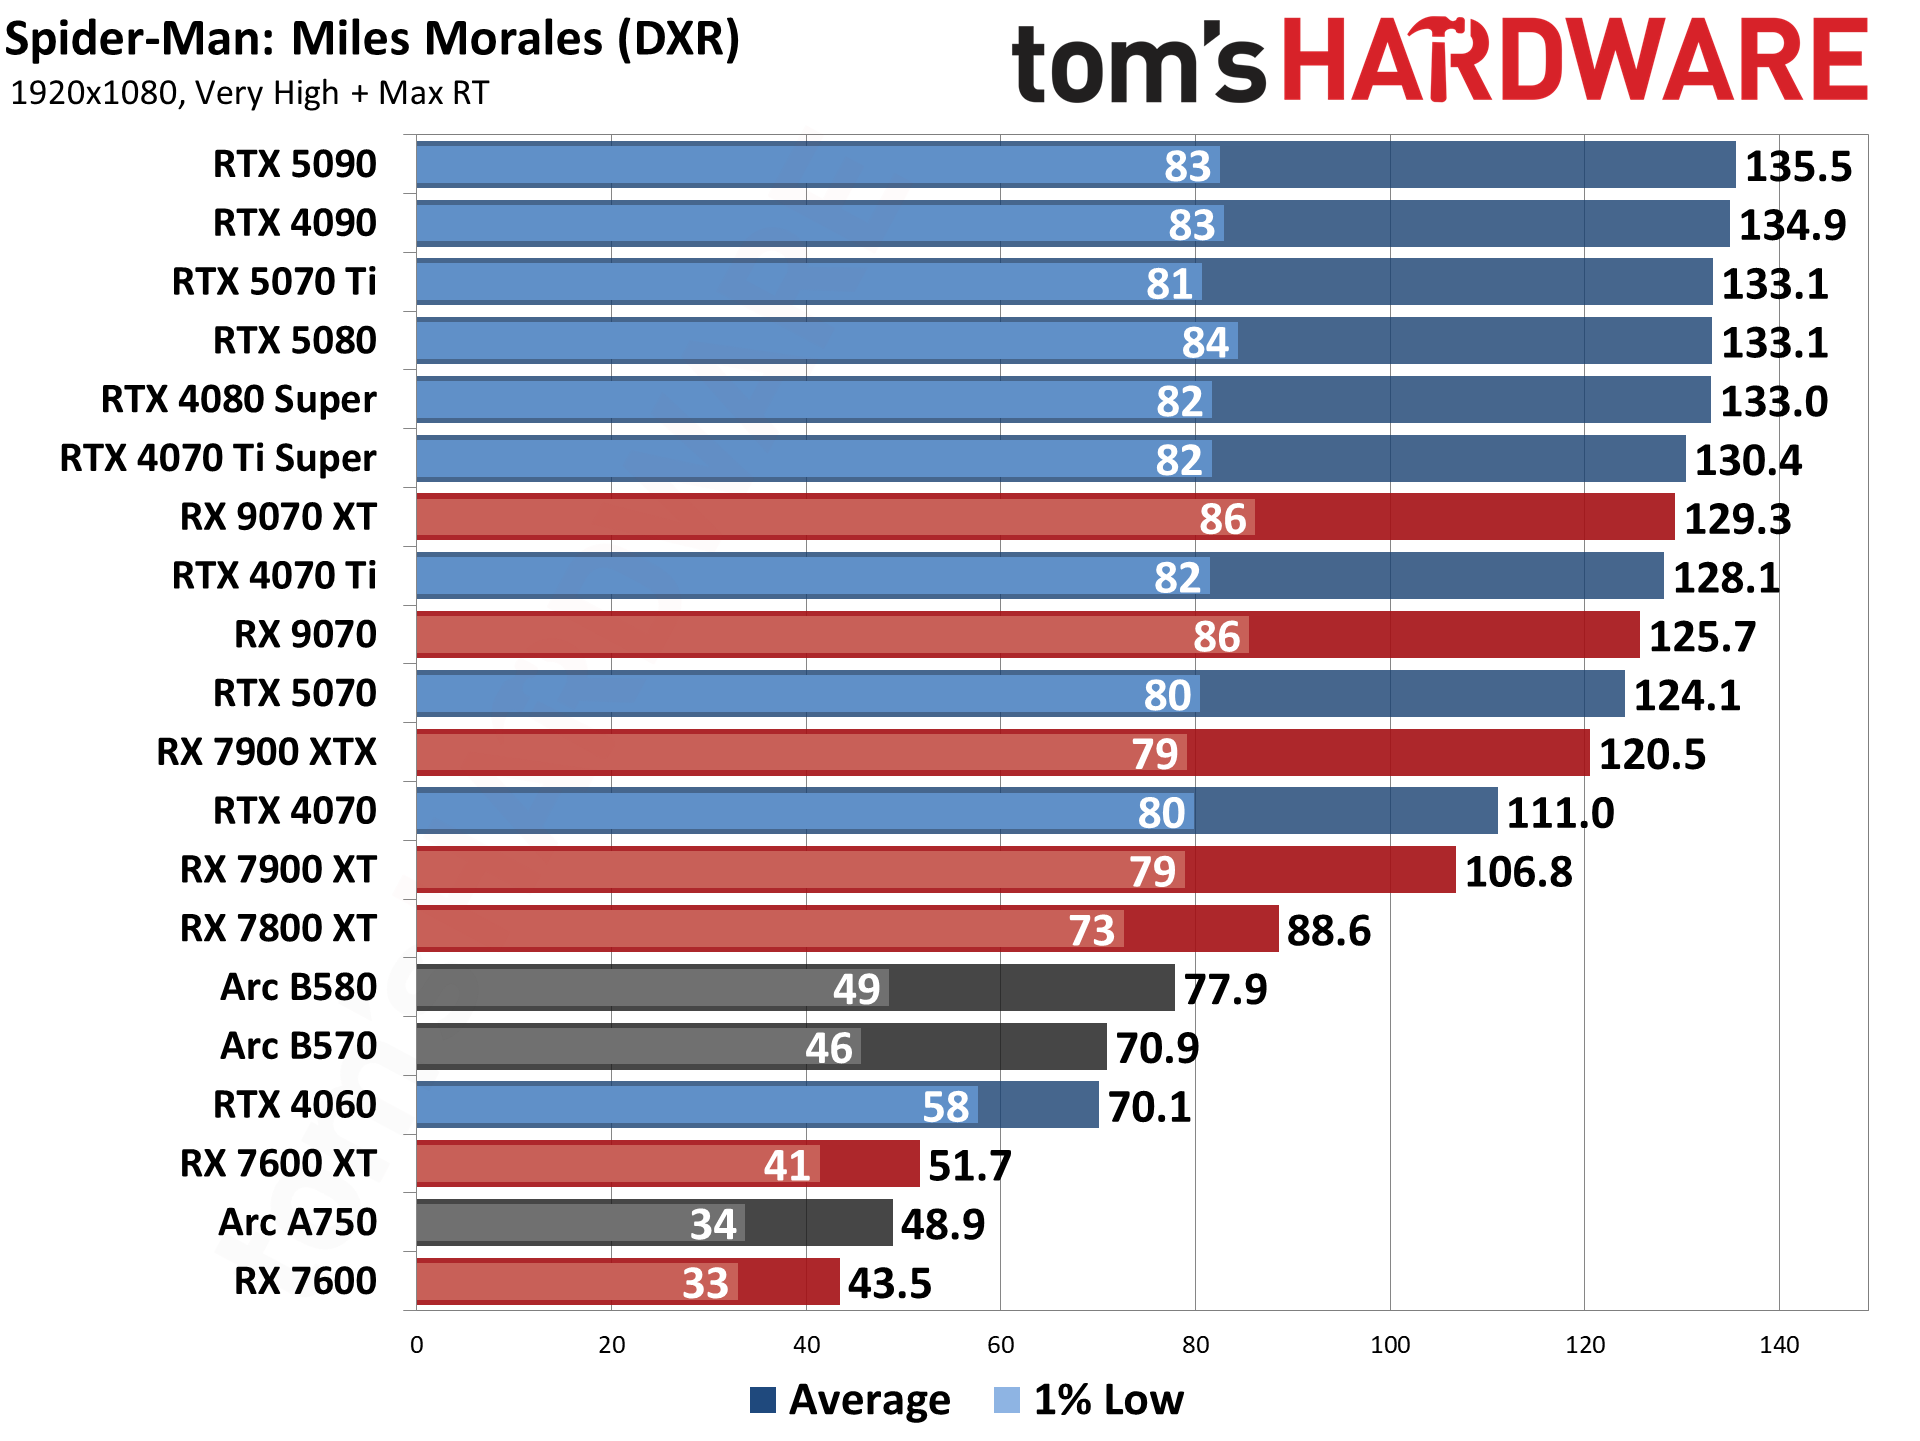
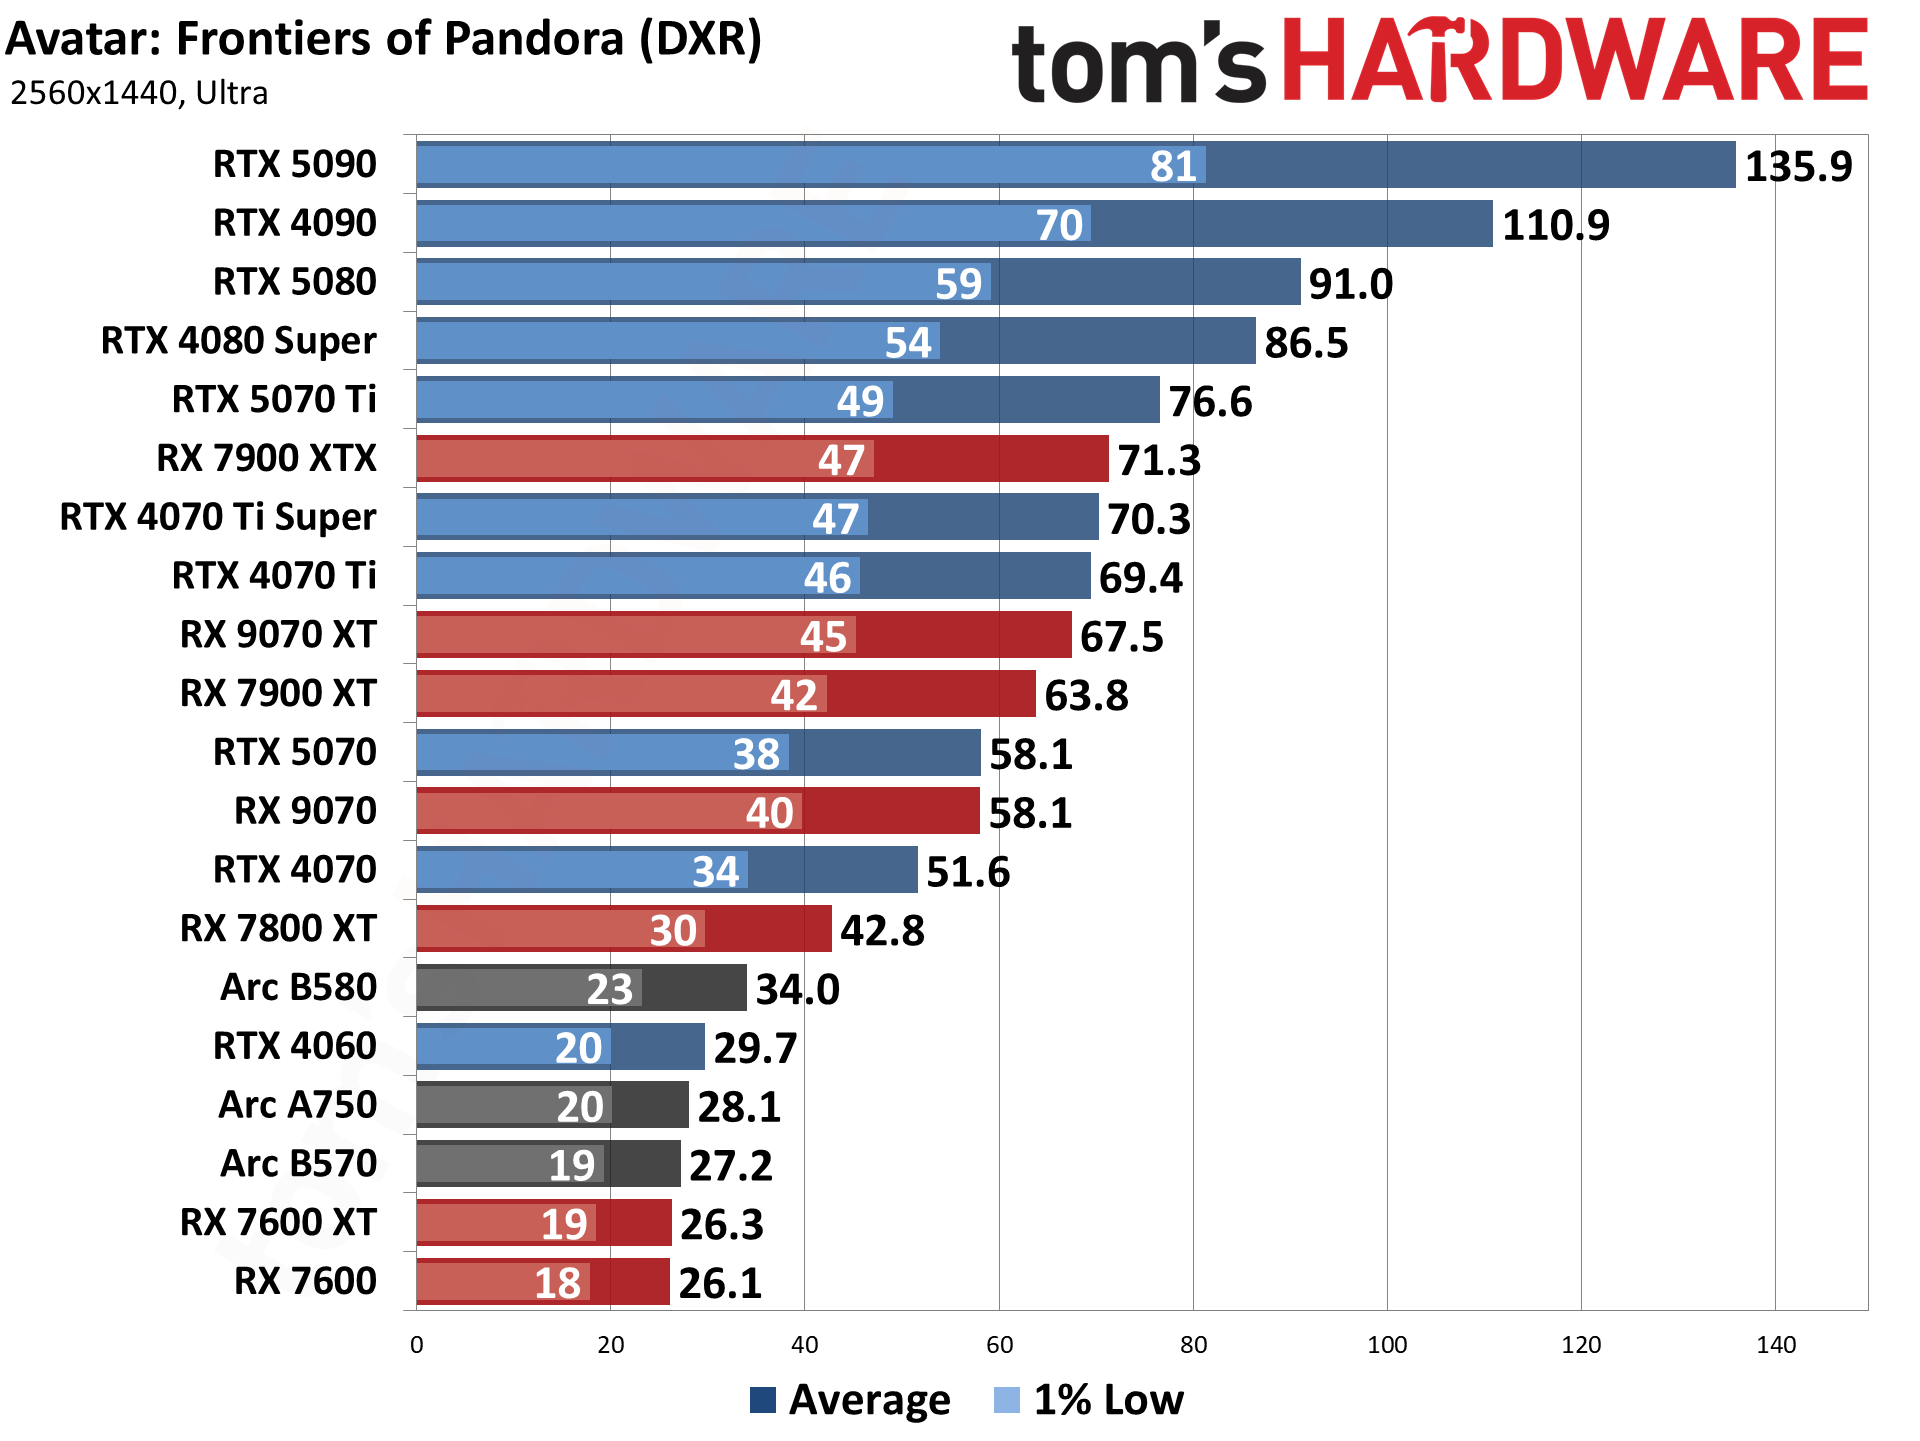
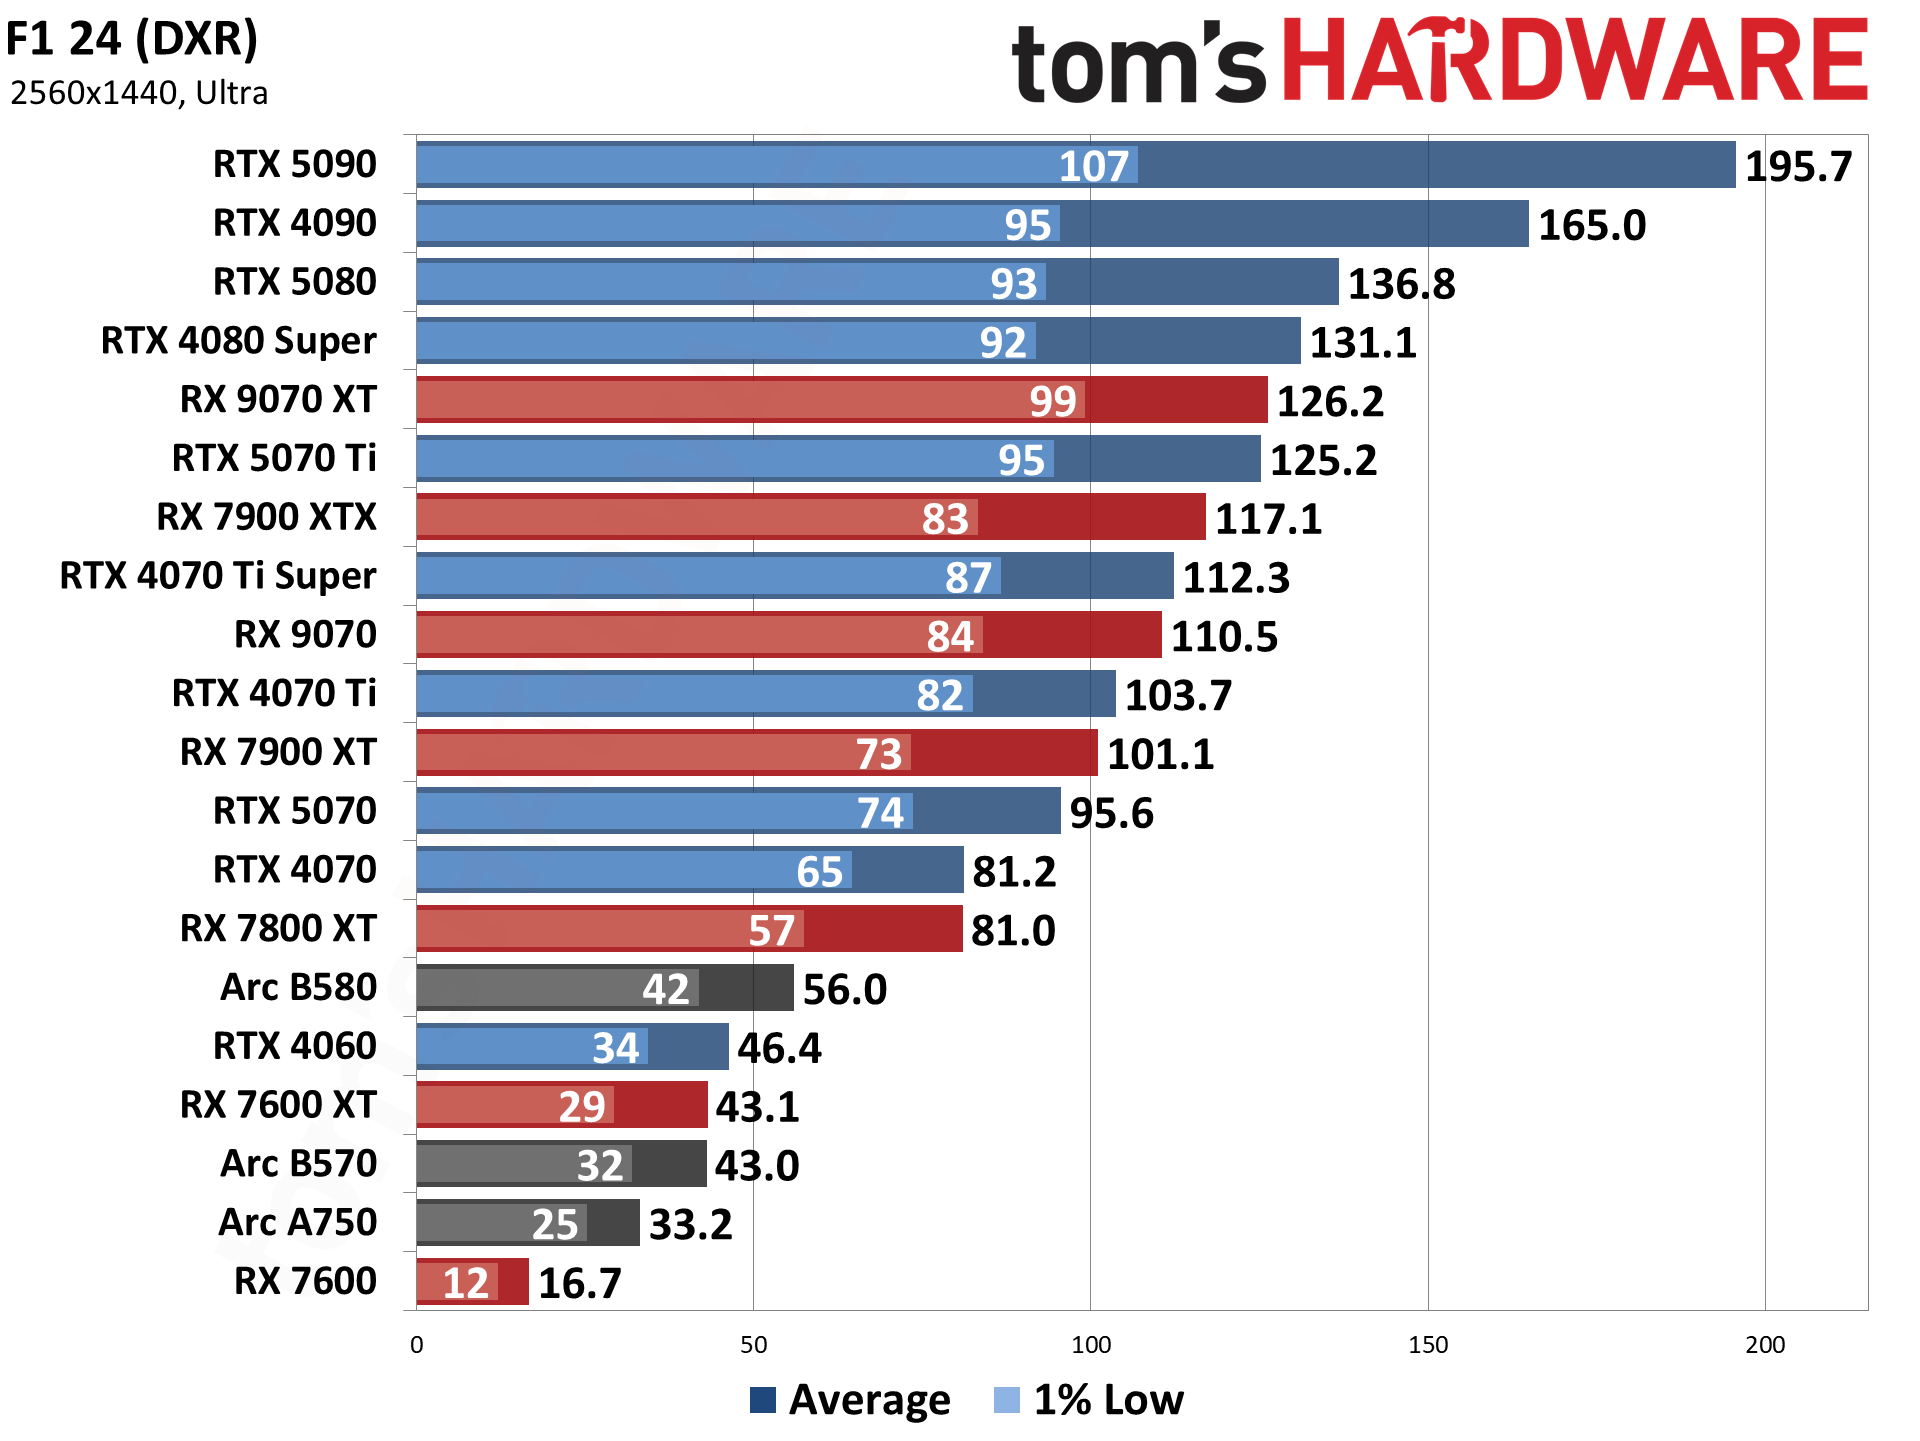
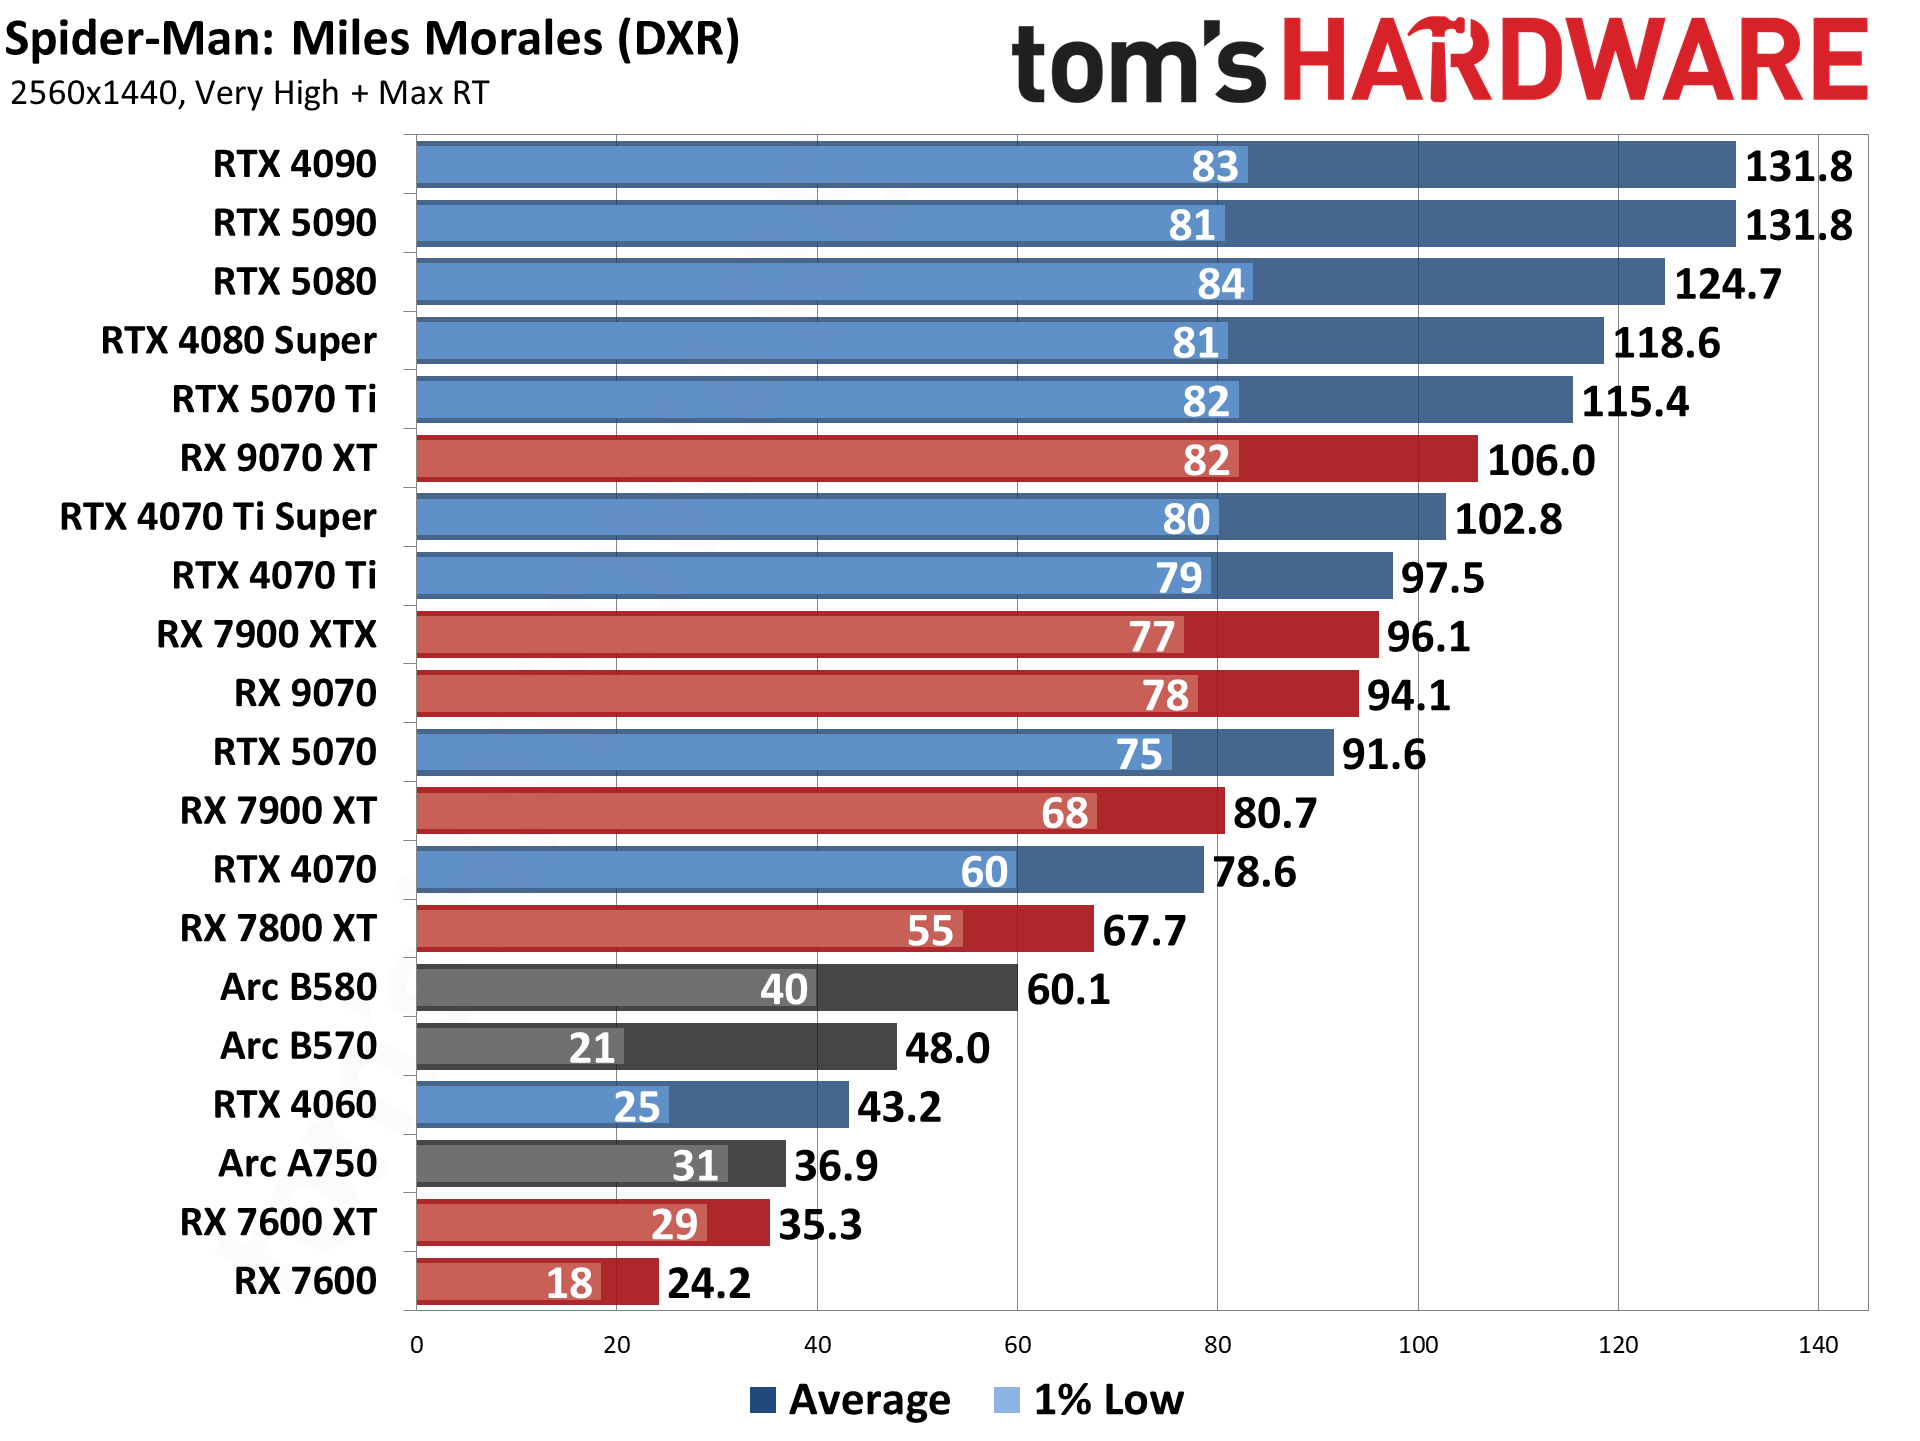
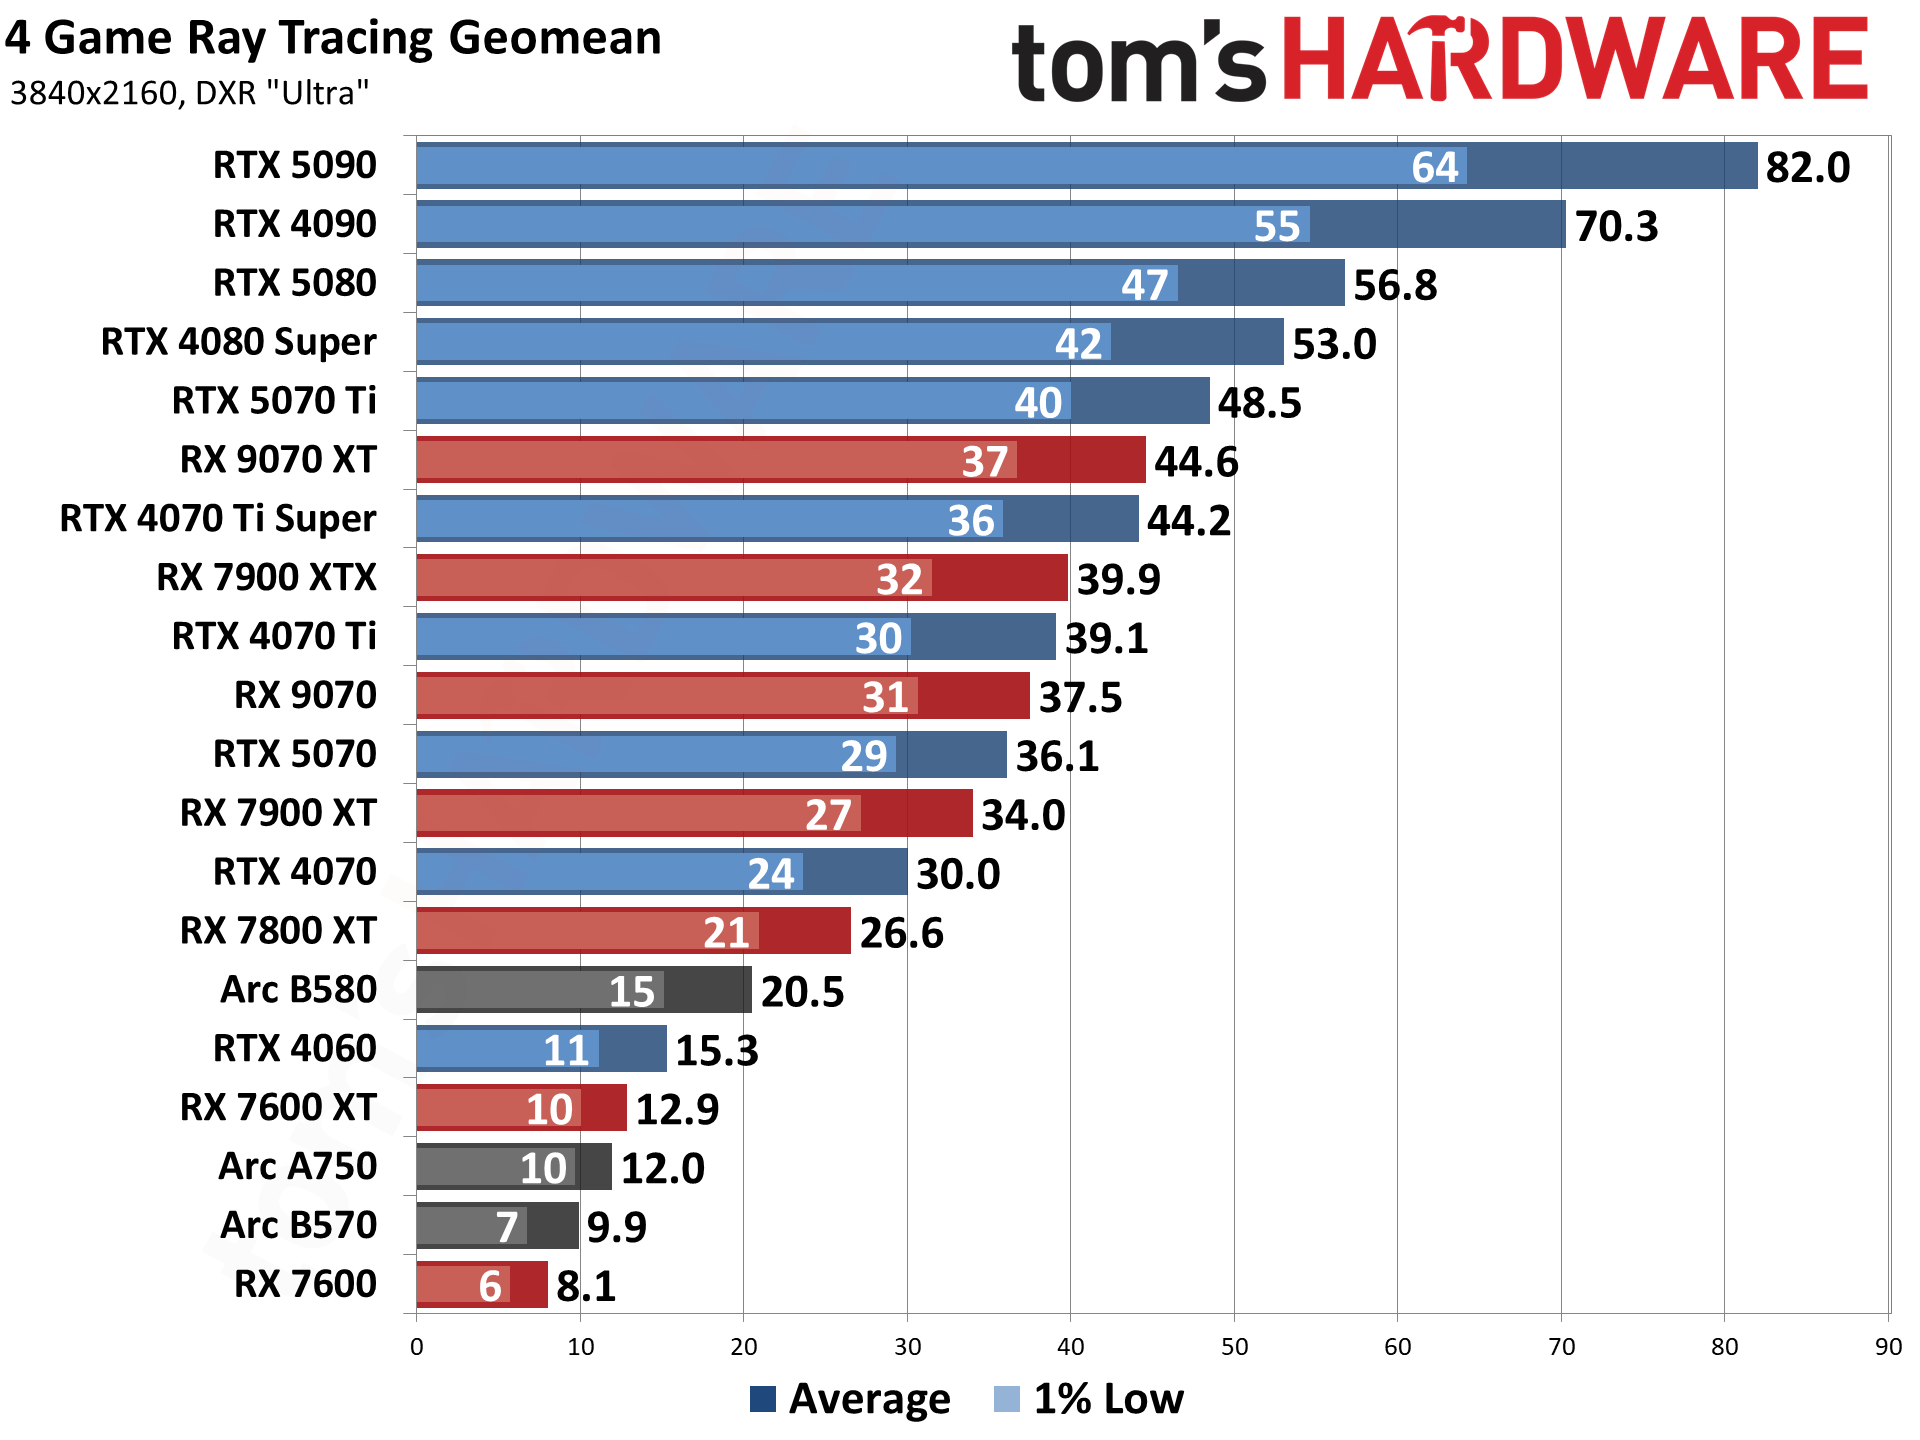
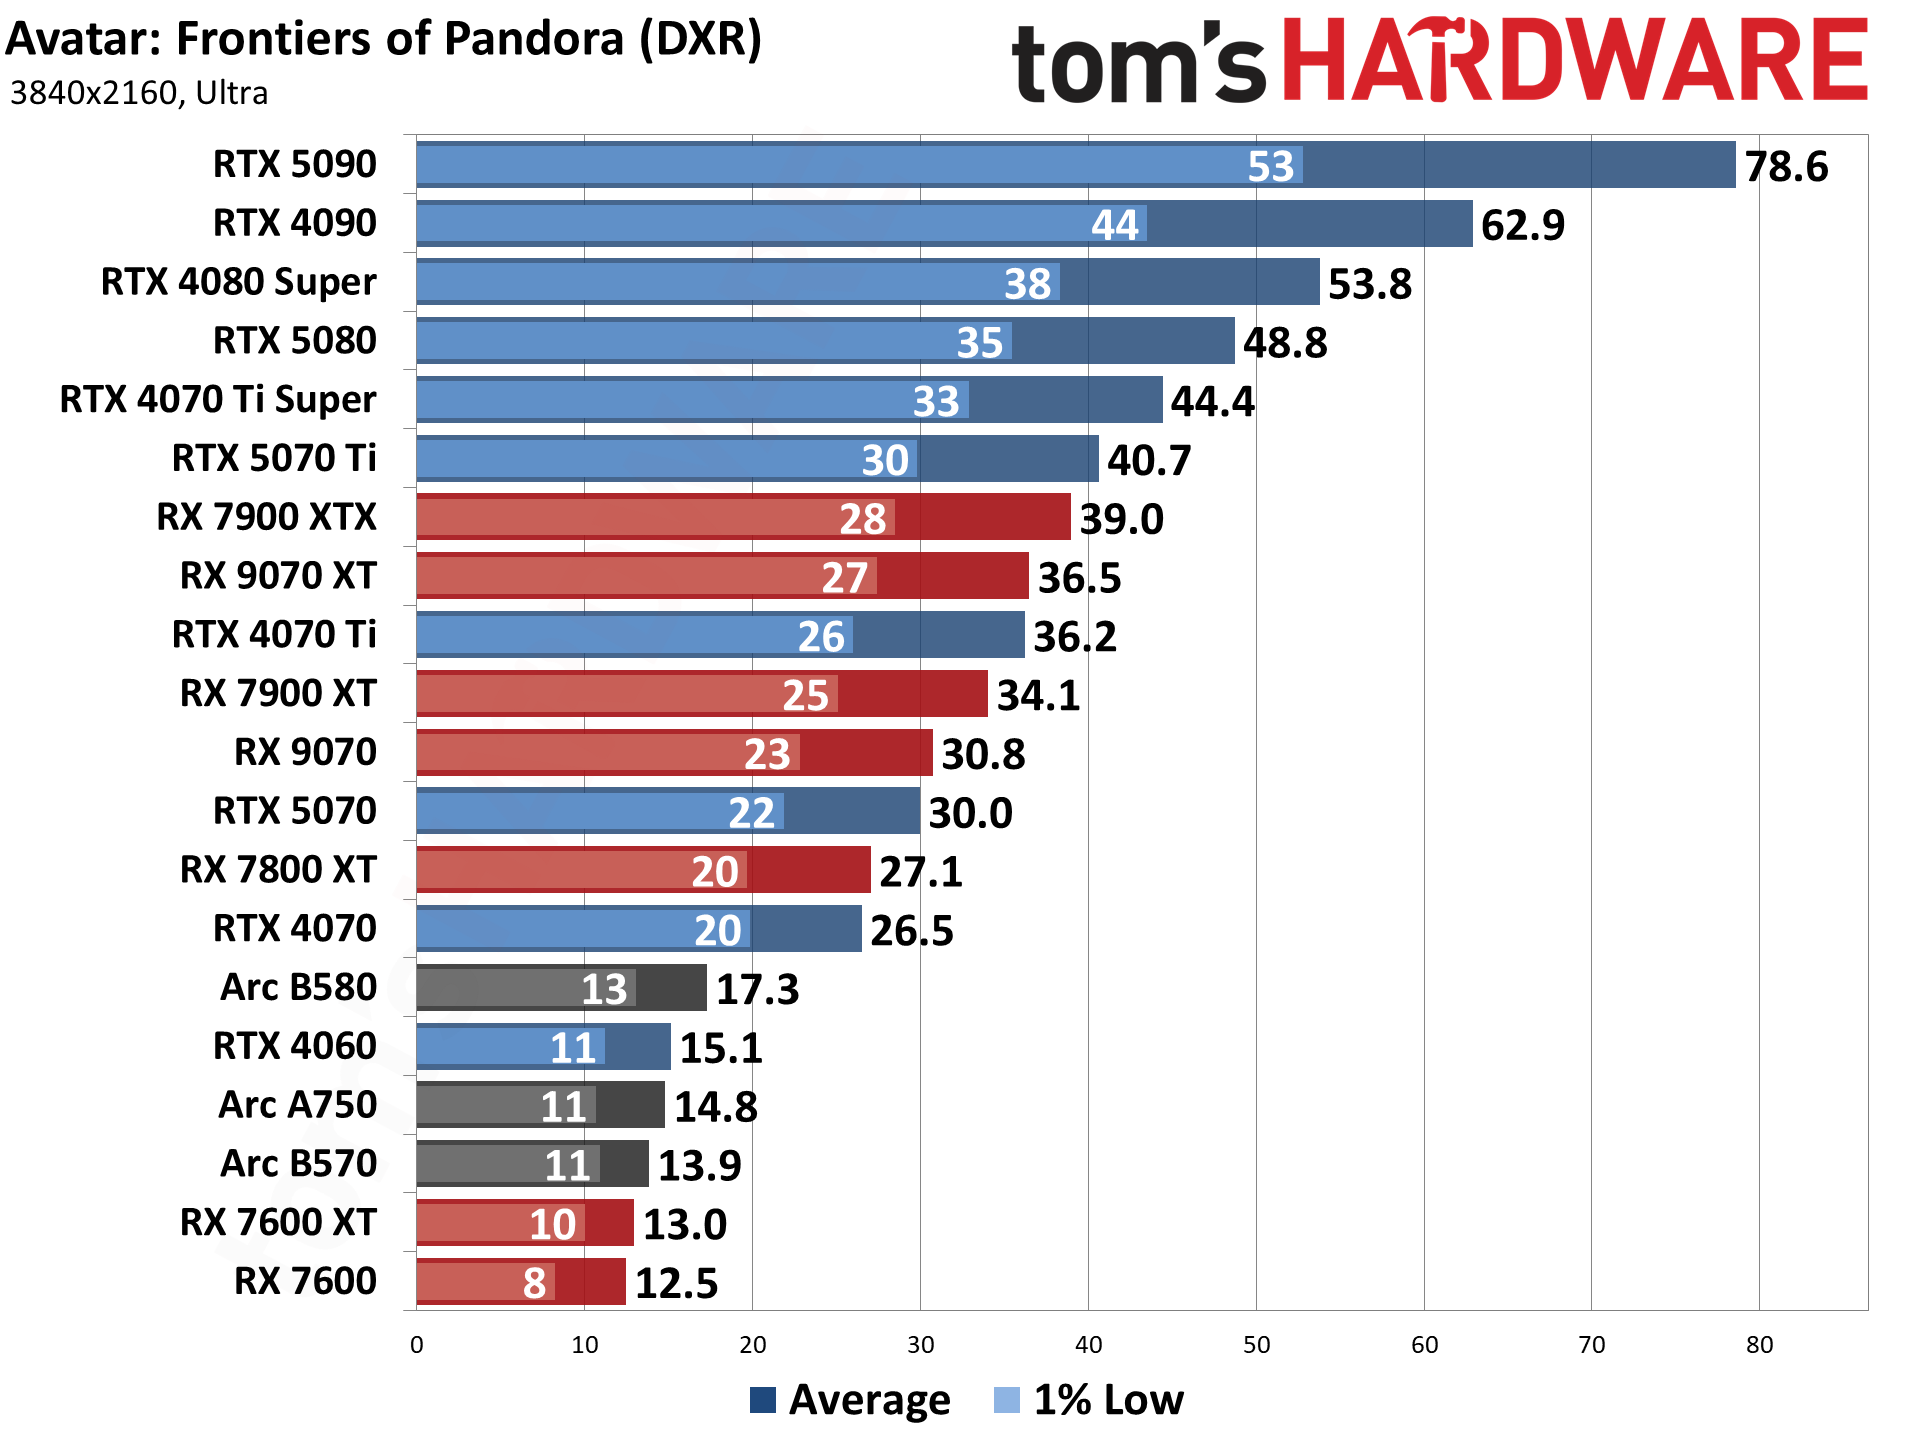
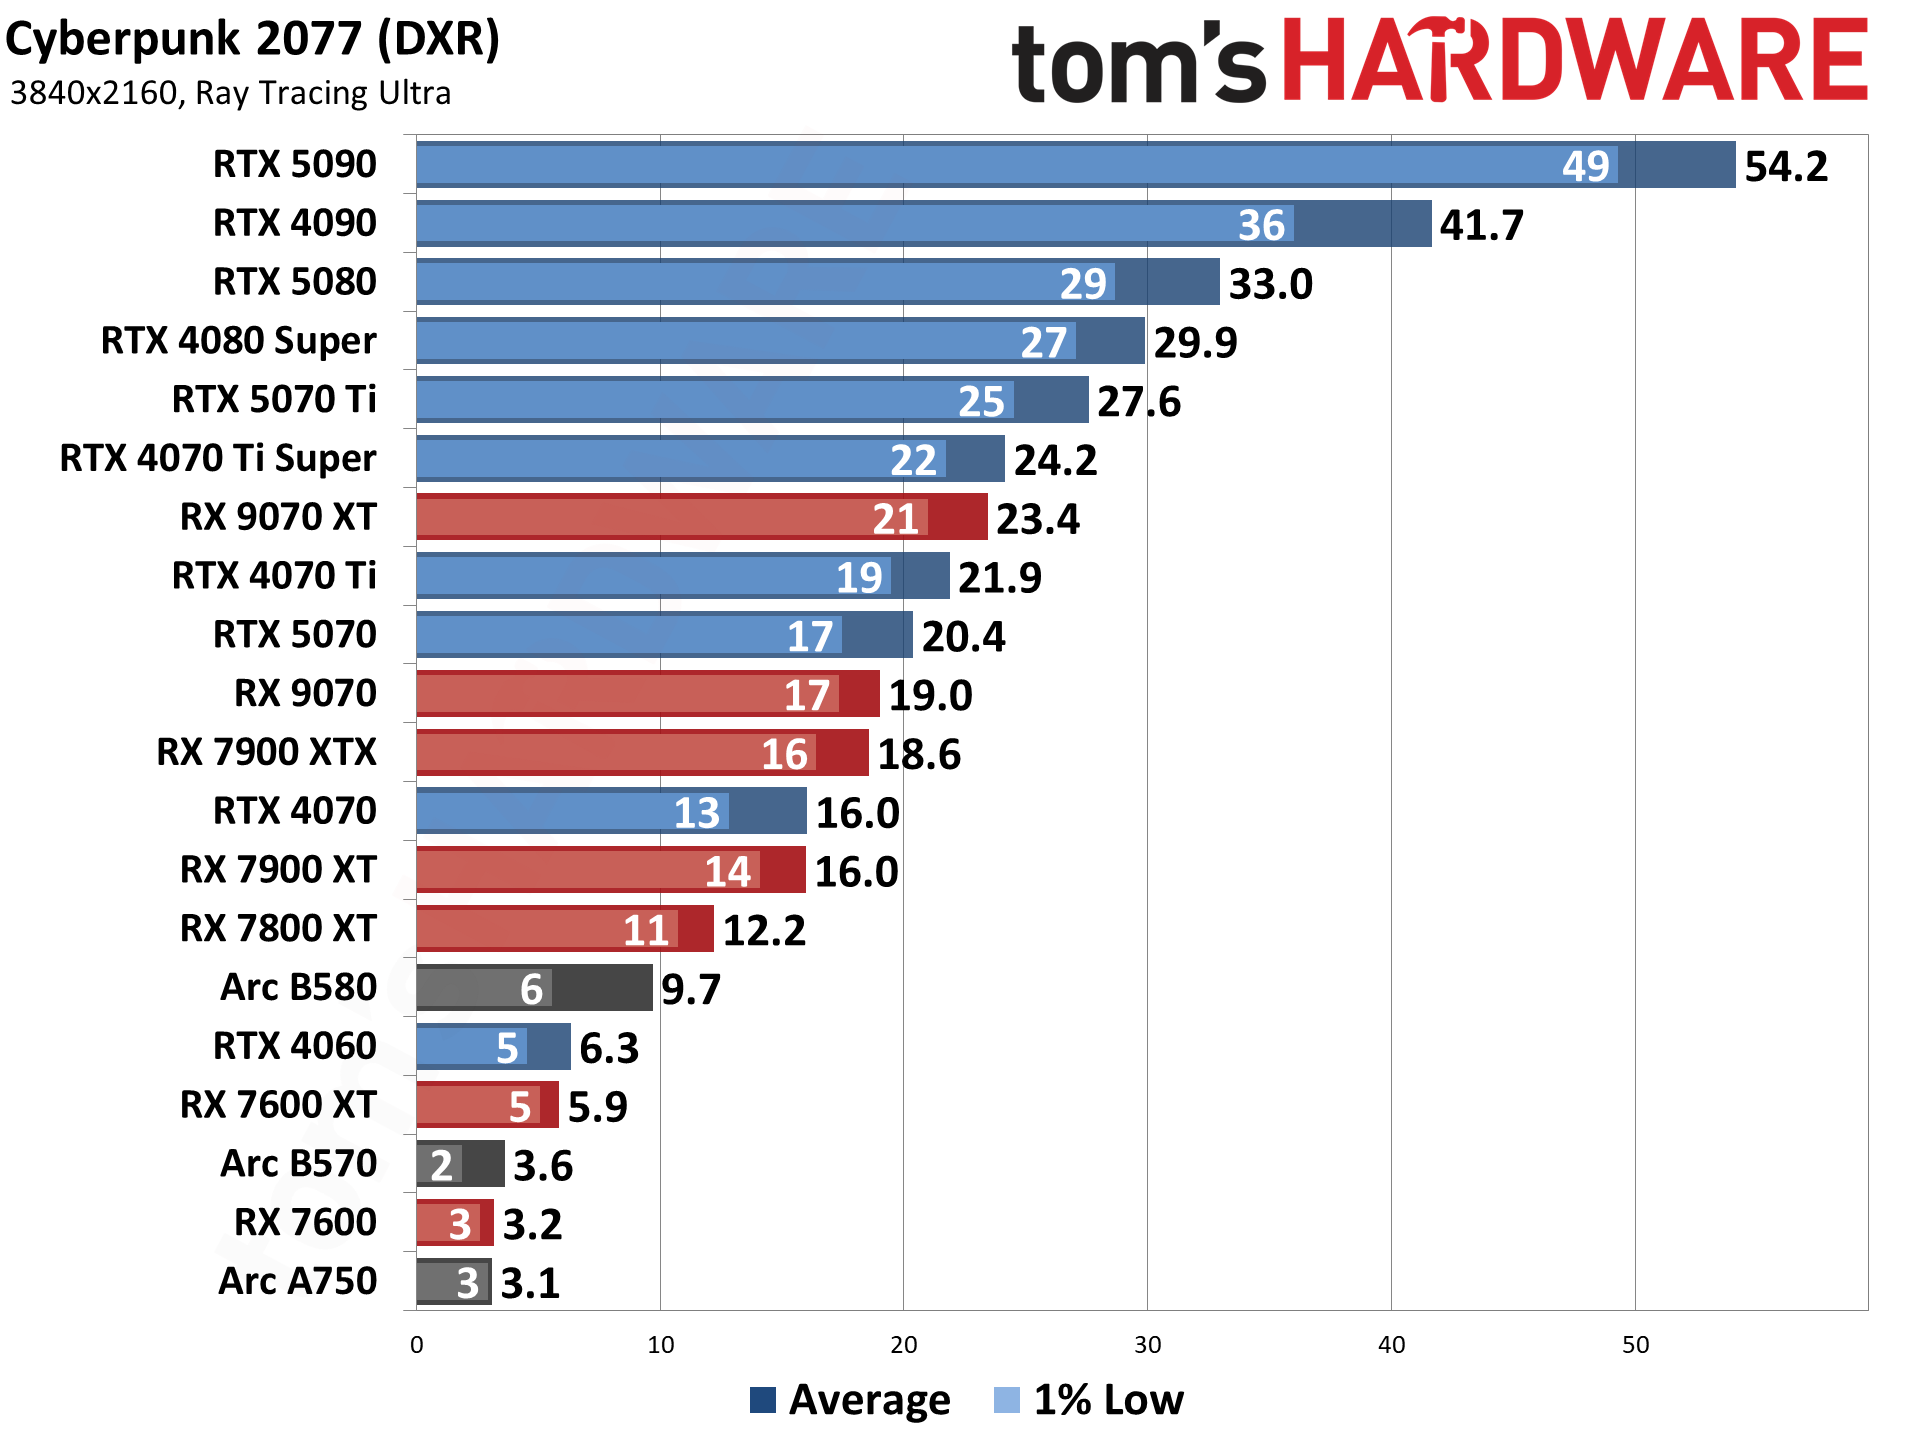
The four ray tracing games we’re using right now are Avatar: Frontiers of Pandora (a lighter RT title), Cyberpunk 2077 (heavy RT), F1 24 (lighter RT), and Spider-Man: Miles Morales (moderate RT) — all of these use the DirectX 12 / DX12 Ultimate API. The fps score is the geometric mean (equal weighting) of the four games, and the percentage is scaled relative to the fastest GPU in the list, which again is the GeForce RTX 5090.
If you want to see what truly heavy amounts of ray tracing can do, check out our Alan Wake 2 benchmarks where the full path tracing barely manages playable performance even with upscaling on non-Nvidia GPUs. However, and this is a critical point, the number of games where RT truly makes a striking difference in visuals is extremely limited. For most games, we still feel running pure rasterization rendering makes more sense.
| Graphics Card | Lowest Price (MSRP) | 1080p Medium | 1080p Ultra | 1440p Ultra | 4K Ultra | Specifications (Links to Review) |
|---|---|---|---|---|---|---|
| GeForce RTX 5090 | $3,999 ($2,000) | 100.0% (200.3) | 100.0% (154.6) | 100.0% (137.7) | 100.0% (89.6) | GB202, 21760 shaders, 2407MHz, 32GB GDDR7@28Gbps, 1792GB/s, 575W |
| GeForce RTX 4090 | $2,875 ($1,600) | 91.9% (184.1) | 92.3% (142.7) | 85.5% (117.7) | 78.8% (70.6) | AD102, 16384 shaders, 2520MHz, 24GB GDDR6X@21Gbps, 1008GB/s, 450W |
| GeForce RTX 5080 | $1,400 ($1,000) | 86.2% (172.6) | 84.9% (131.2) | 73.0% (100.5) | 63.7% (57.0) | GB203, 10752 shaders, 2617MHz, 16GB GDDR7@30Gbps, 690GB/s, 360W |
| GeForce RTX 4080 Super | $1,600 ($1,000) | 83.2% (166.6) | 80.5% (124.4) | 68.5% (94.3) | 60.7% (54.4) | AD103, 10240 shaders, 2550MHz, 16GB GDDR6X@23Gbps, 736GB/s, 320W |
| GeForce RTX 5070 Ti | $960 ($750) | 80.7% (161.6) | 77.9% (120.4) | 64.3% (88.5) | 54.5% (48.8) | GB203, 8960 shaders, 2452MHz, 16GB GDDR7@28Gbps, 896GB/s, 300W |
| GeForce RTX 4070 Ti Super | $1,096 ($800) | 76.7% (153.5) | 72.3% (111.8) | 57.7% (79.5) | 50.4% (45.1) | AD103, 8448 shaders, 2610MHz, 16GB GDDR6X@21Gbps, 672GB/s, 285W |
| Radeon RX 9070 XT | $850 ($600) | 76.9% (154.0) | 72.0% (111.2) | 58.7% (80.9) | 50.0% (44.8) | Navi 48, 4096 shaders, 2970MHz, 16GB GDDR6@20Gbps, 640GB/s, 304W |
| GeForce RTX 4070 Ti | $1,096 ($800) | 75.0% (150.2) | 70.9% (109.6) | 56.0% (77.1) | 47.4% (42.5) | AD104, 7680 shaders, 2610MHz, 12GB GDDR6X@21Gbps, 504GB/s, 285W |
| GeForce RTX 5070 | $600 ($550) | 74.7% (149.6) | 70.3% (108.7) | 56.3% (77.5) | 47.1% (42.2) | GB205, 6144 shaders, 2512MHz, 12GB GDDR7@28Gbps, 672GB/s, 250W |
| Radeon RX 9070 | $670 ($550) | 73.2% (146.6) | 67.7% (104.7) | 54.6% (75.2) | 45.9% (41.1) | Navi 48, 3584 shaders, 2520MHz, 16GB GDDR6@20Gbps, 640GB/s, 220W |
| Radeon RX 7900 XTX | $1,270 ($1,000) | 70.0% (140.2) | 66.4% (102.6) | 54.0% (74.3) | 44.9% (40.2) | Navi 31, 6144 shaders, 2500MHz, 24GB GDDR6@20Gbps, 960GB/s, 355W |
| GeForce RTX 4070 | $734 ($550) | 70.5% (141.2) | 65.1% (100.7) | 50.9% (70.1) | 42.4% (38.0) | AD104, 5888 shaders, 2475MHz, 12GB GDDR6X@21Gbps, 504GB/s, 200W |
| Radeon RX 7900 XT | $894 ($750) | 67.7% (135.6) | 62.7% (96.9) | 50.2% (69.1) | 41.5% (37.2) | Navi 31, 5376 shaders, 2400MHz, 20GB GDDR6@20Gbps, 800GB/s, 315W |
| Radeon RX 7800 XT | $590 ($500) | 53.5% (107.1) | 46.0% (71.0) | 35.7% (49.2) | 30.2% (27.0) | Navi 32, 3840 shaders, 2430MHz, 16GB [email protected], 624GB/s, 263W |
| Intel Arc B580 | $341 ($250) | 39.6% (79.3) | 36.9% (57.0) | 29.3% (40.3) | 22.9% (20.5) | BMG-G21, 2560 shaders, 2850MHz, 12GB GDDR6@19Gbps, 456GB/s, 190W |
| Intel Arc A770 16GB | $439 ($330) | 32.4% (64.9) | 29.2% (45.1) | 23.6% (32.5) | 19.4% (17.3) | ACM-G10, 4096 shaders, 2400MHz, 16GB [email protected], 560GB/s, 225W |
| GeForce RTX 4060 | $320 ($300) | 40.6% (81.3) | 33.2% (51.3) | 23.6% (32.5) | 16.7% (15.0) | AD107, 3072 shaders, 2460MHz, 8GB GDDR6@17Gbps, 272GB/s, 115W |
| Radeon RX 7600 XT | $420 ($330) | 32.1% (64.3) | 26.2% (40.6) | 19.6% (26.9) | 14.8% (13.3) | Navi 33, 2048 shaders, 2755MHz, 16GB GDDR6@18Gbps, 288GB/s, 190W |
| Intel Arc A750 | $200 ($200) | 29.2% (58.5) | 25.0% (38.7) | 19.1% (26.3) | 12.1% (10.8) | ACM-G10, 3584 shaders, 2350MHz, 8GB GDDR6@16Gbps, 512GB/s, 225W |
| Radeon RX 7600 | $260 ($270) | 31.2% (62.4) | 22.1% (34.2) | 15.2% (20.9) | 11.6% (10.4) | Navi 33, 2048 shaders, 2655MHz, 8GB GDDR6@18Gbps, 288GB/s, 165W |
| Intel Arc B570 | $296 ($220) | 34.7% (69.4) | 30.3% (46.9) | 23.9% (32.9) | 9.6% (8.6) | BMG-G21, 2304 shaders, 2750MHz, 10GB GDDR6@19Gbps, 380GB/s, 150W |
There’s not much of a gap between the RTX 5090 and RTX 4090 at 1080p, but the newer card does put some distance between itself and second place at higher resolutions.
Test System and How We Test for GPU Benchmarks
We’ve used a few different PCs for our testing over the years. The latest 2025 update switches to an AMD Zen 5 X3D processor, the Ryzen 7 9800X3D. Here are the specifications for our latest GPU test PC.
Tom’s Hardware 2025 GPU Testbed
AMD Ryzen 7 9800X3D
ASRock X670E Taichi
Corsair 2x16GB DDR5-6000 CL30
Crucial T700 4TB
Corsair HX1500i Platinum
Cooler Master MasterLiquid Pro 280 RGB
Windows 11 Pro 64-bit 24H2
For each graphics card, we follow the same testing procedure. We run one pass of each benchmark to “warm up” the GPU after launching the game, then run at least two passes at each setting/resolution combination. If the two runs are basically identical (within 0.5% or less difference), we use the faster of the two runs. If there’s more than a small difference, we run the test at least twice more to determine what “normal” performance is supposed to be.
We also look at all the data and check for anomalies, so for example RTX 5070 Ti should be faster than RTX 5070, unless we are CPU bottlenecked, in which case the two GPUs should be basically tied. If we see games where there are clear outliers (i.e. a ‘slower’ card outperforms a ‘faster’ card), we’ll go back and retest whatever cards are showing the anomaly and figure out what the “correct” result would be.
Due to the length of time required for testing each GPU, updated drivers and game patches inevitably will come out that can impact performance. We periodically retest a few sample cards to verify our results are still valid, and if not, we go through and retest the affected game(s) and GPU(s). We may also add games to our test suite over the coming year, if one comes out that is popular and conducive to testing — see our what makes a good game benchmark for our selection criteria.
GPU Benchmarks: Individual Game Charts
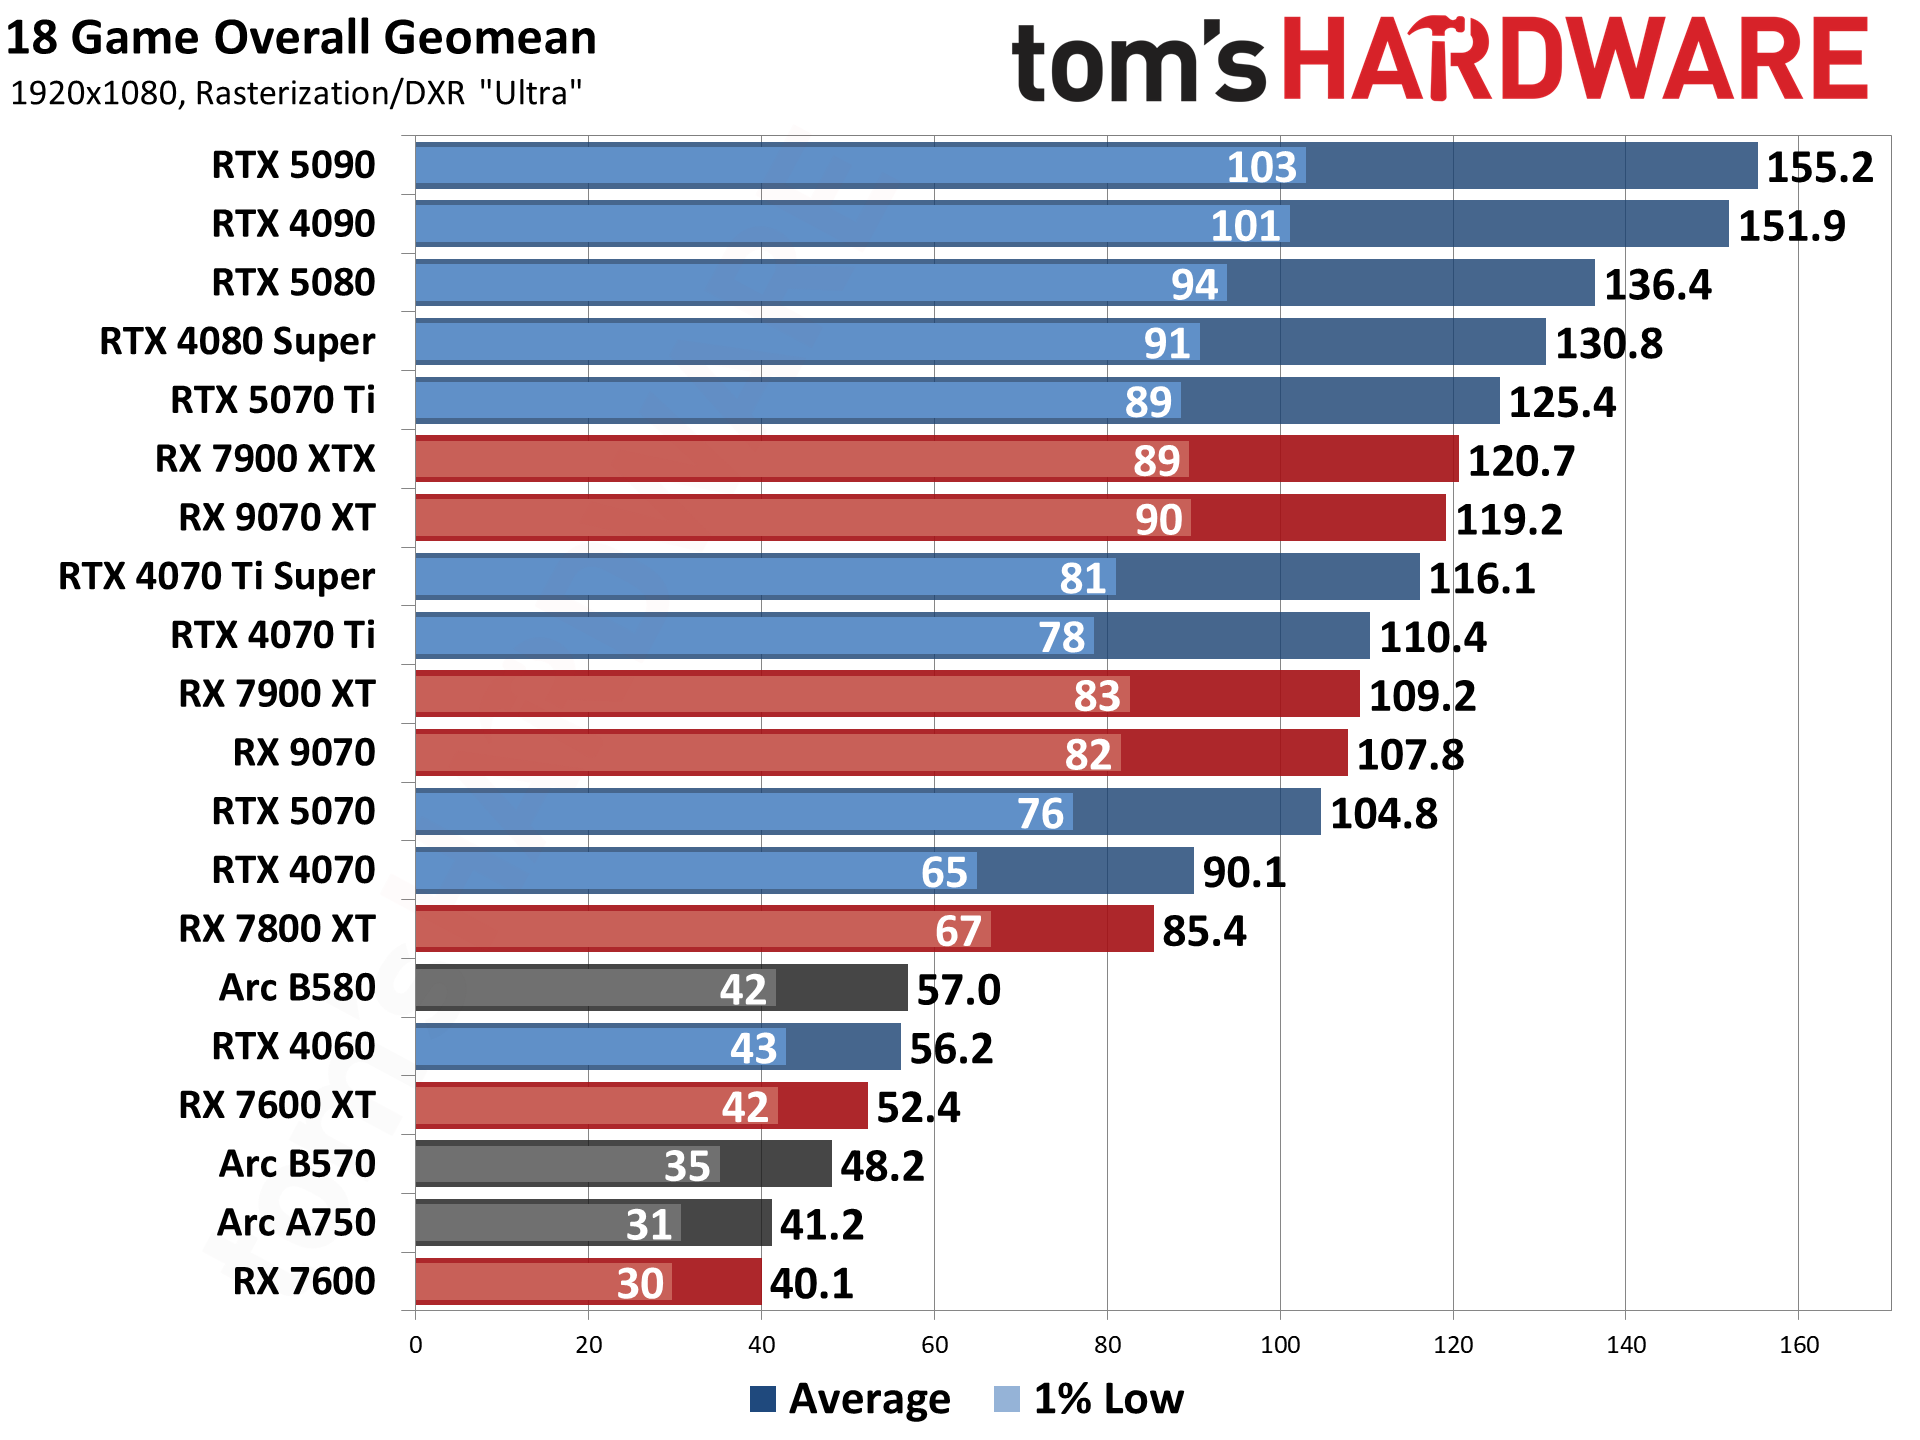
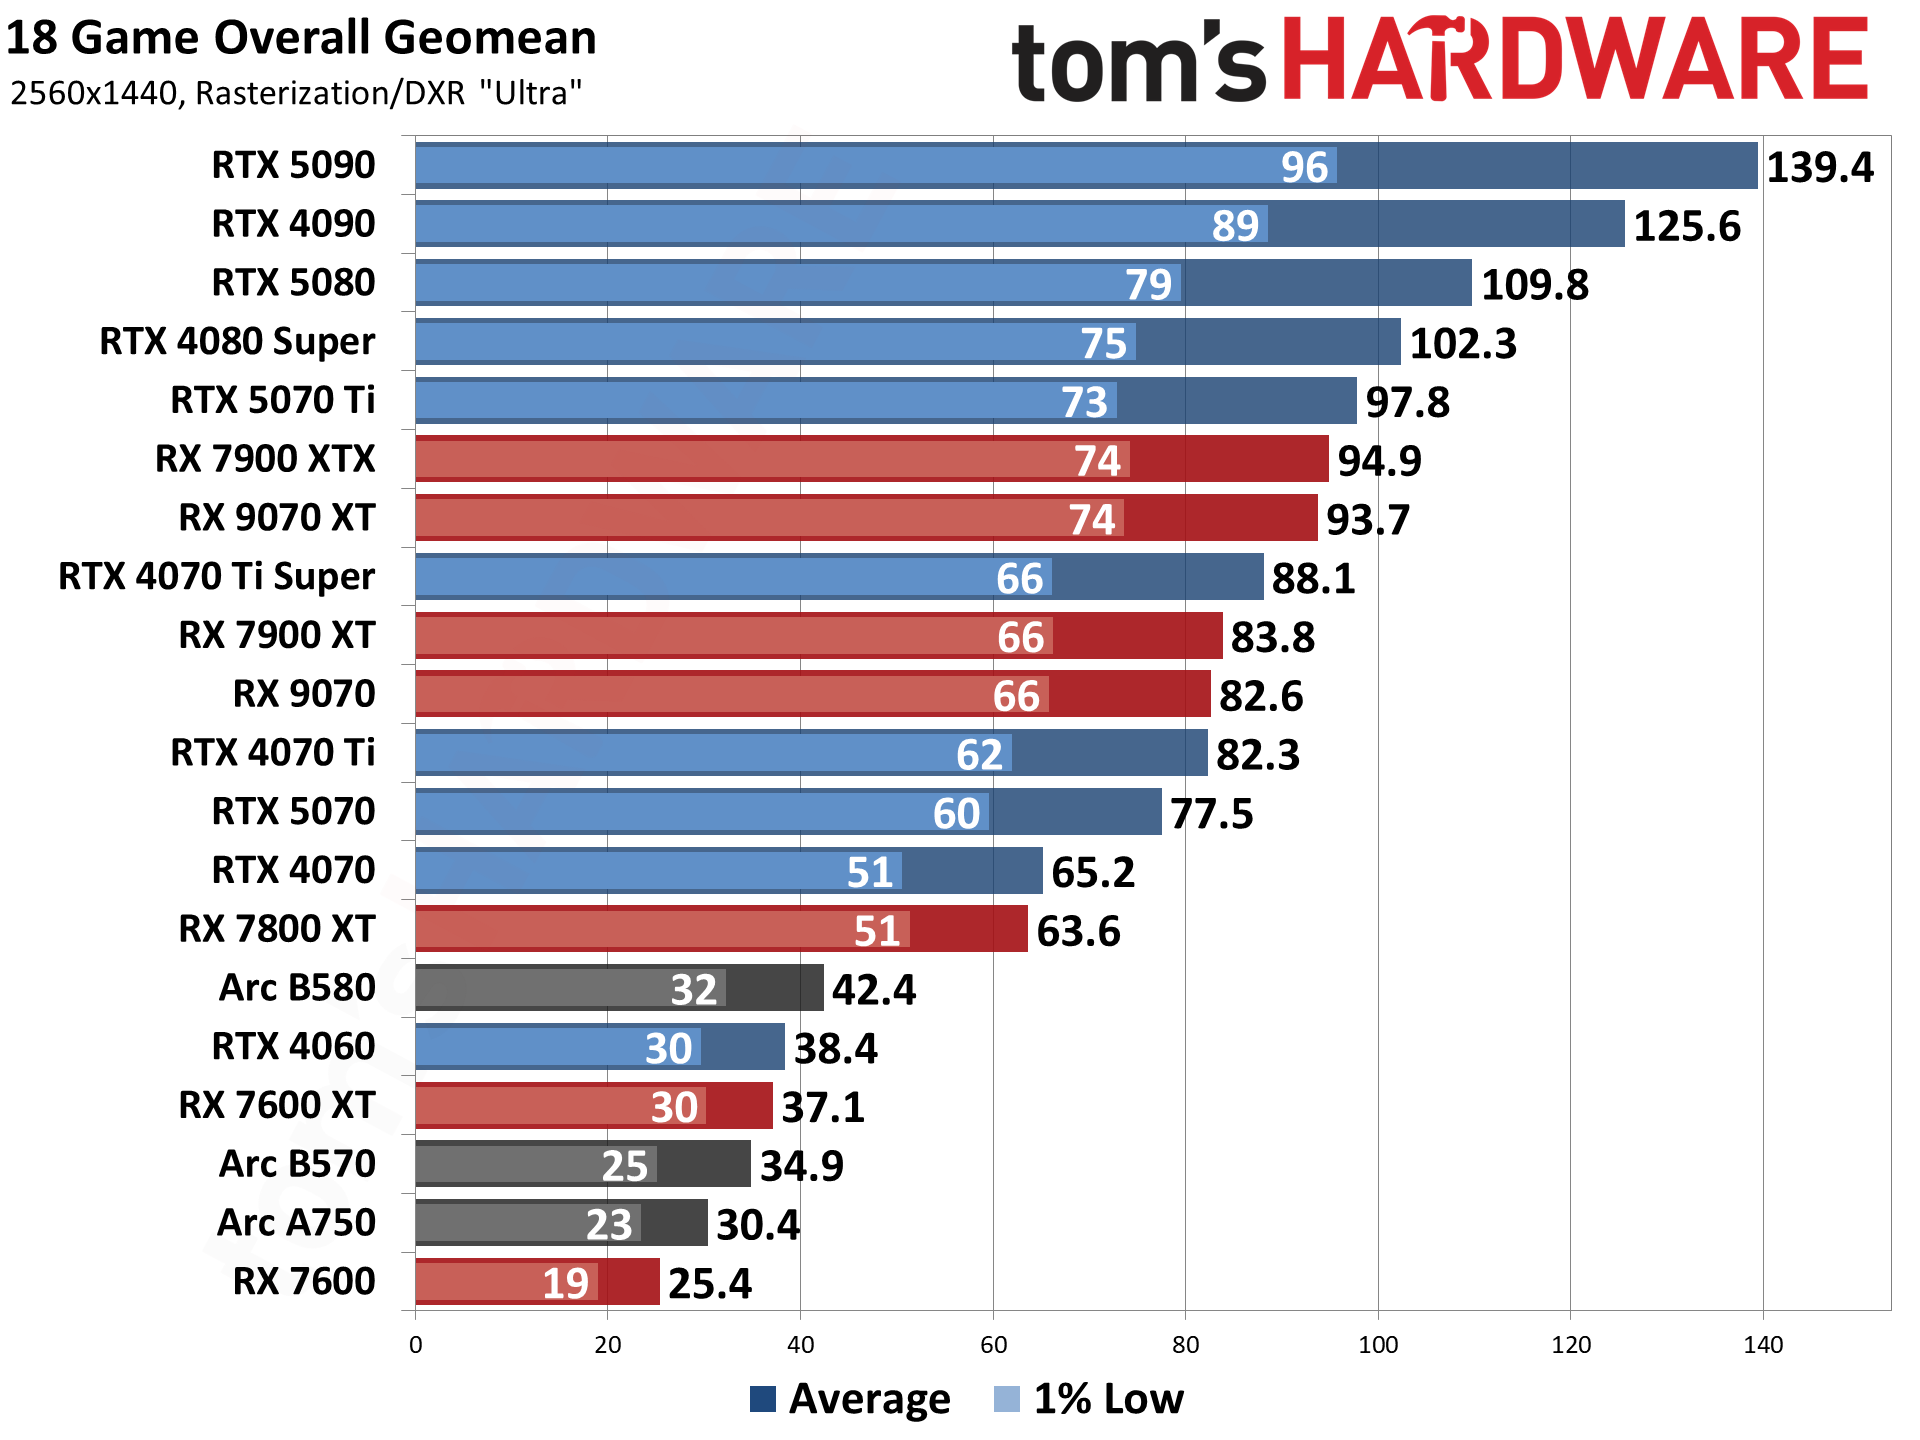
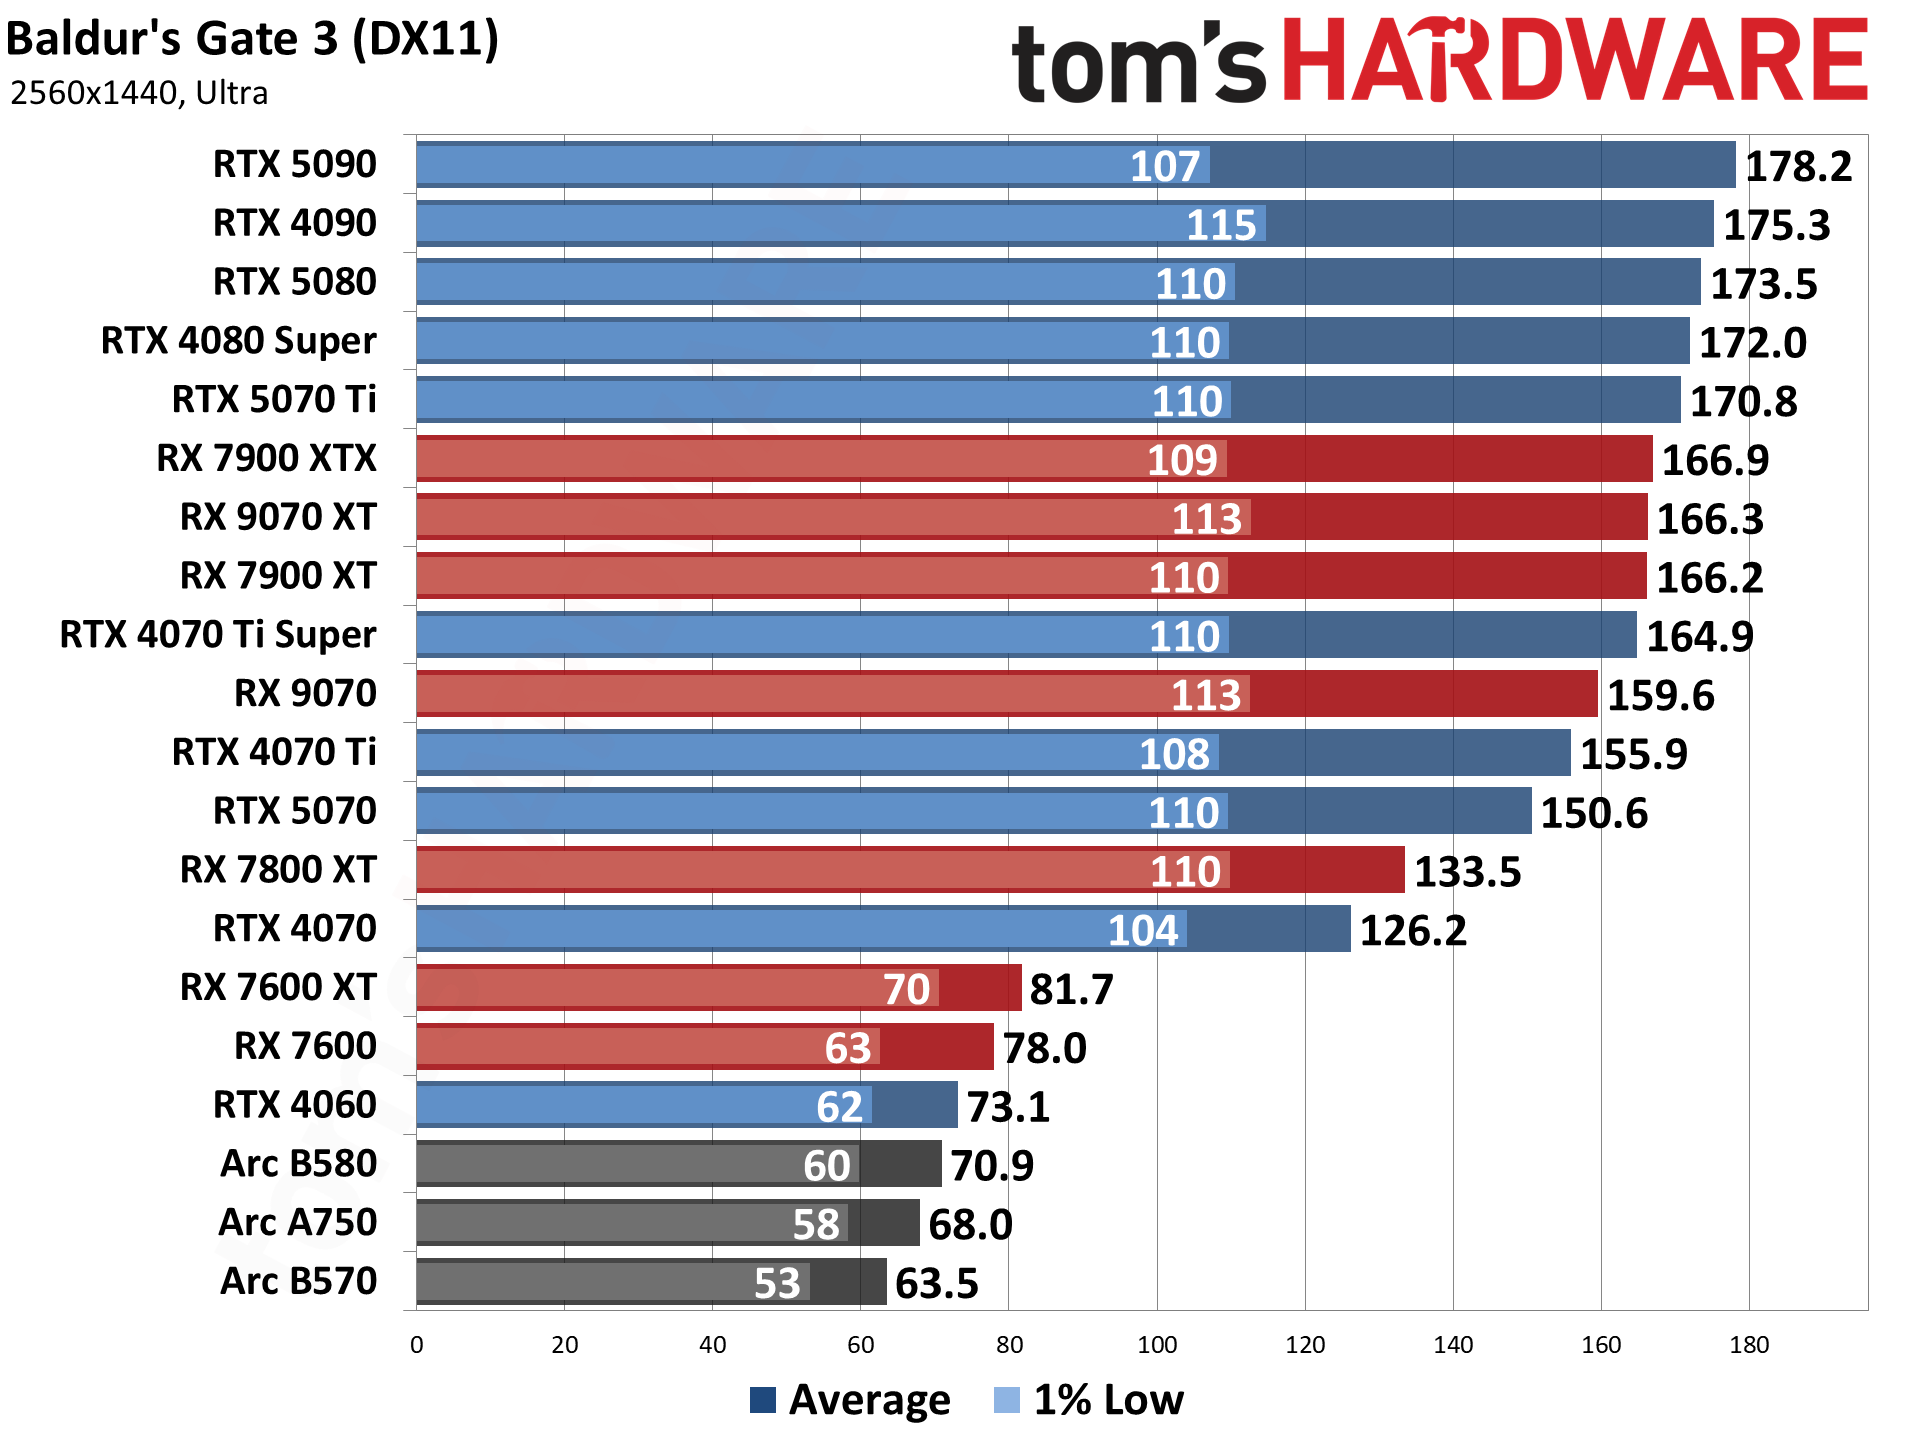
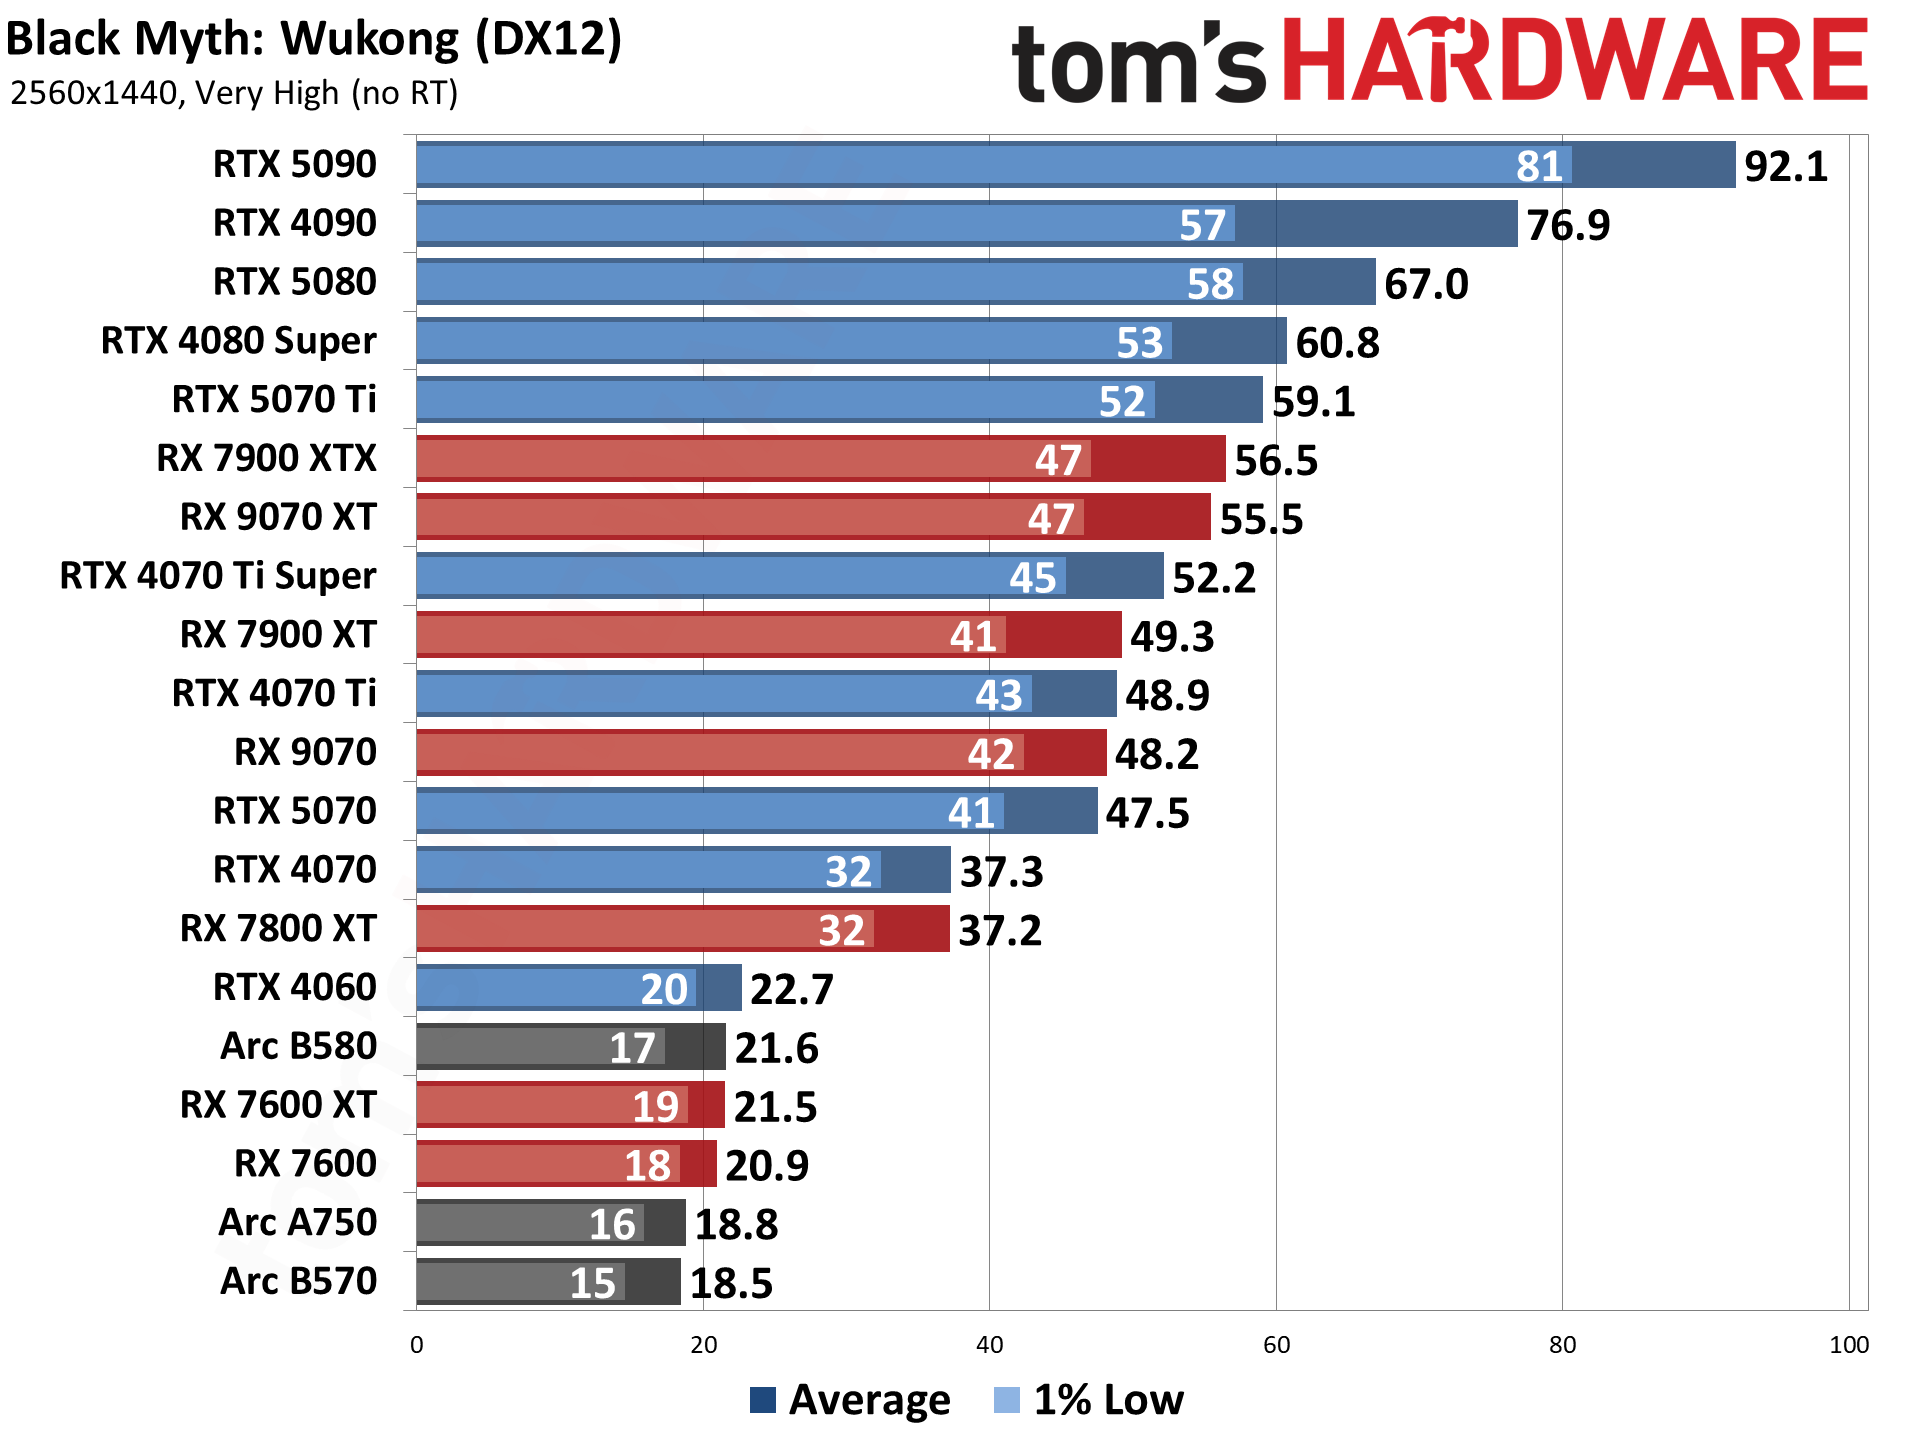
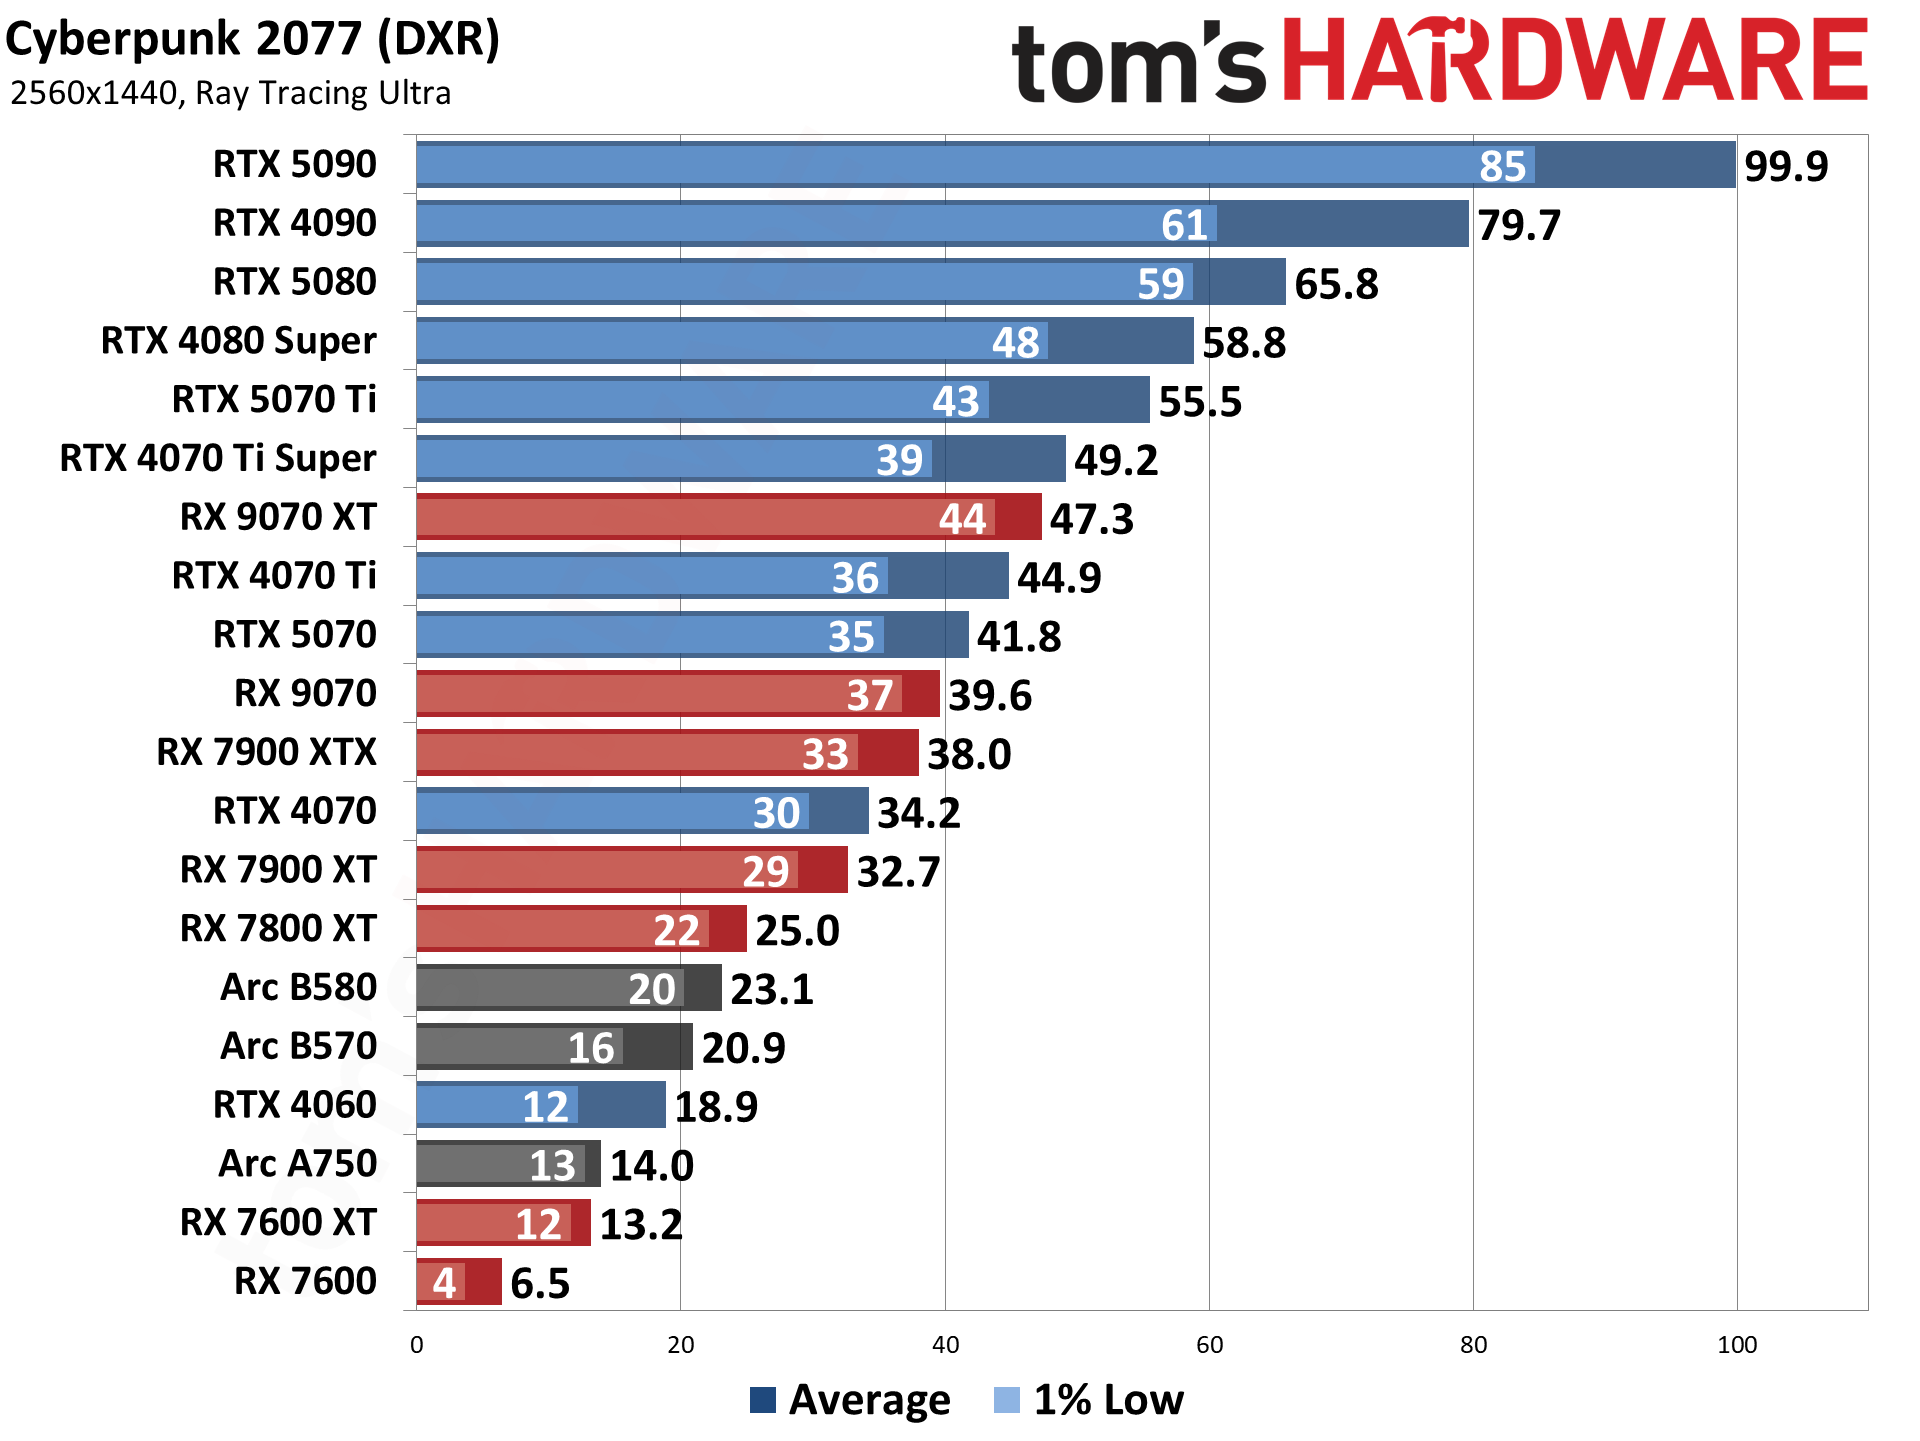
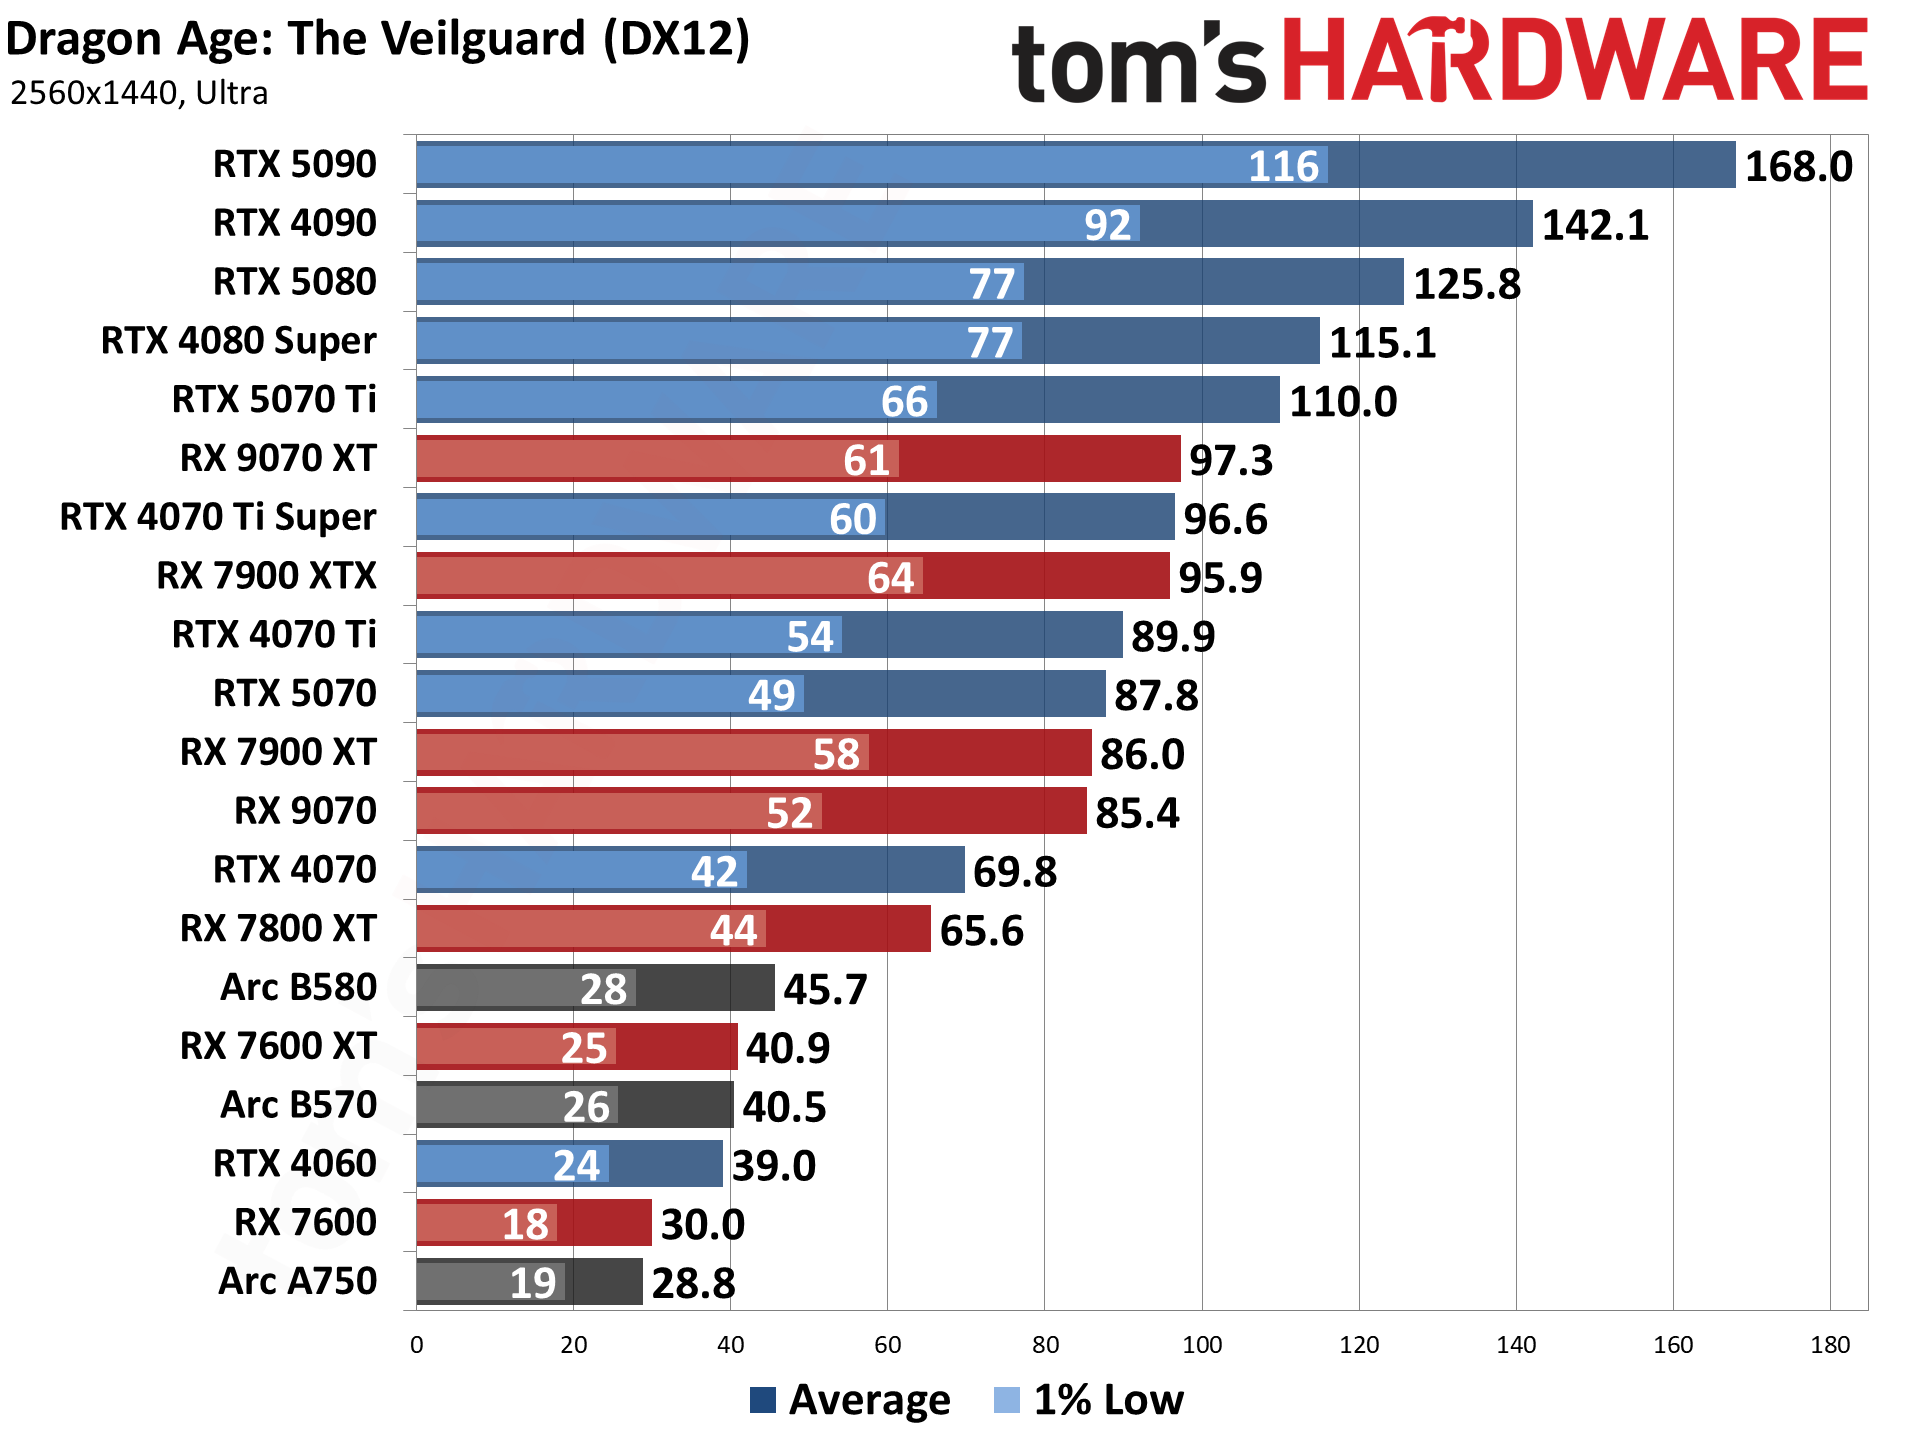
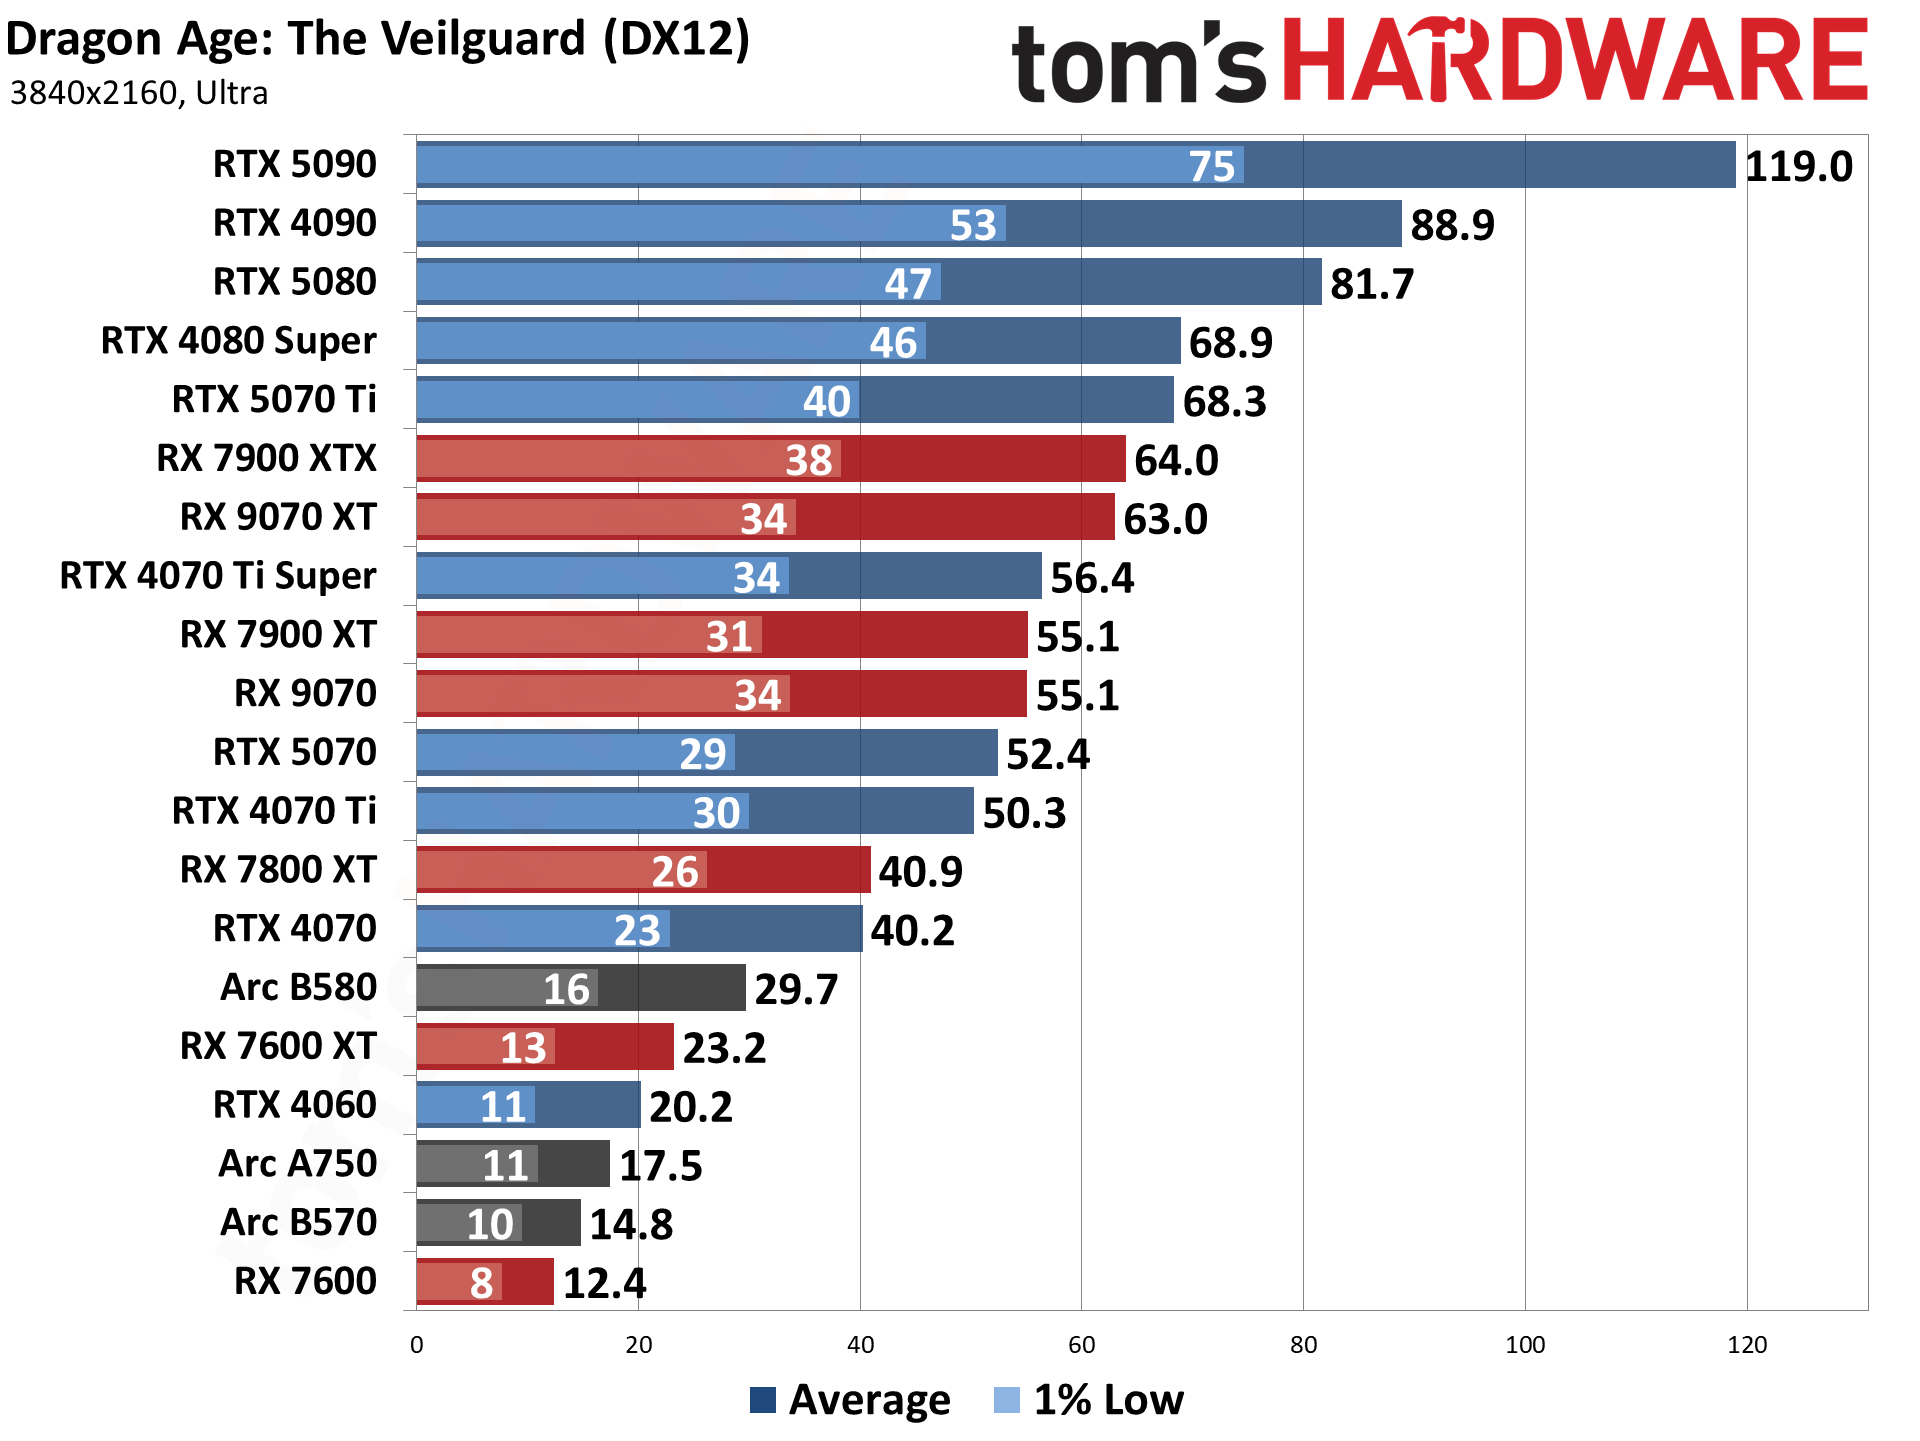
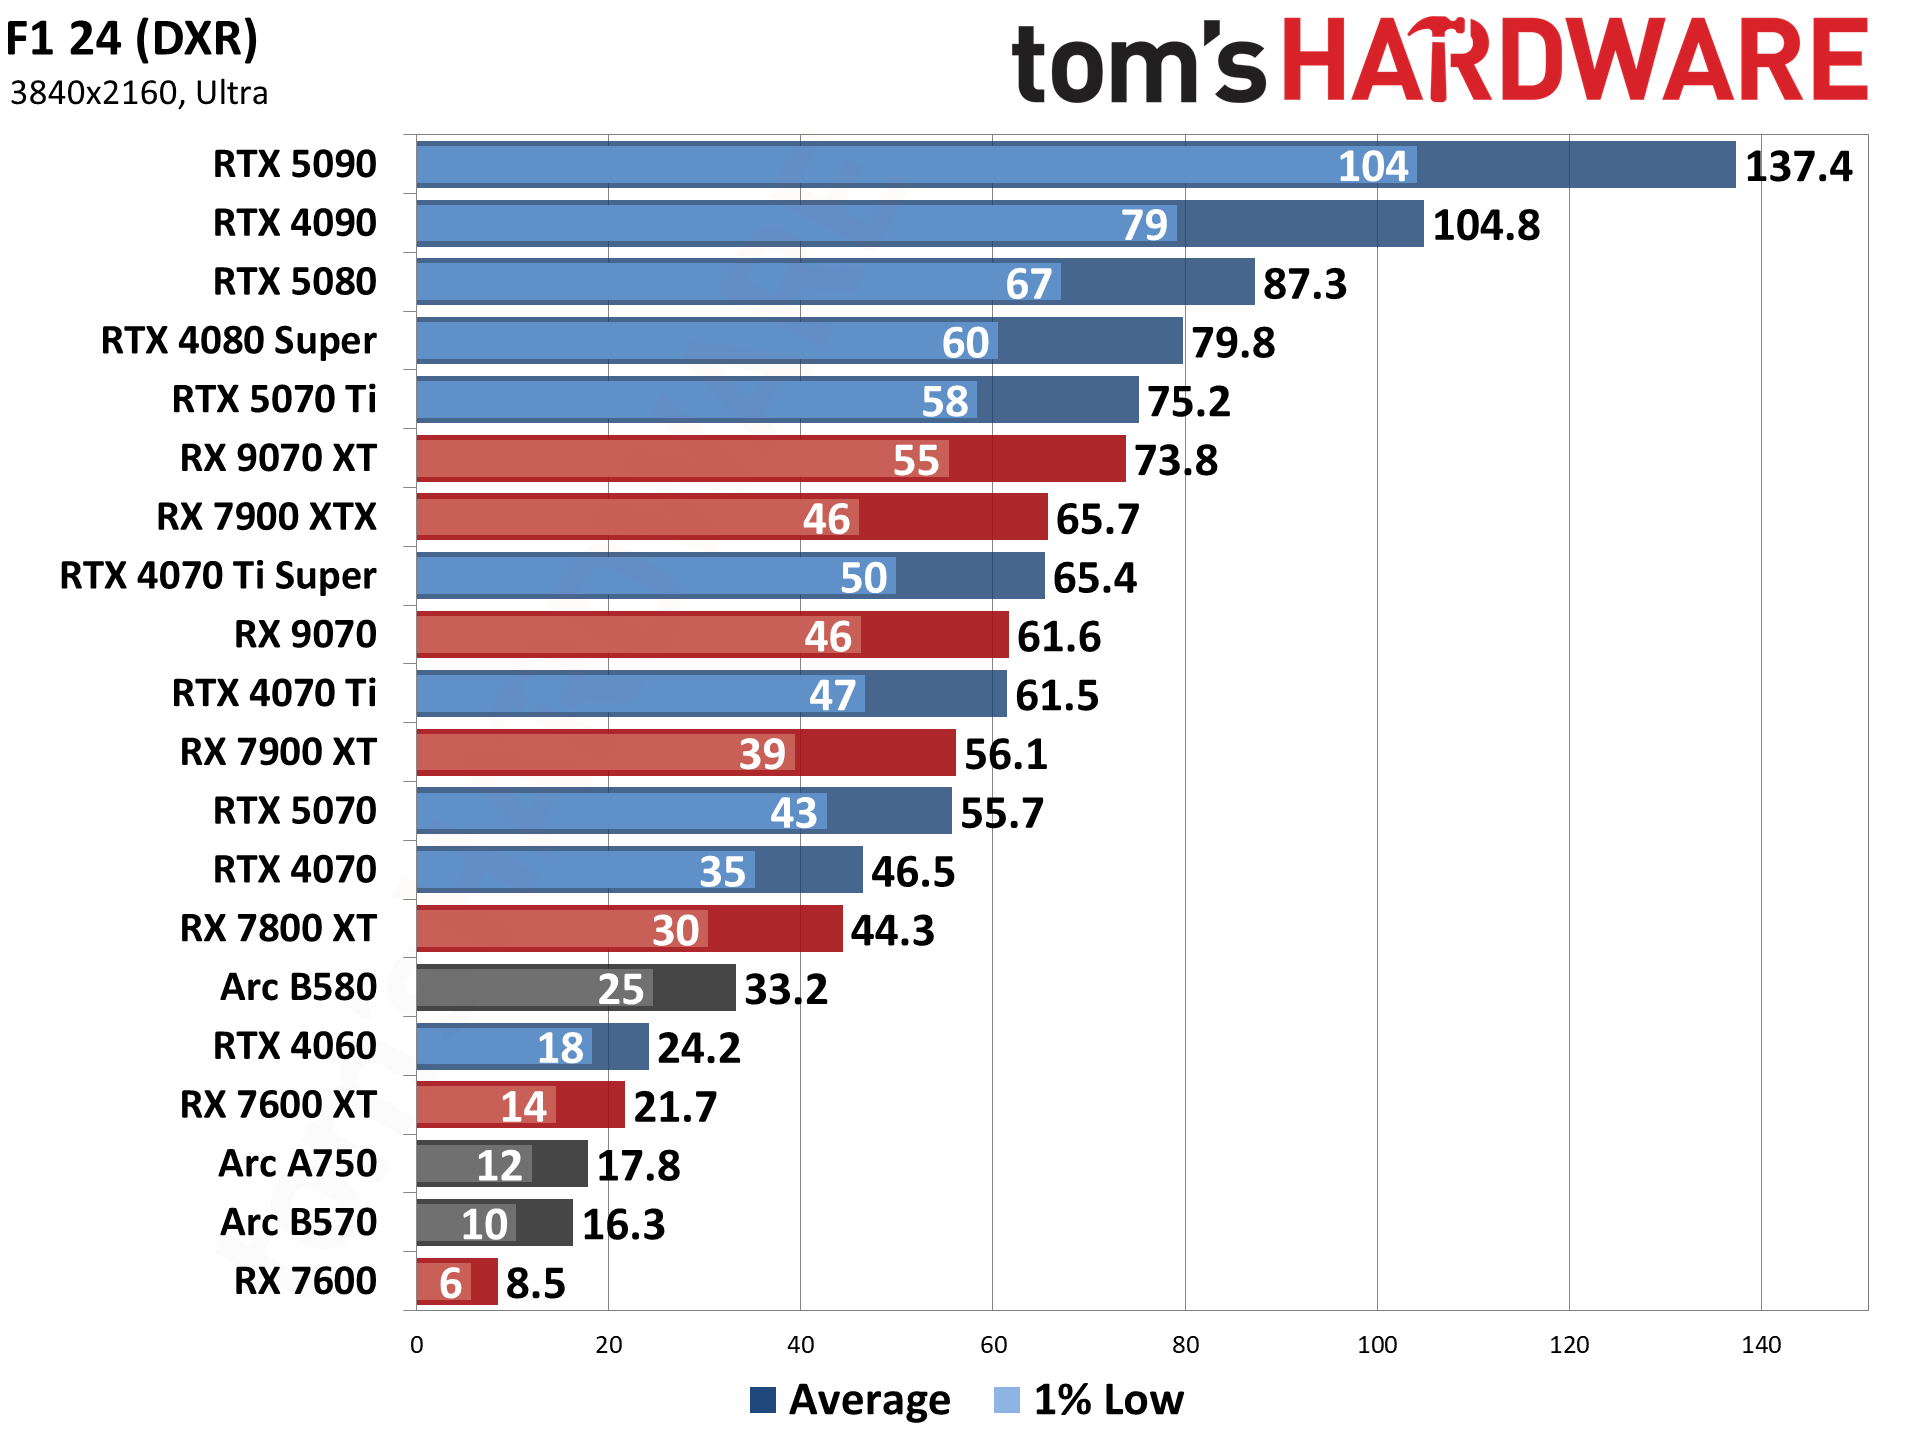
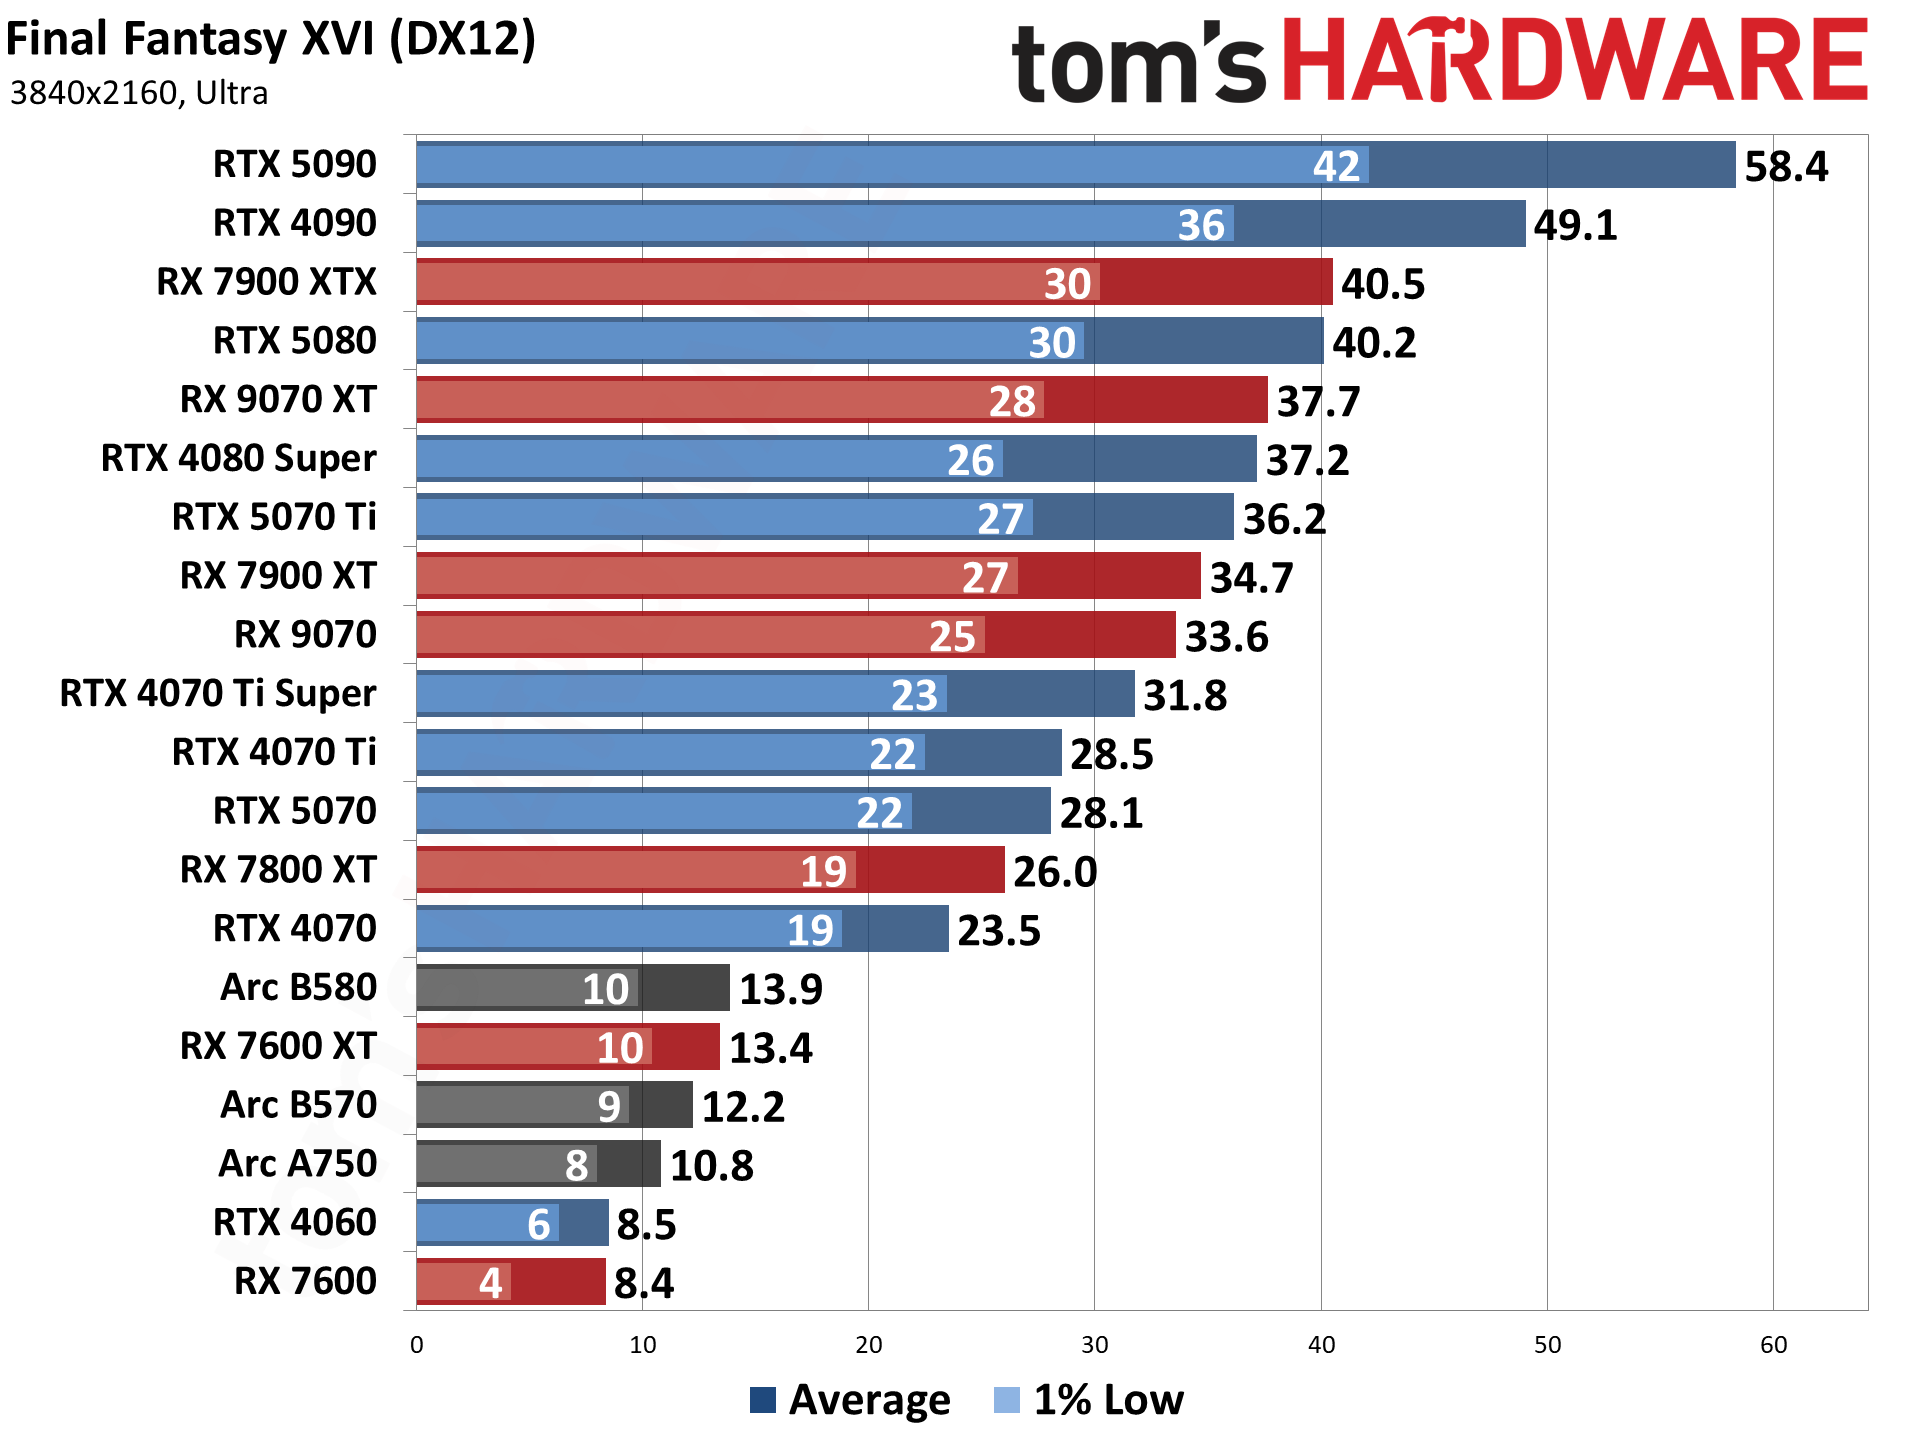
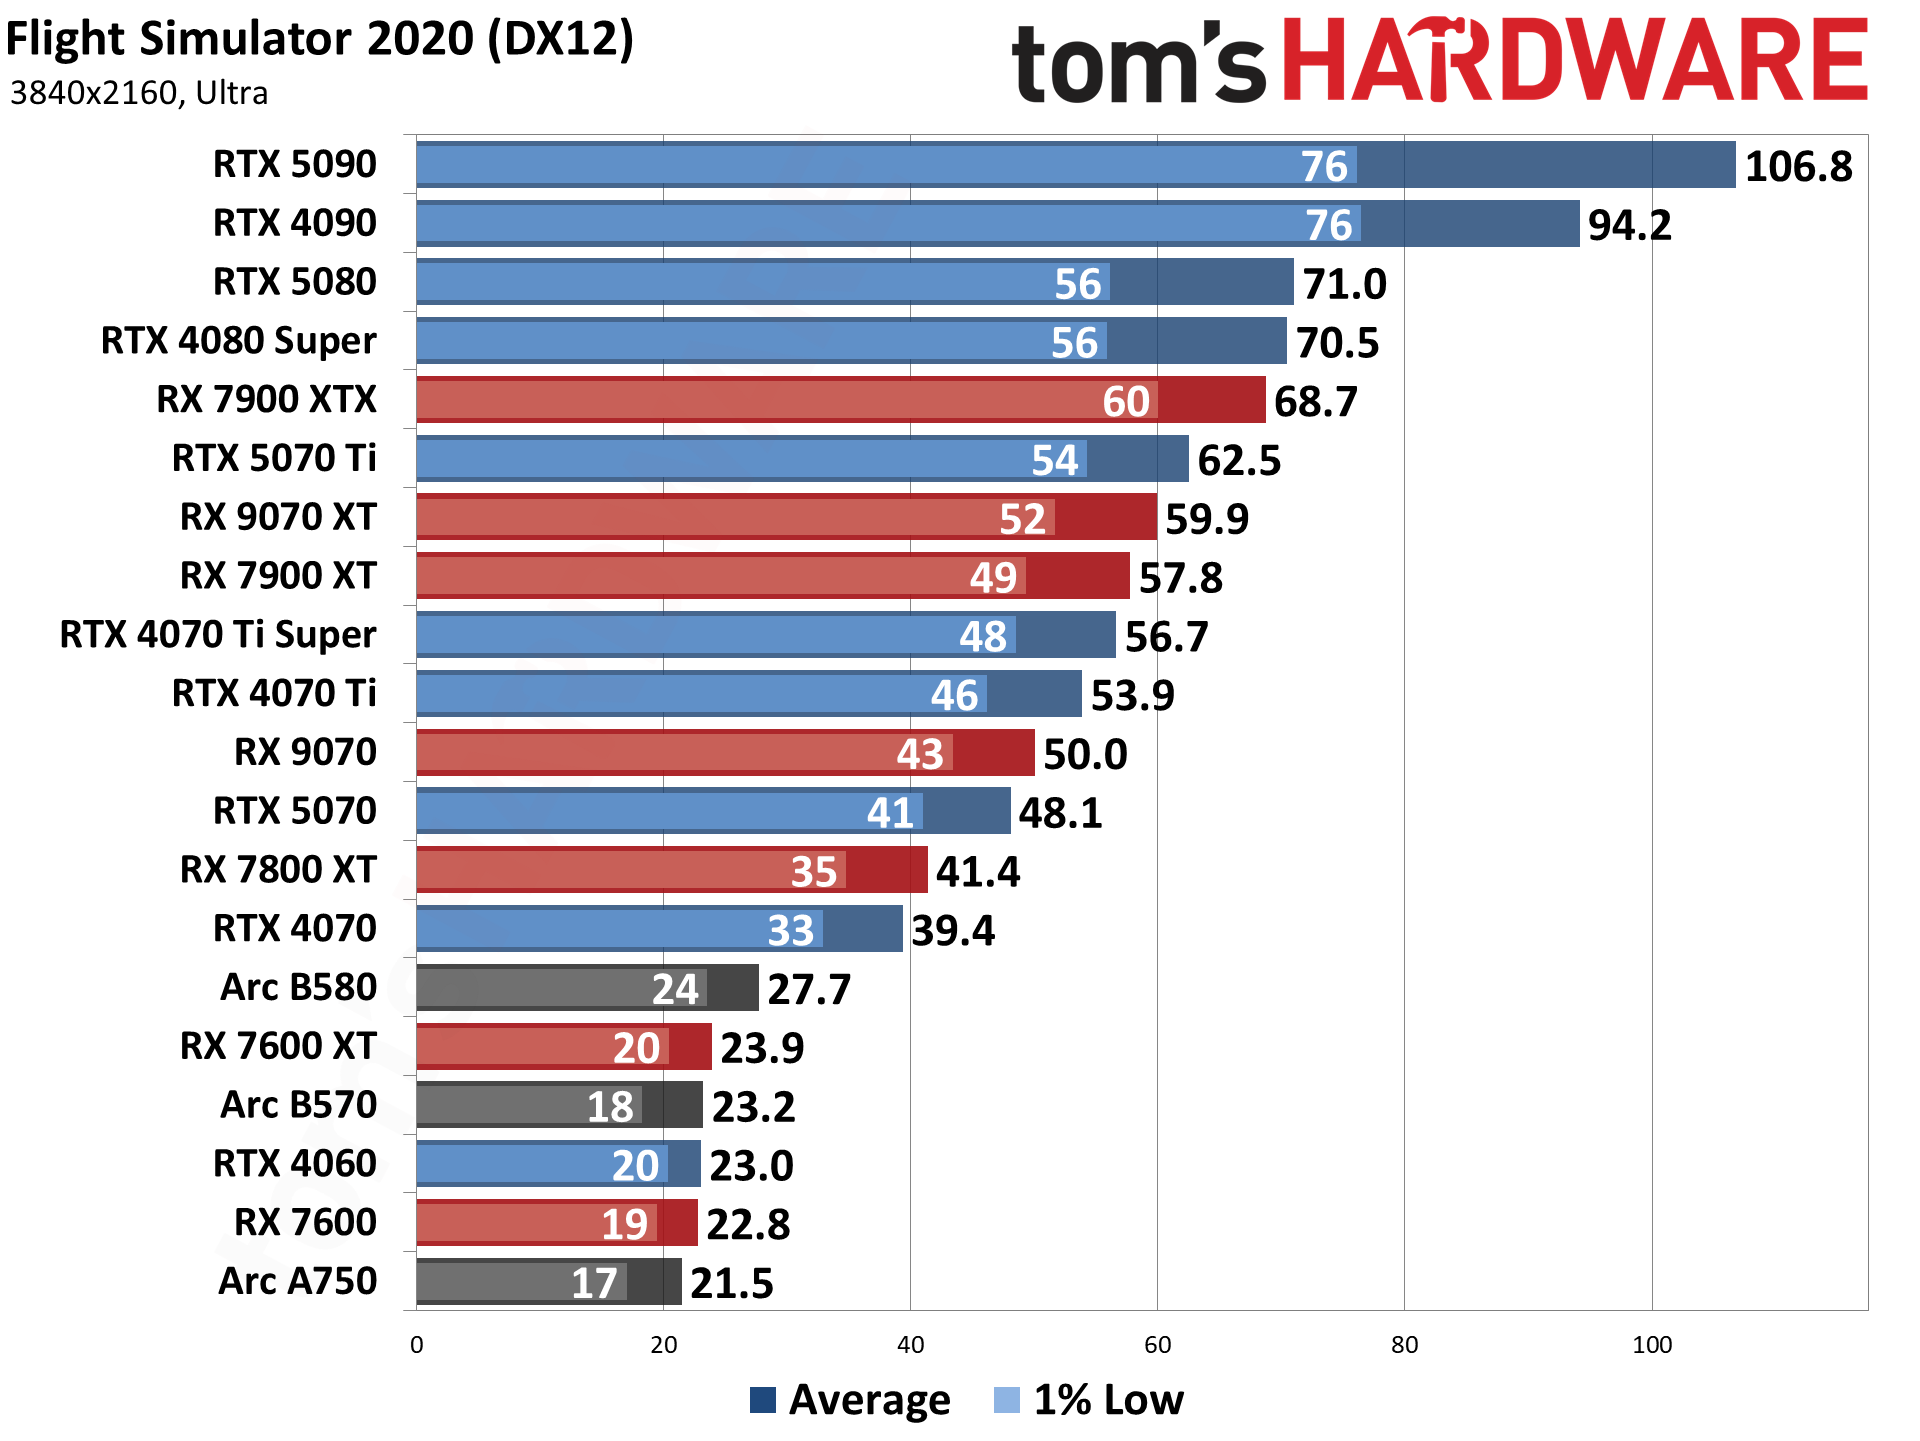
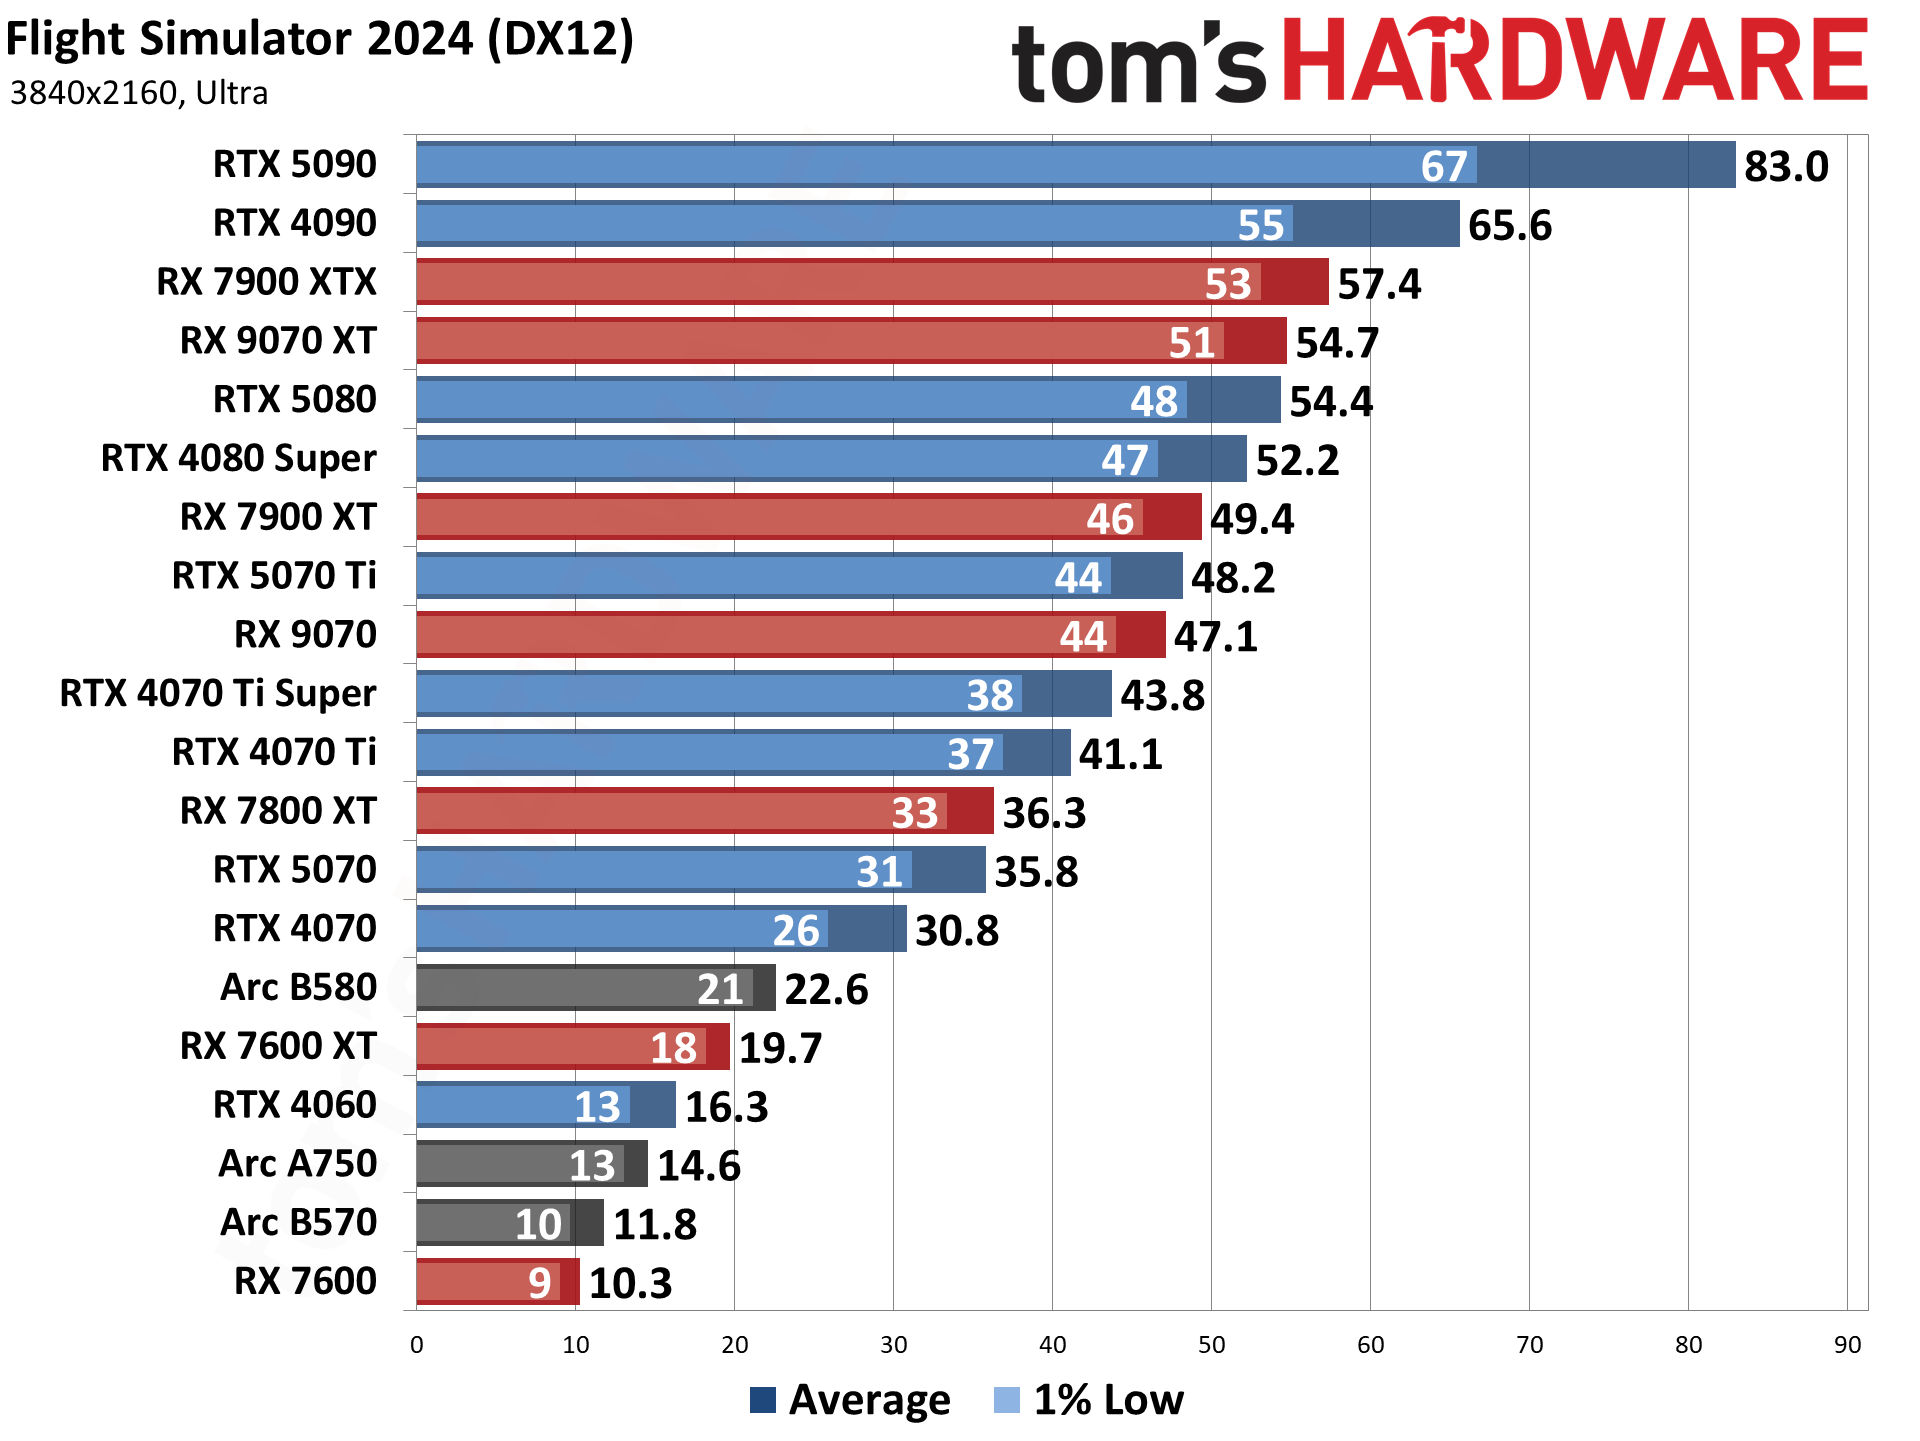
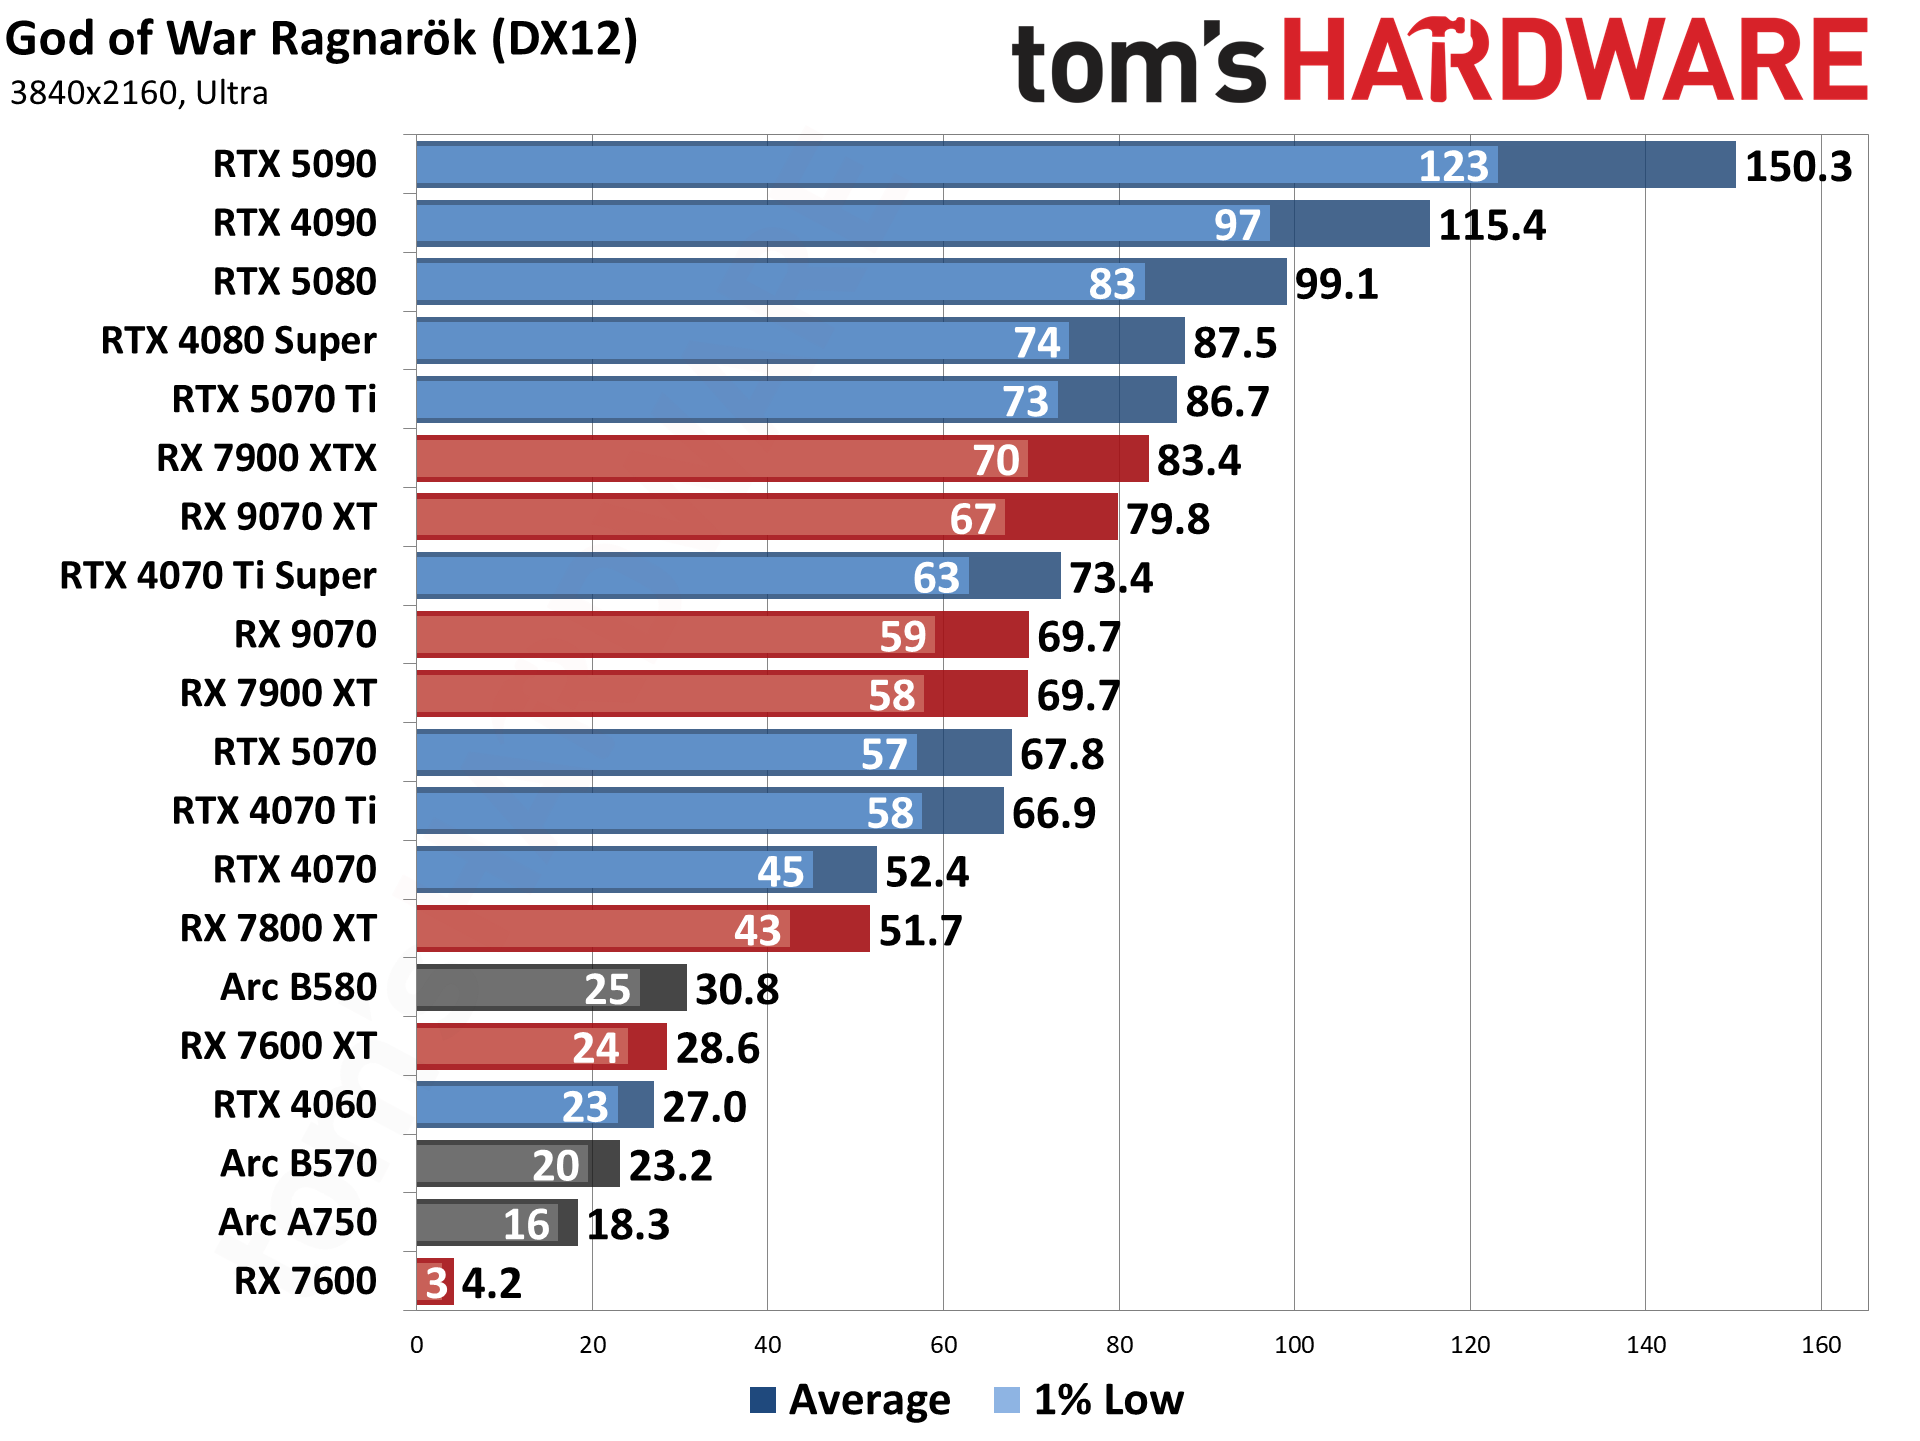
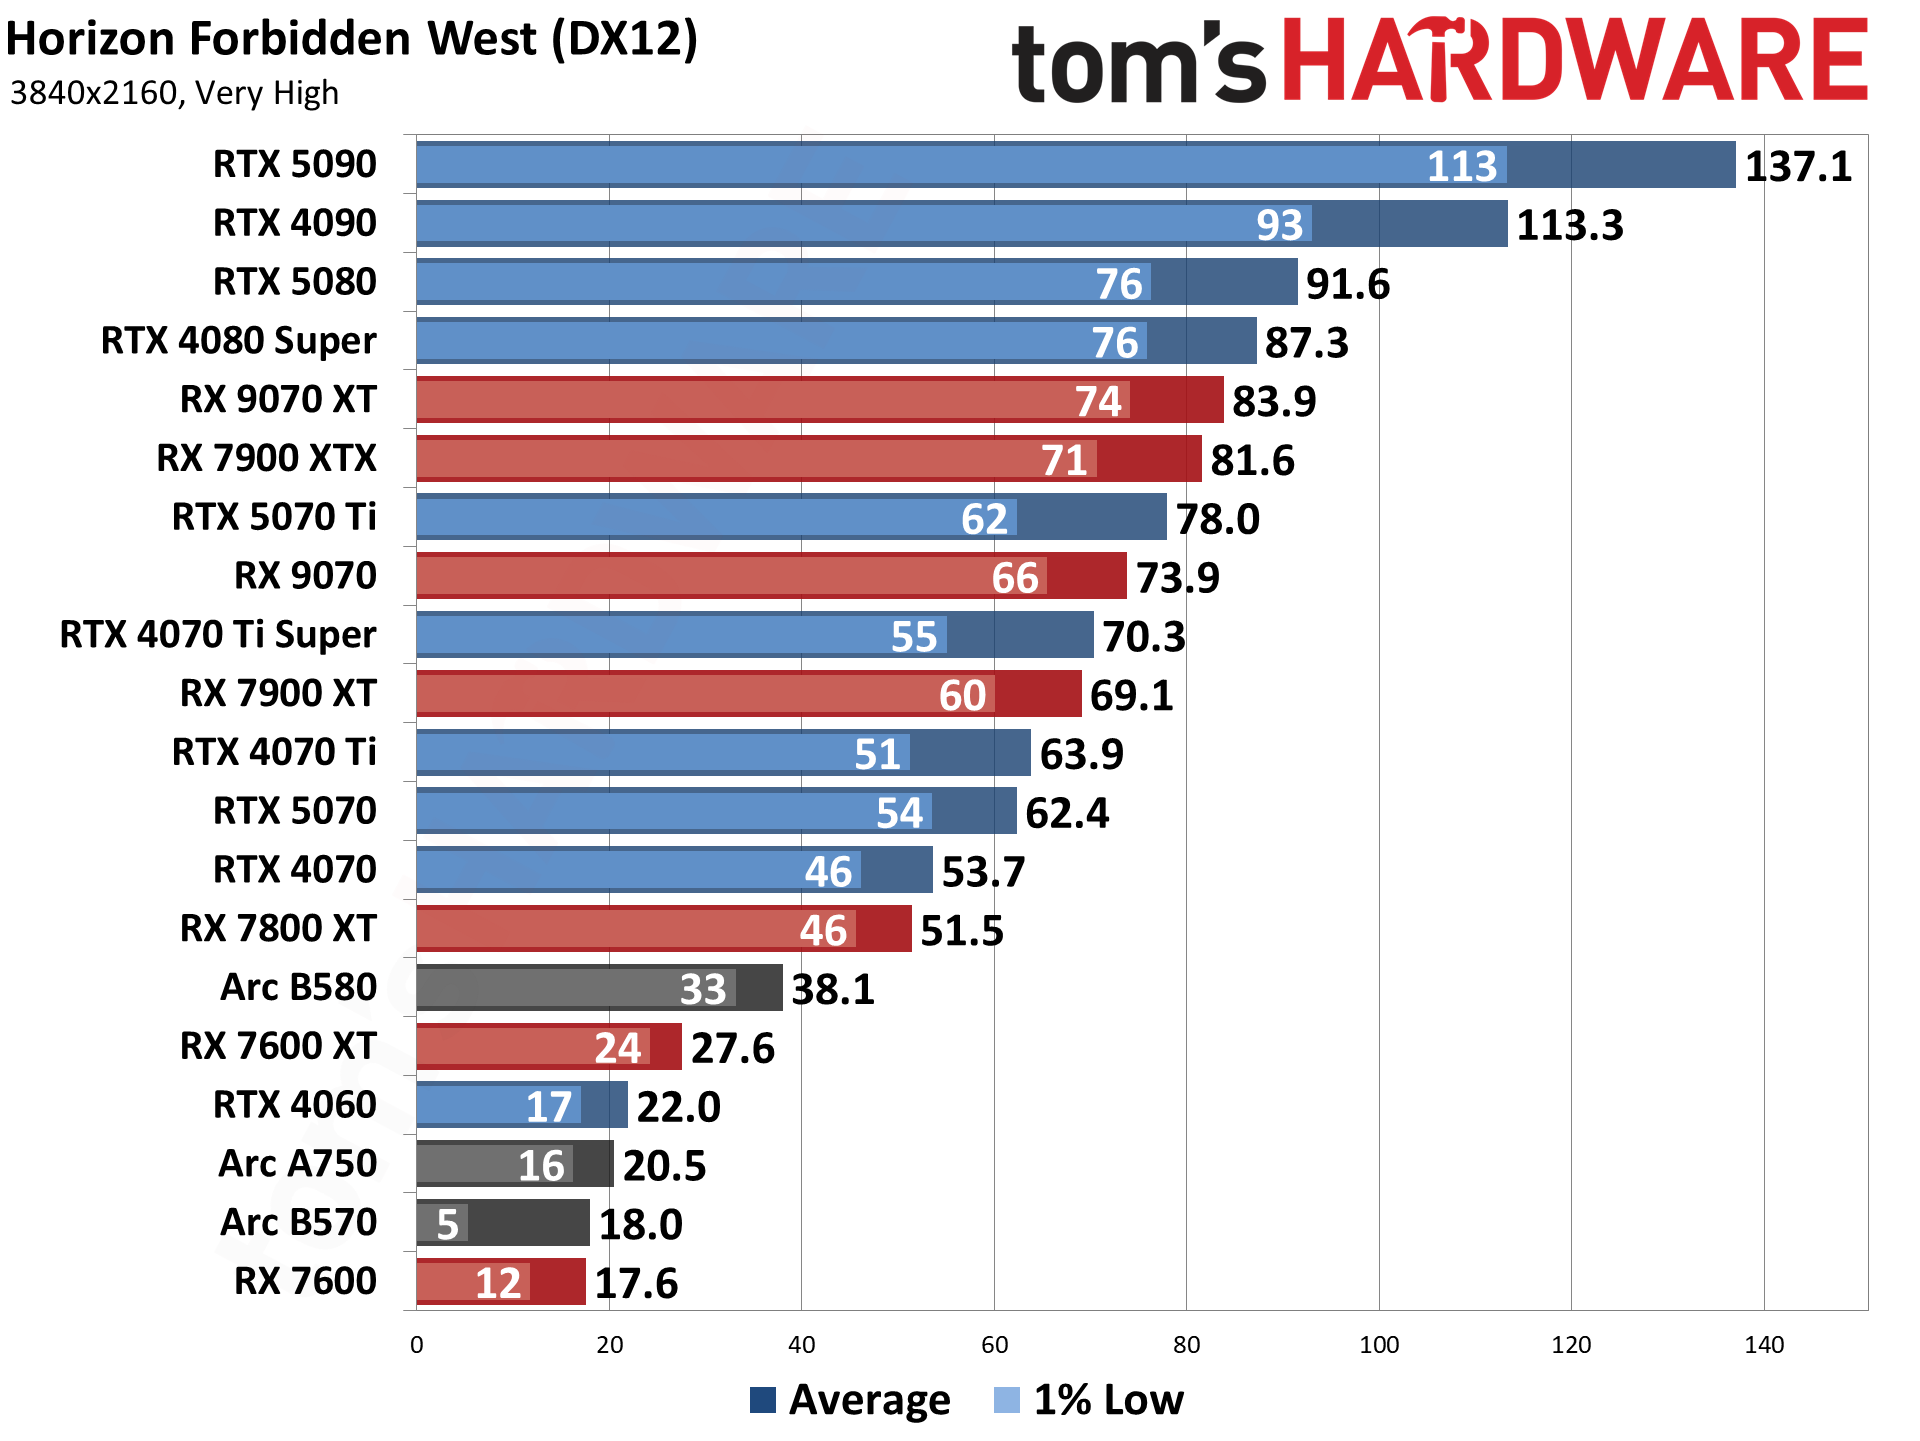
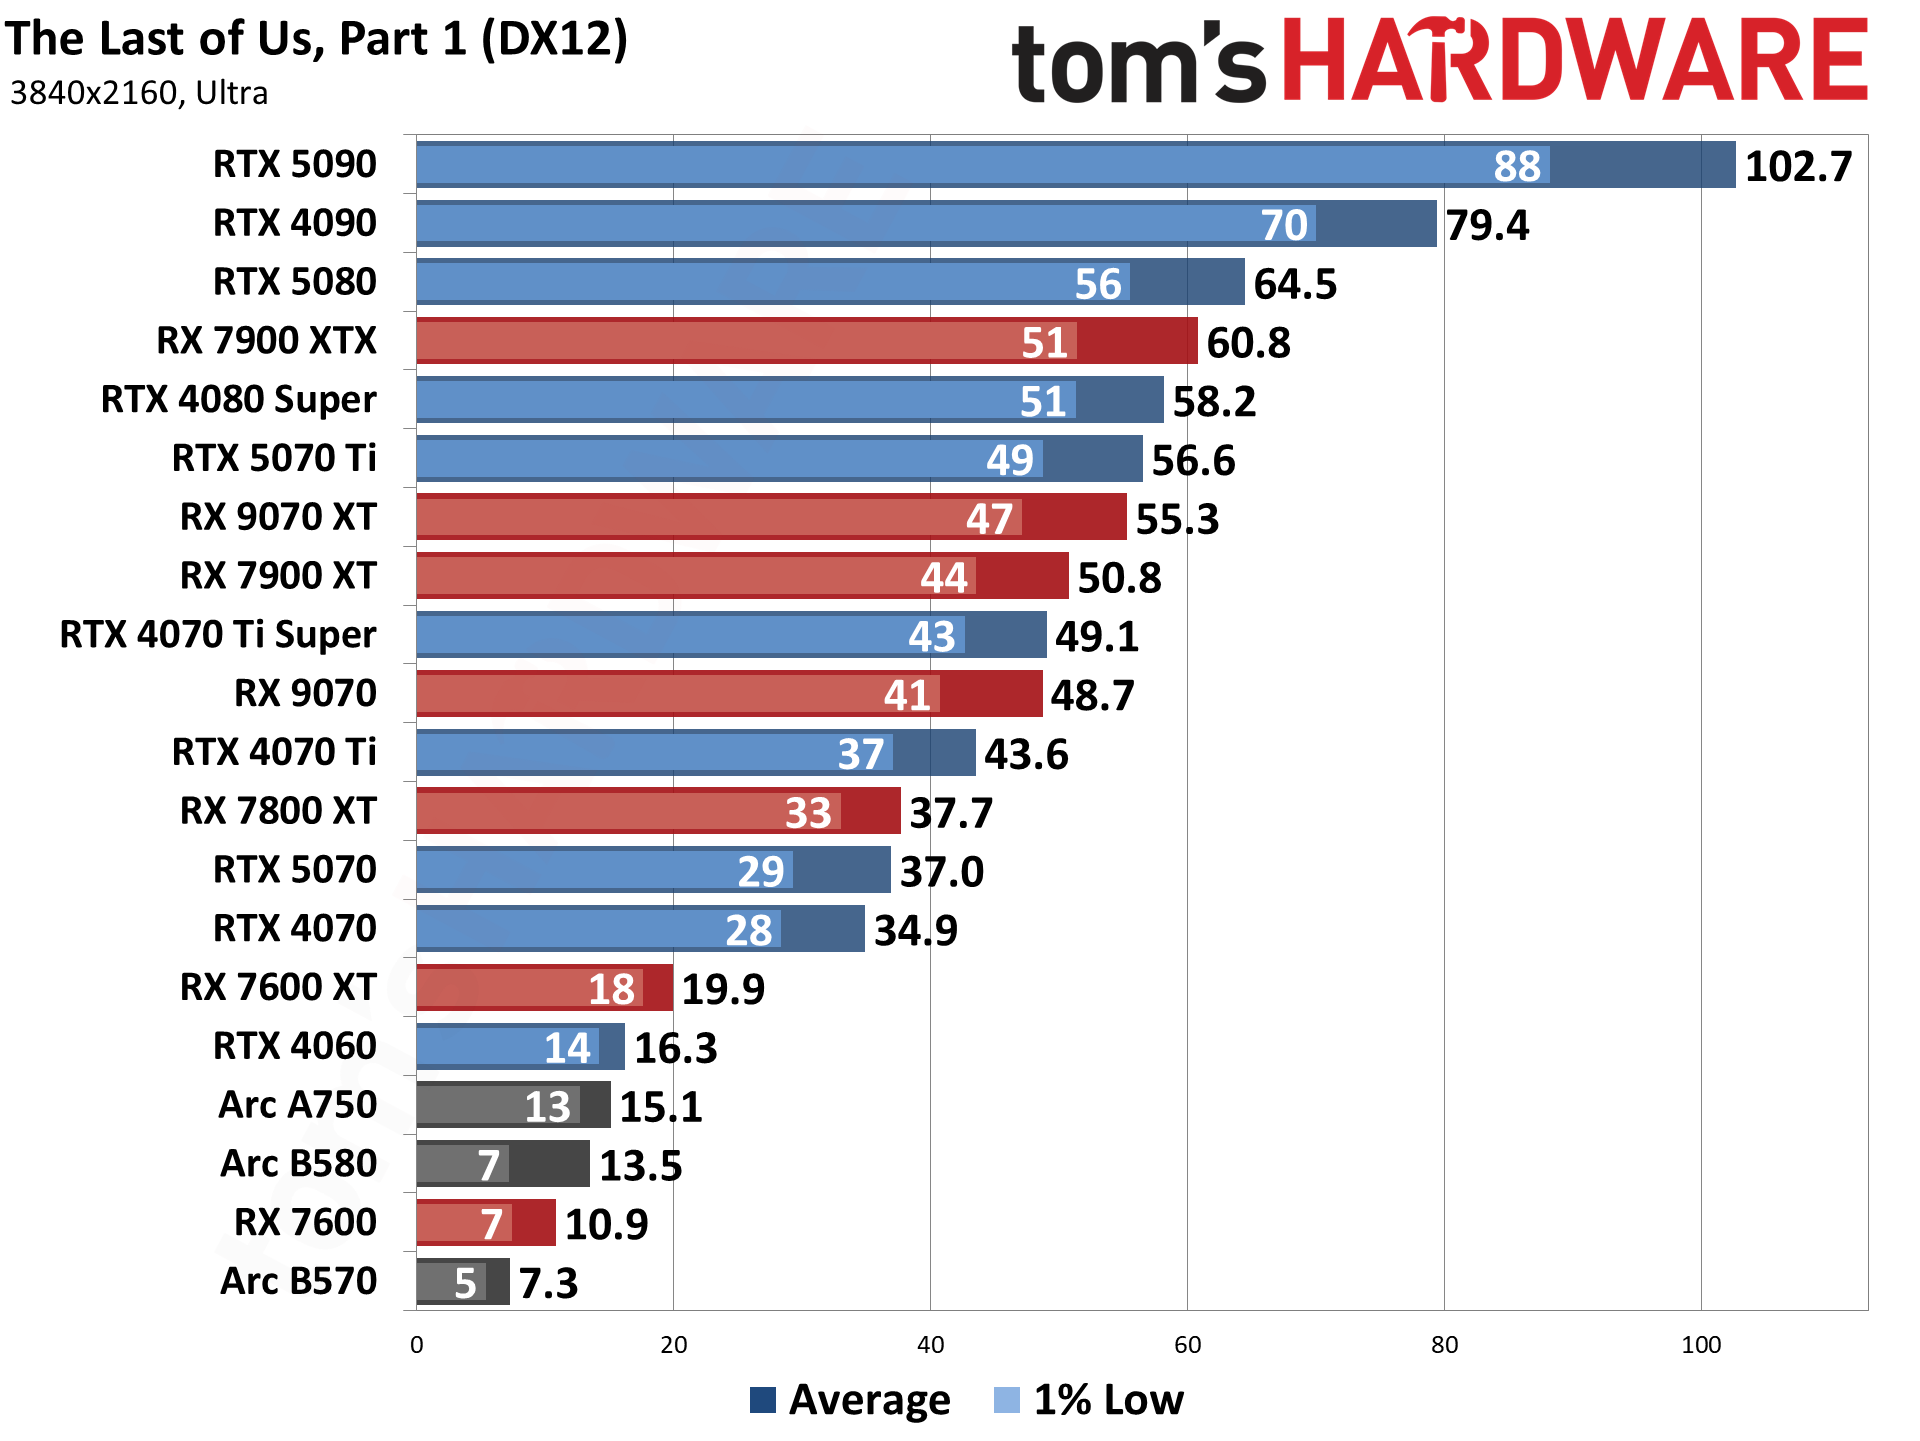
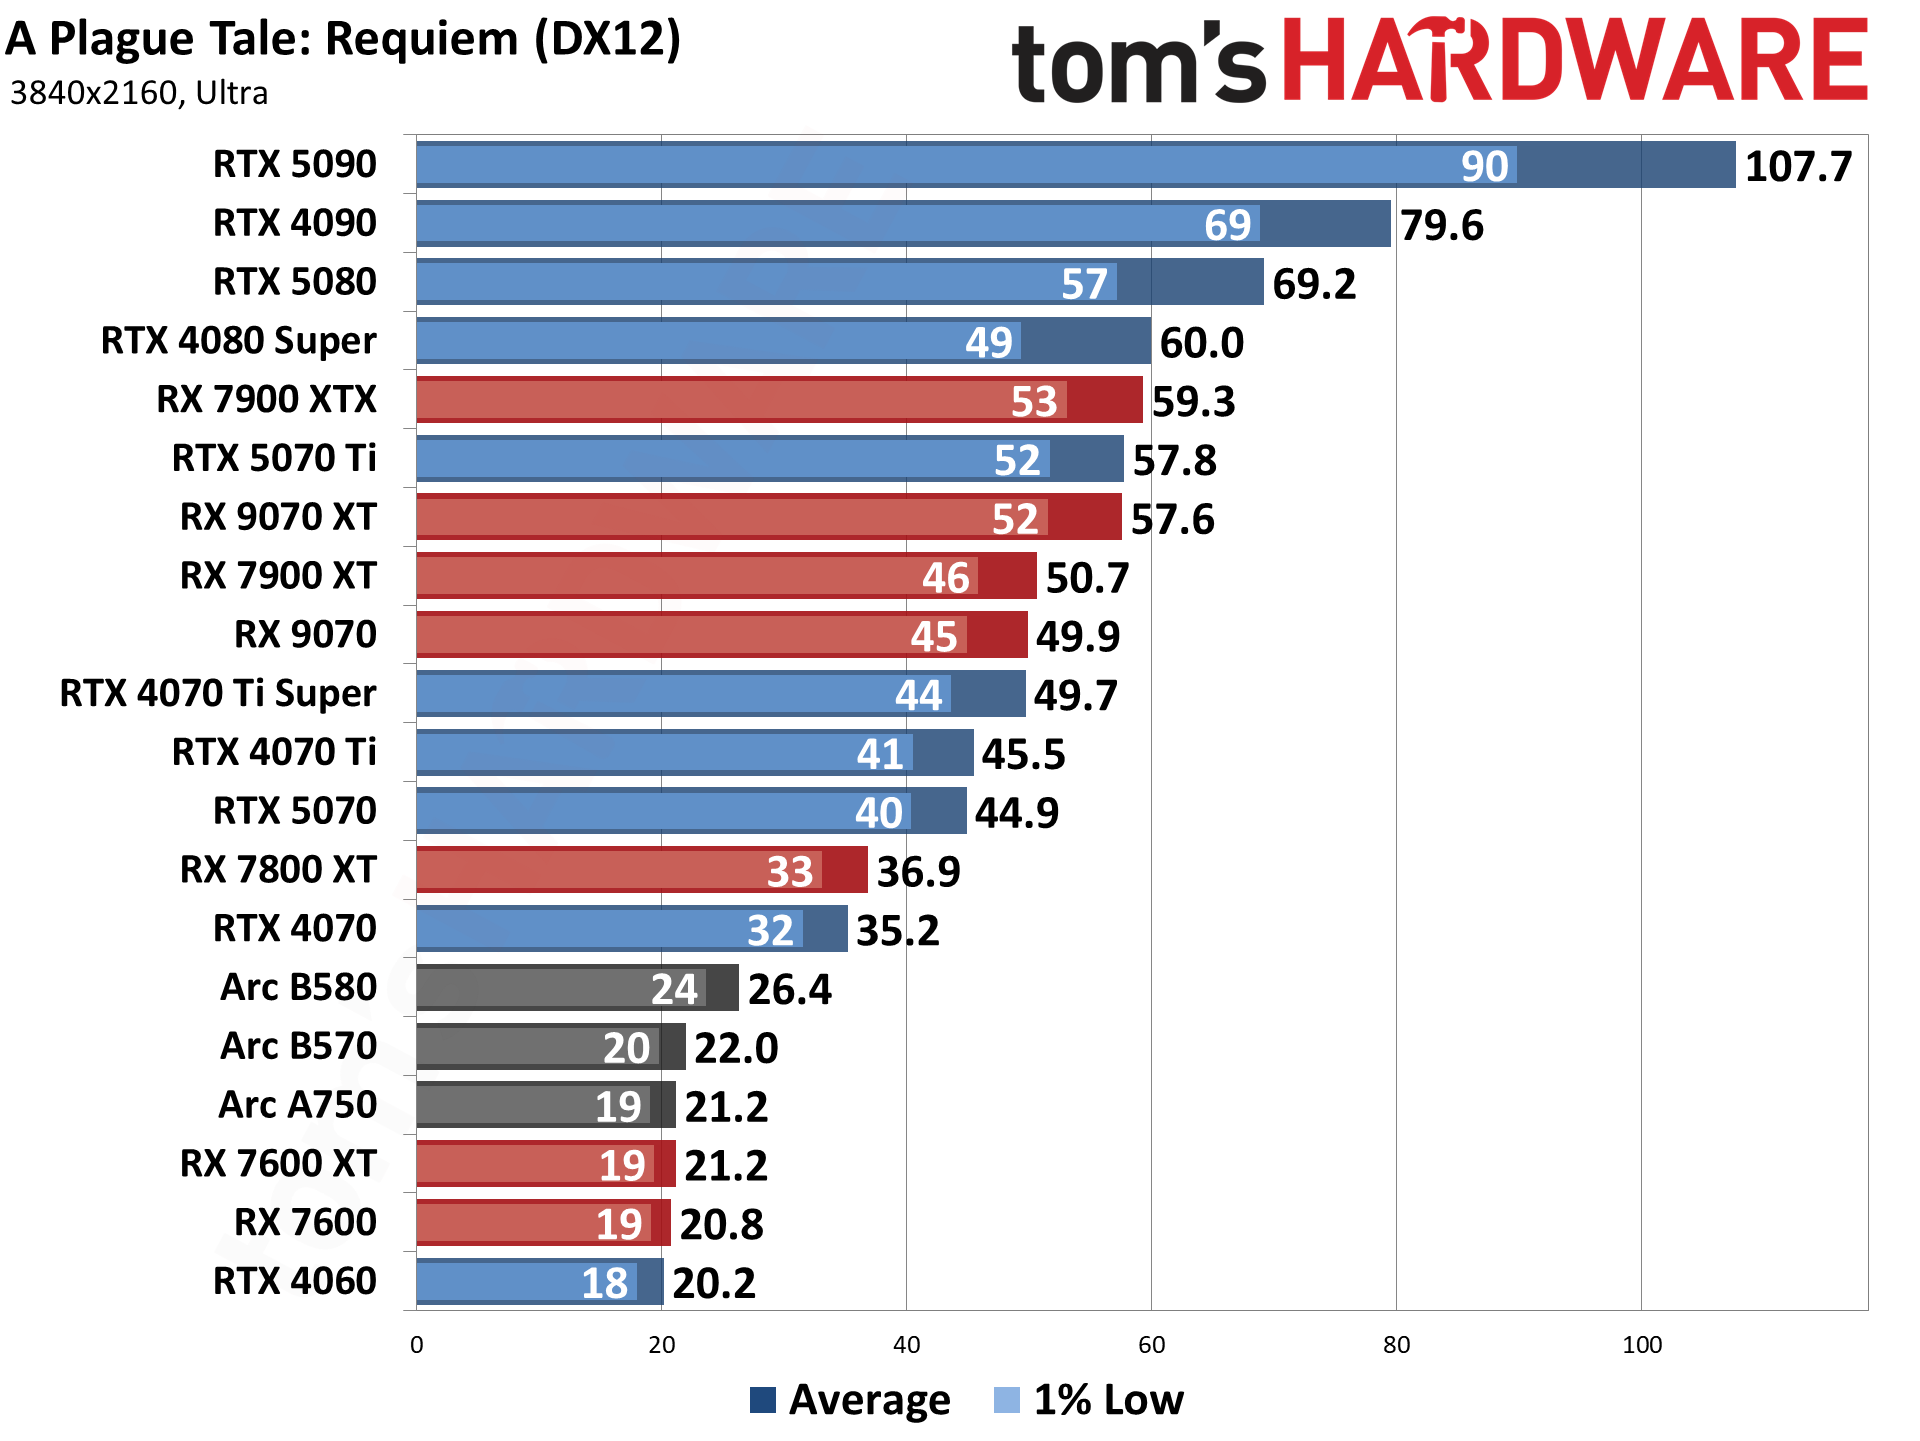
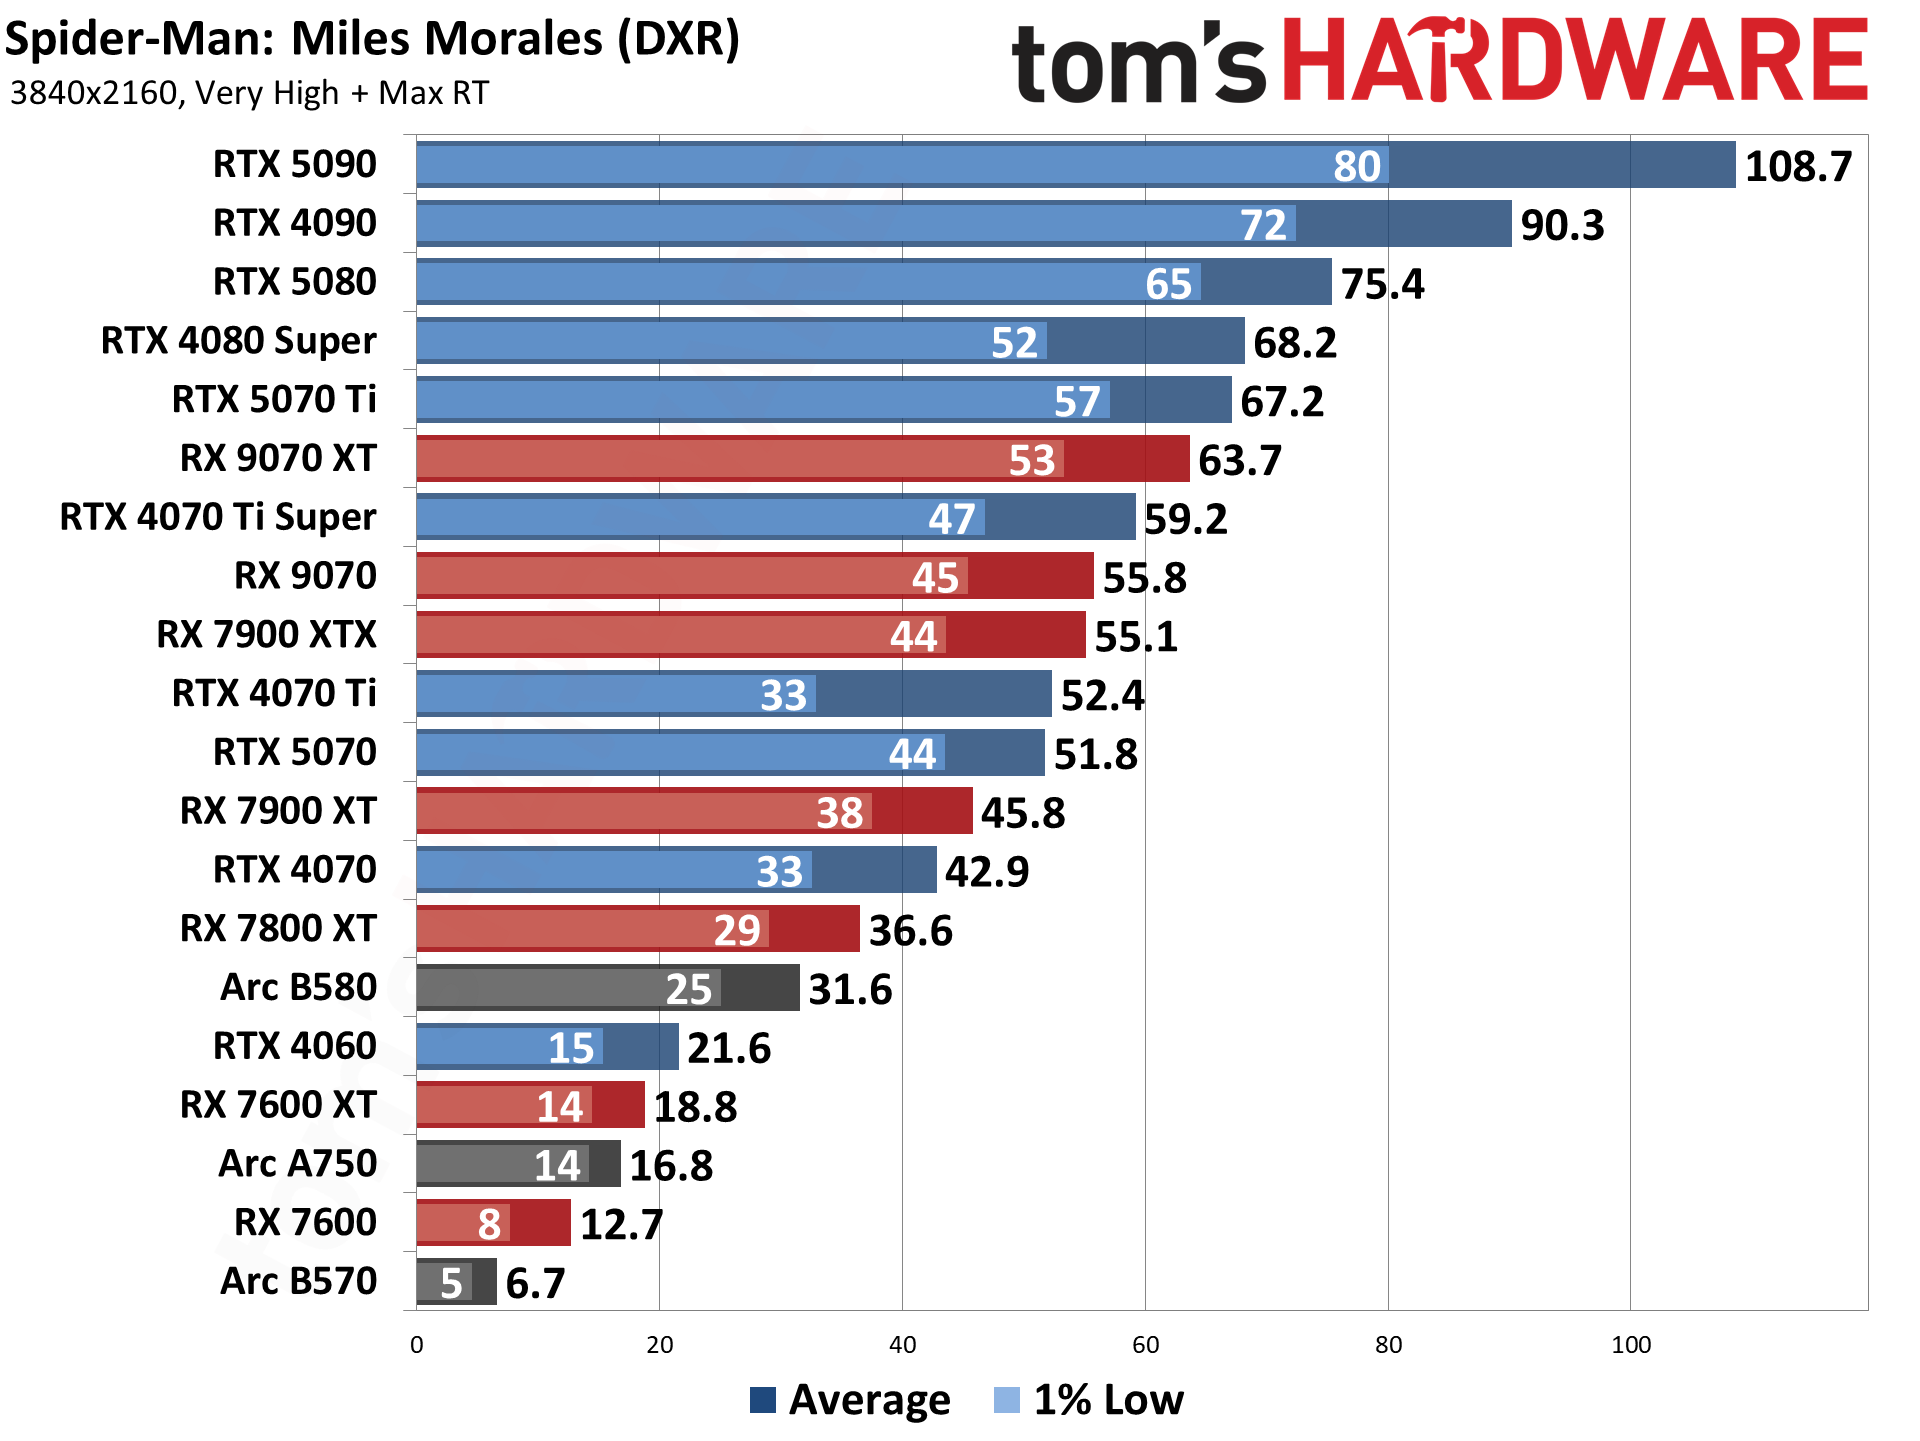
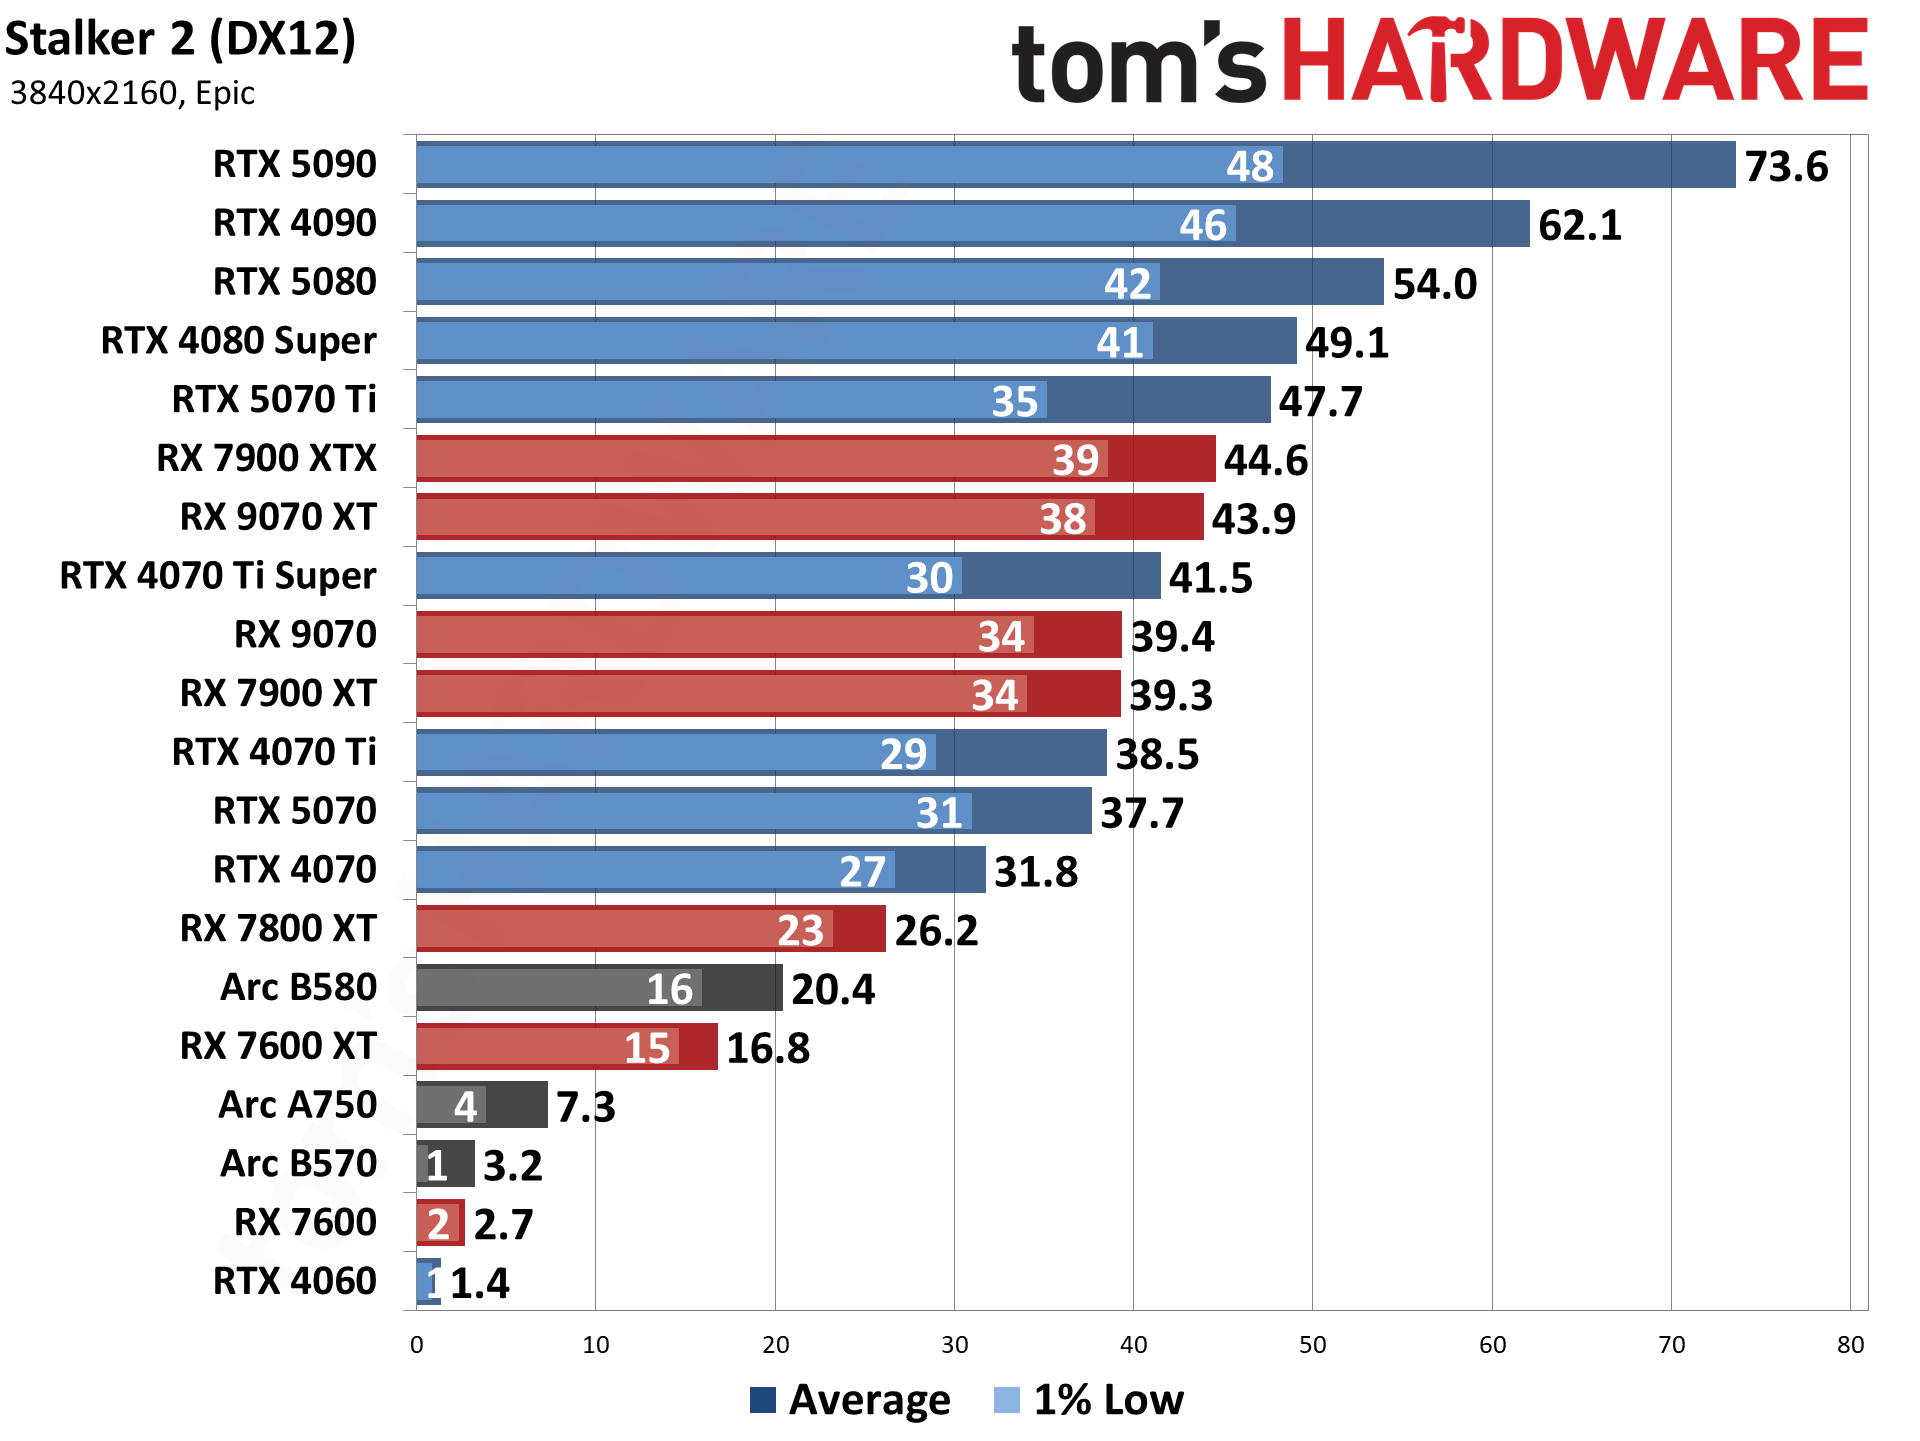
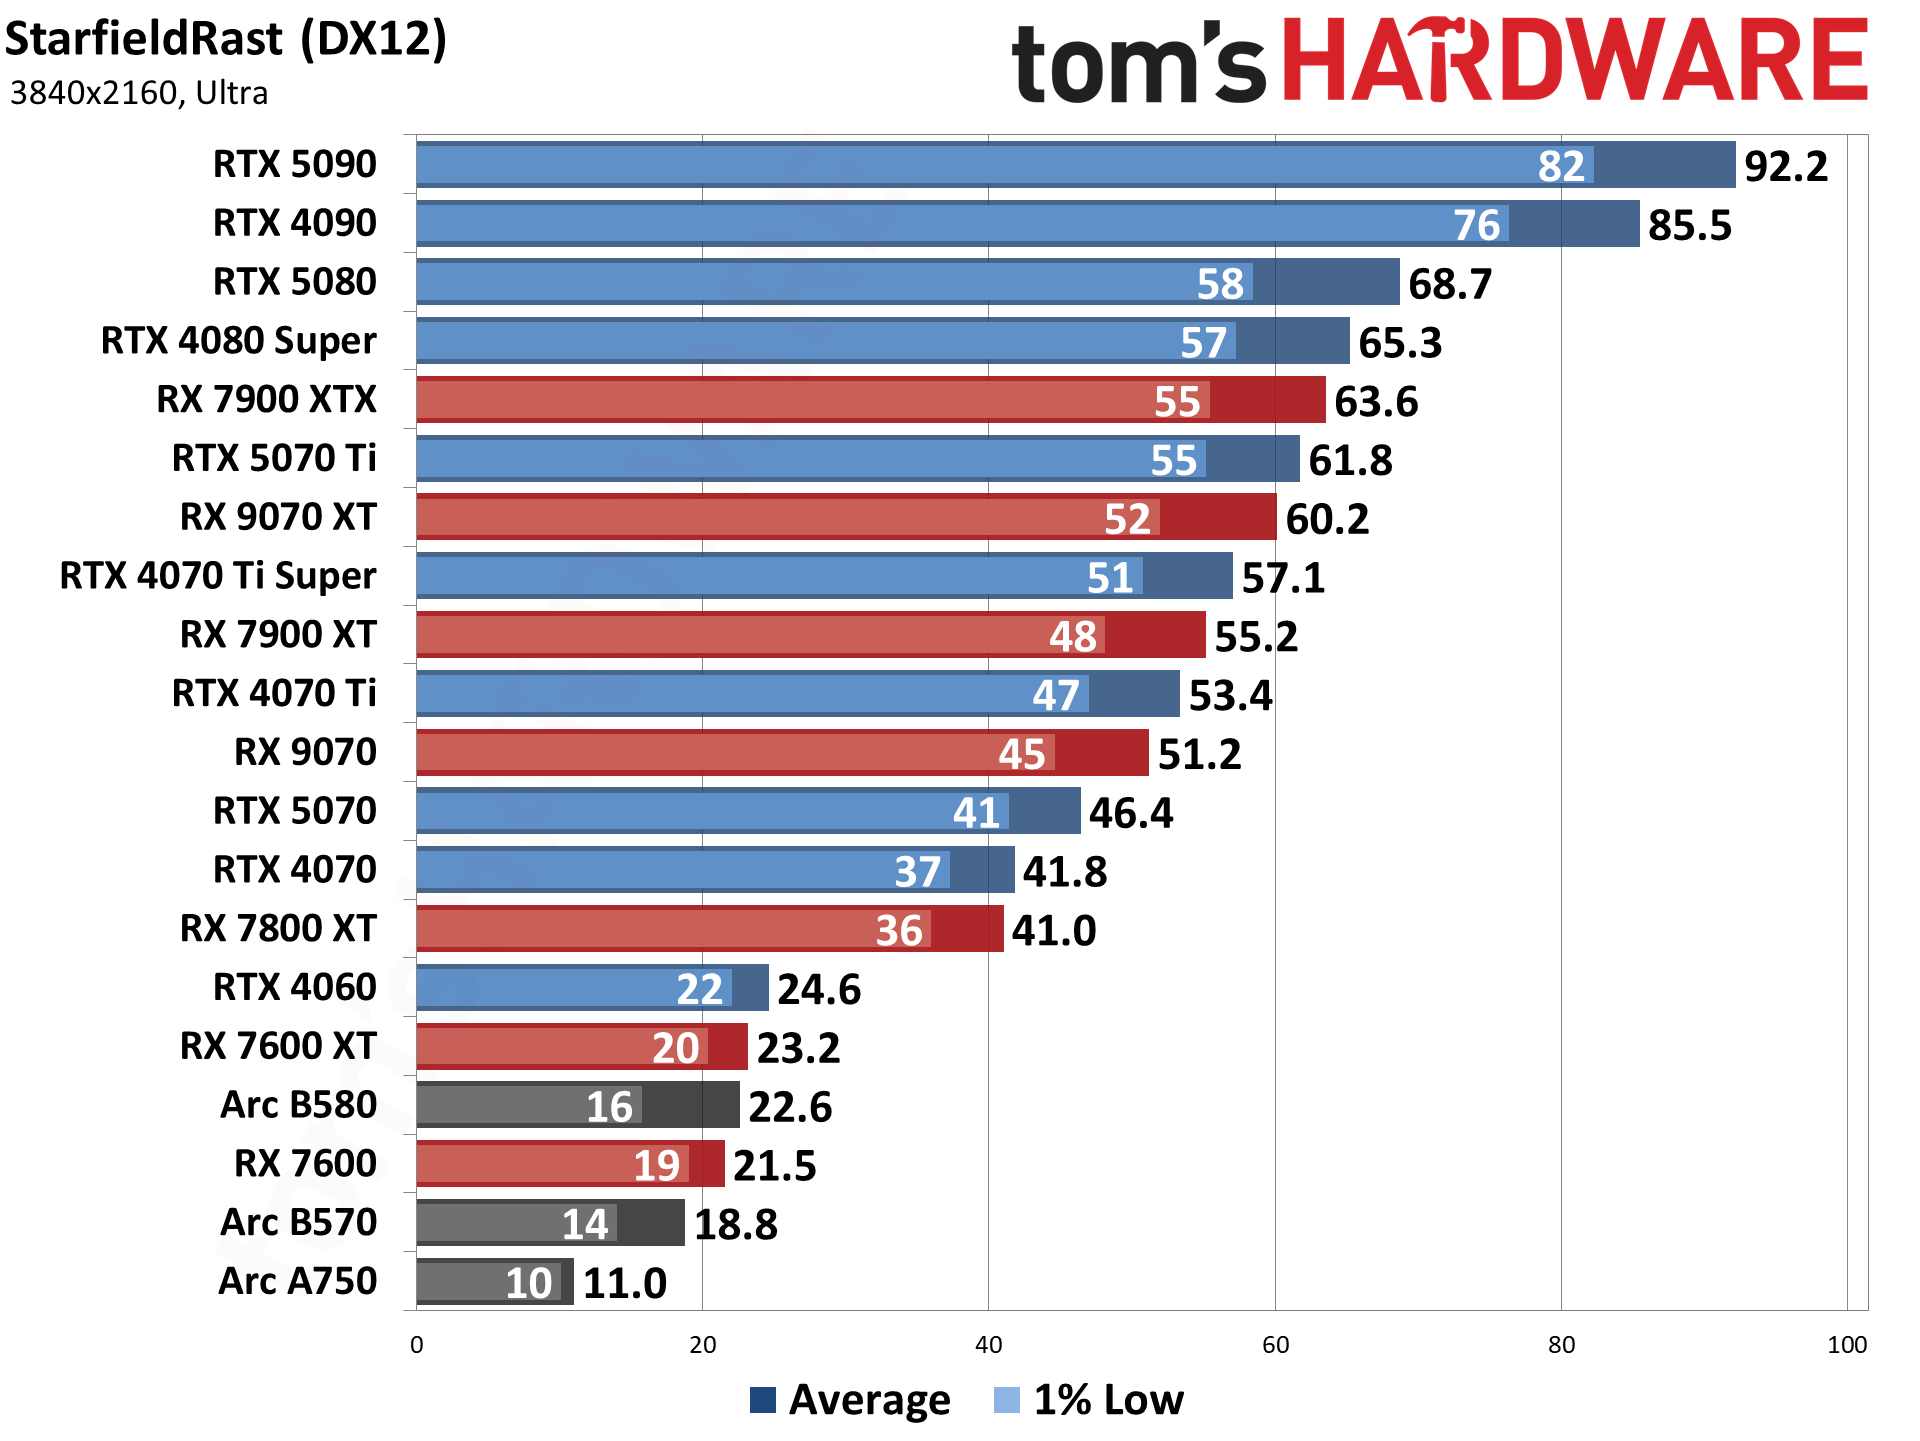
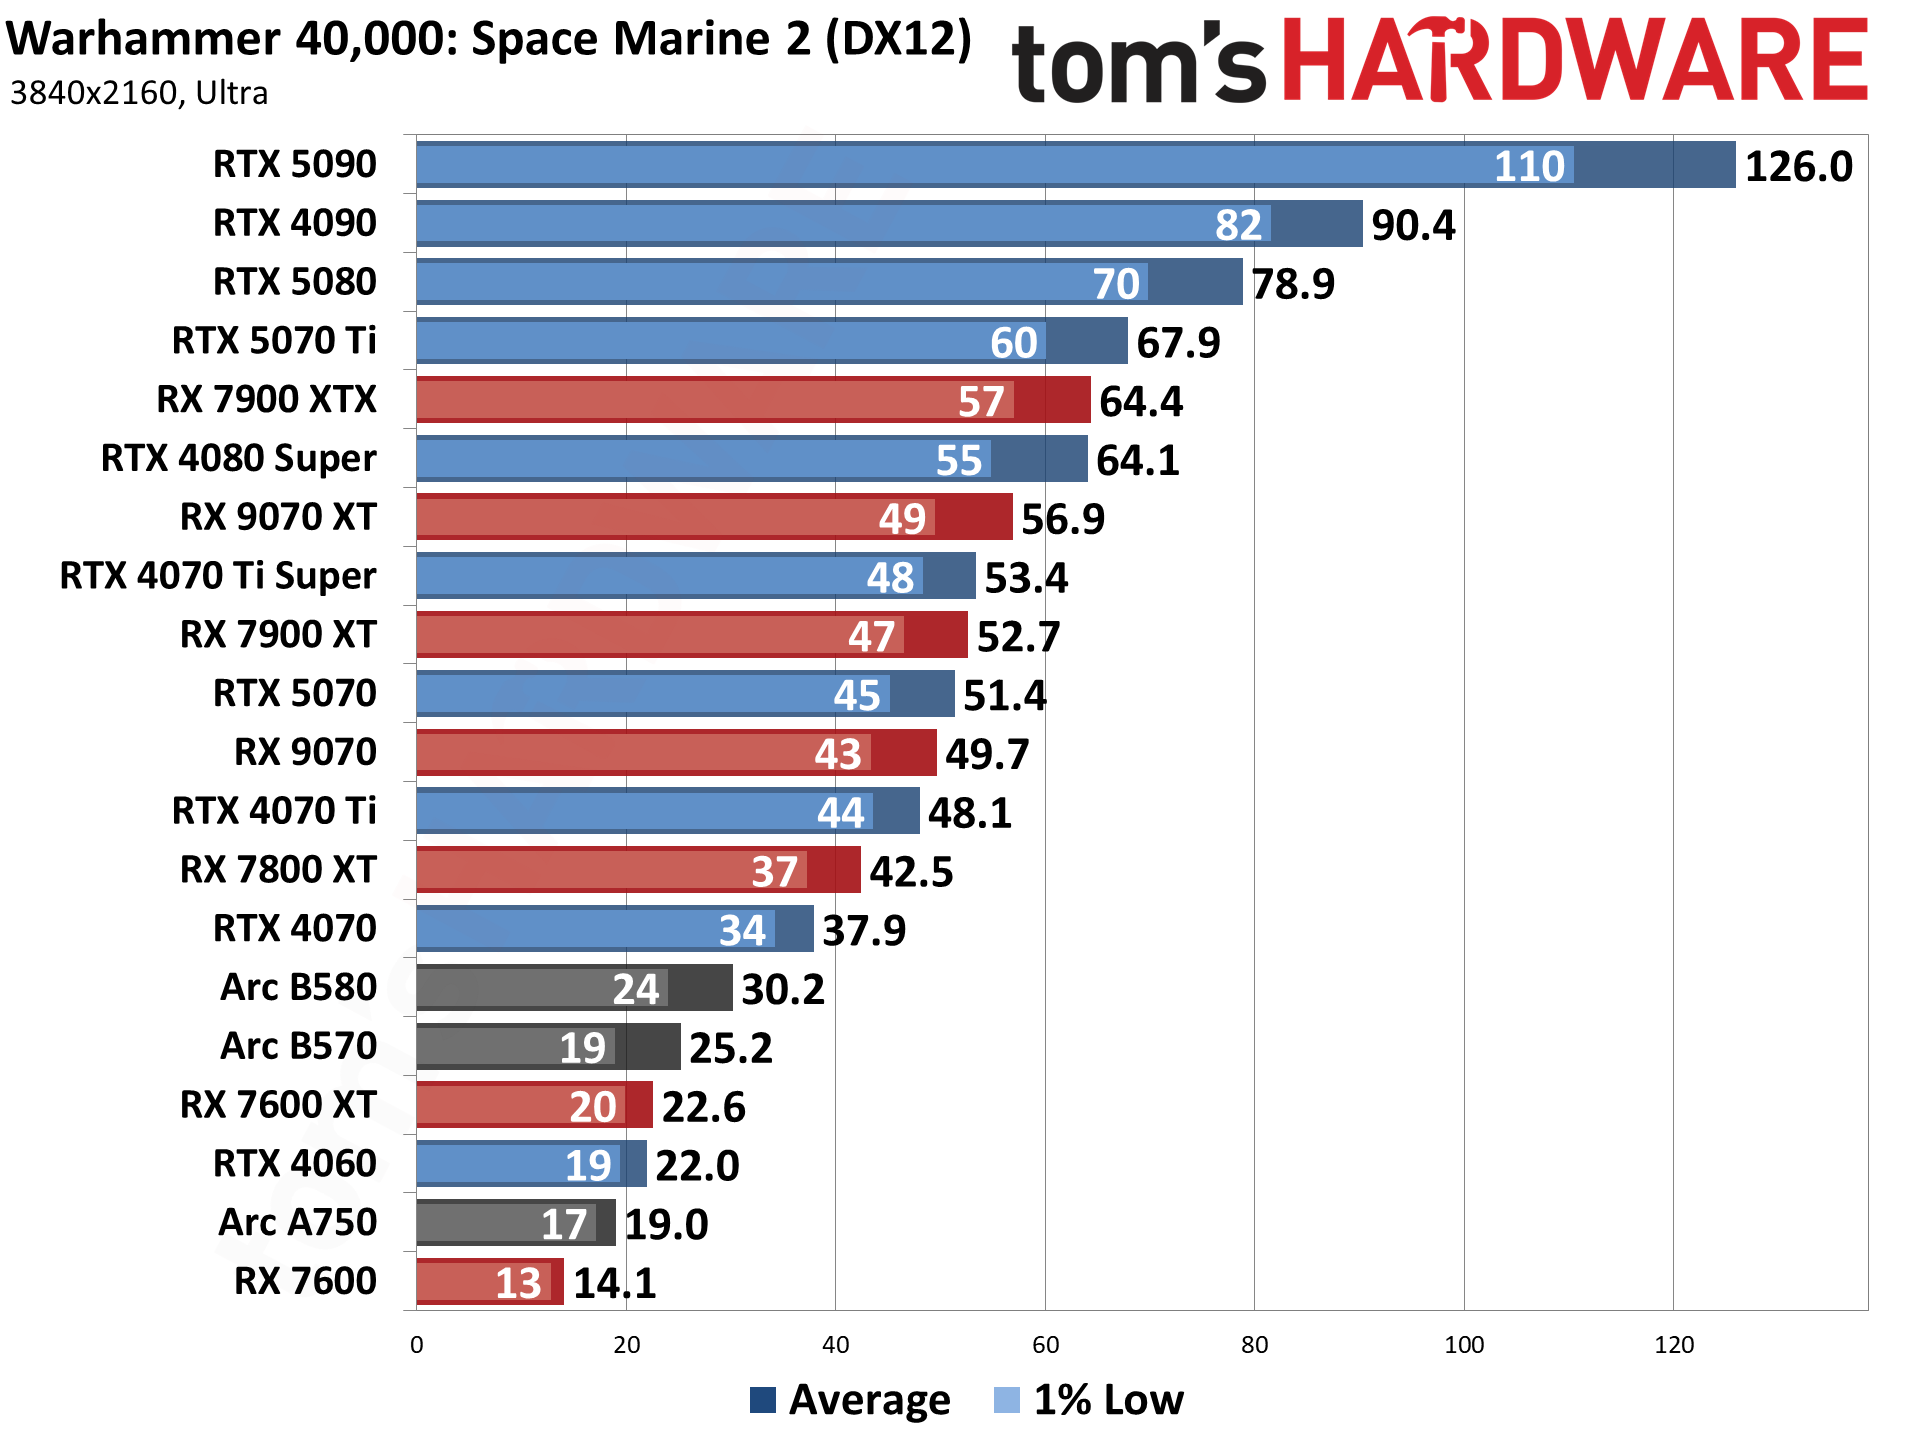
The above tables provide a summary of performance, but for those that want to see the individual game charts, for both the standard and ray tracing test suites, we’ve got those as well. We’re only including more recent GPUs in these charts, as otherwise things get very messy.
These charts are up to date as of March 31, 2025.
GPU Benchmarks — 1080p Medium
GPU Benchmarks — 1080p Ultra
GPU Benchmarks — 1440p Ultra
GPU Benchmarks — 4K Ultra
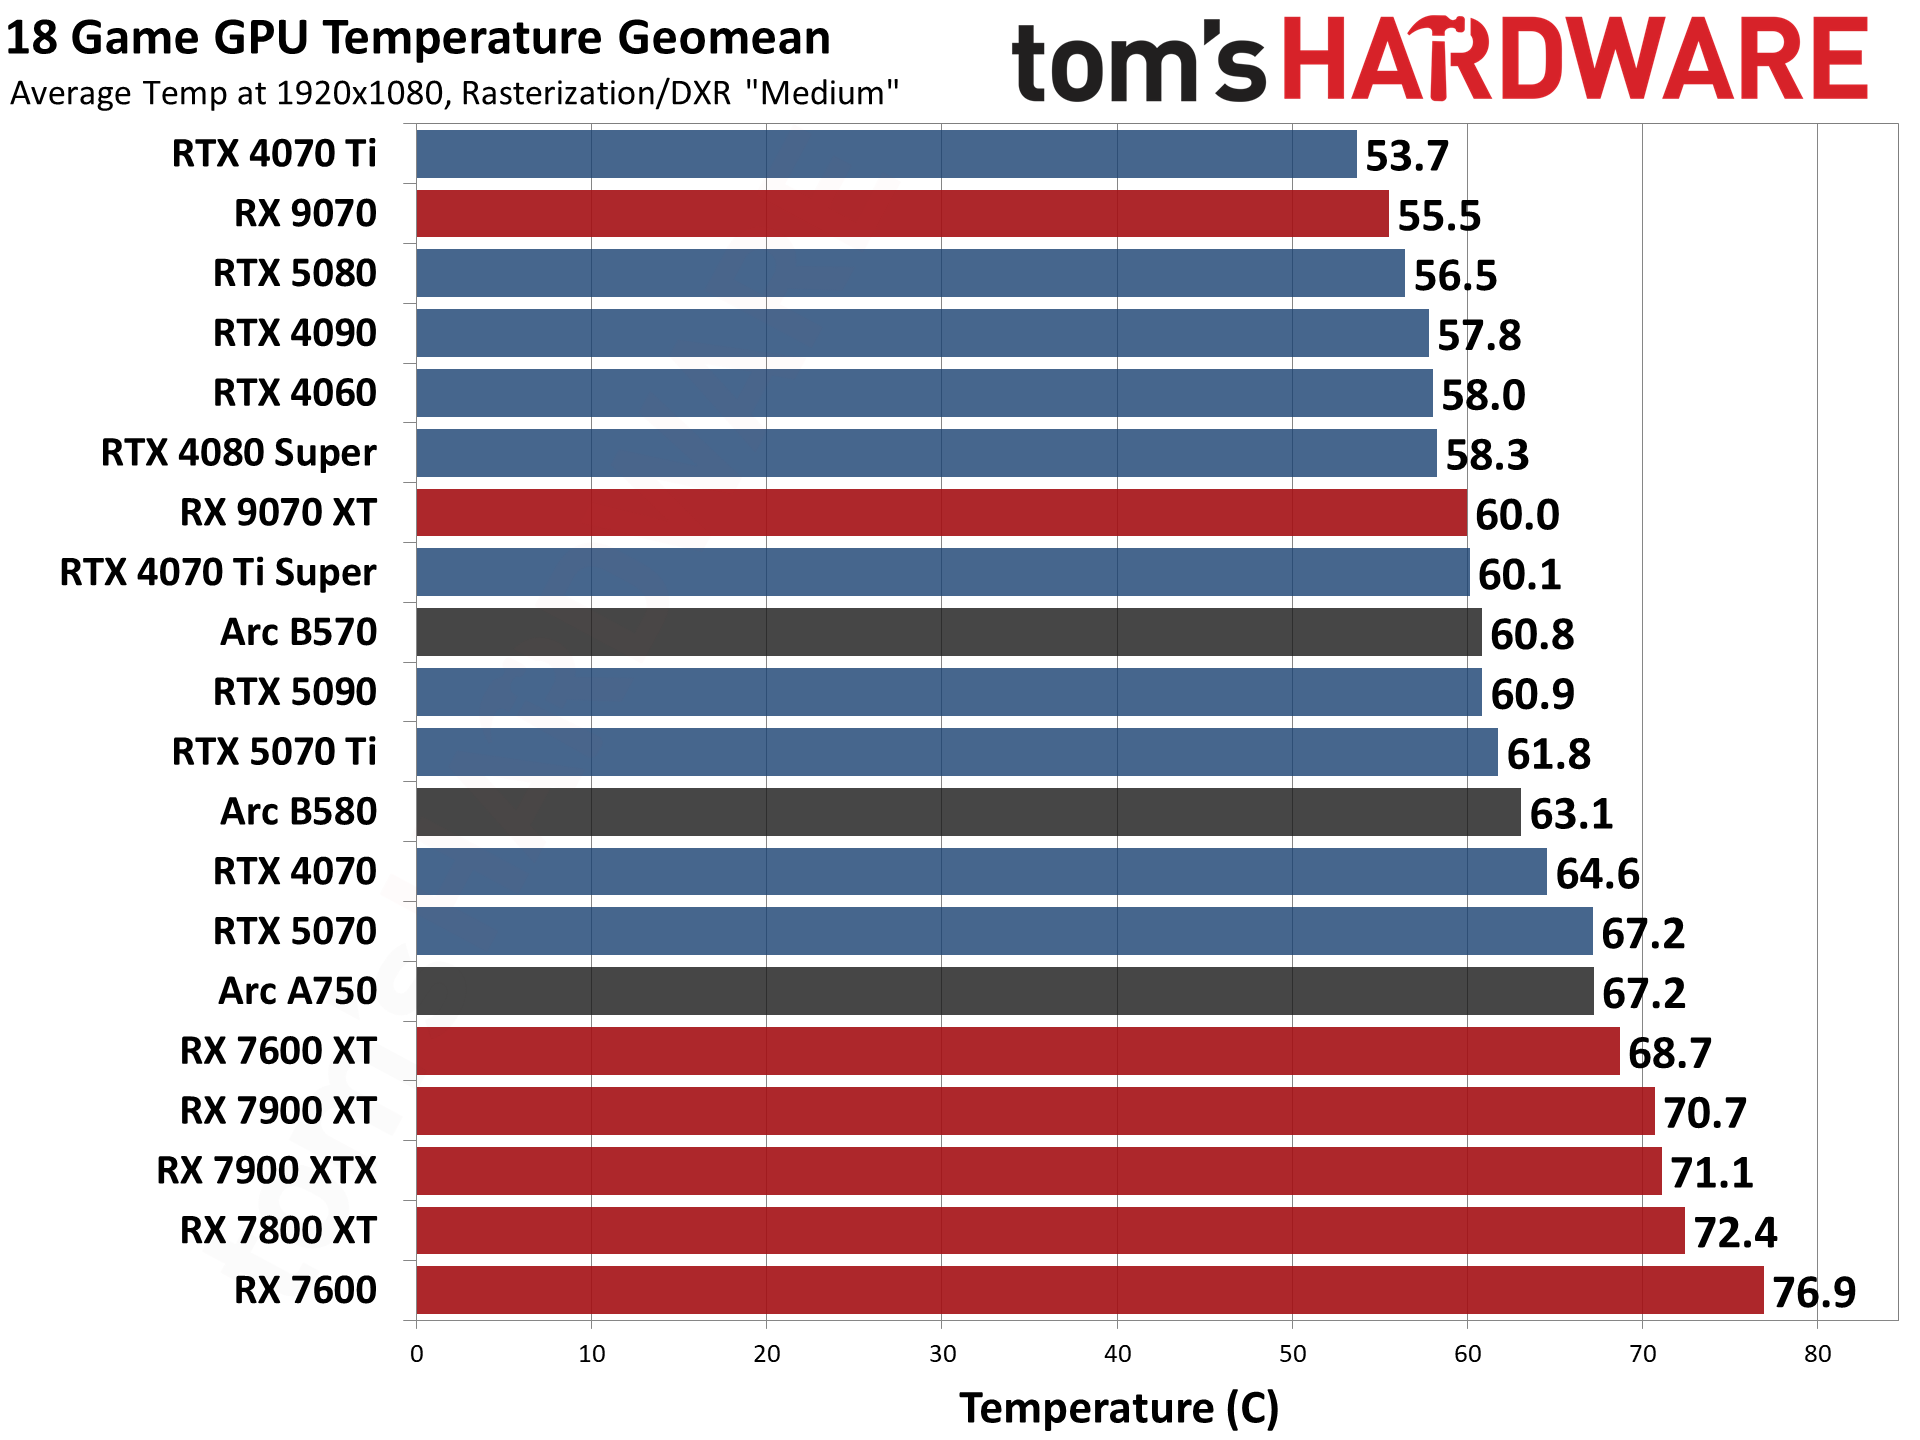
GPU Benchmarks — Power, Clocks, and Temperatures
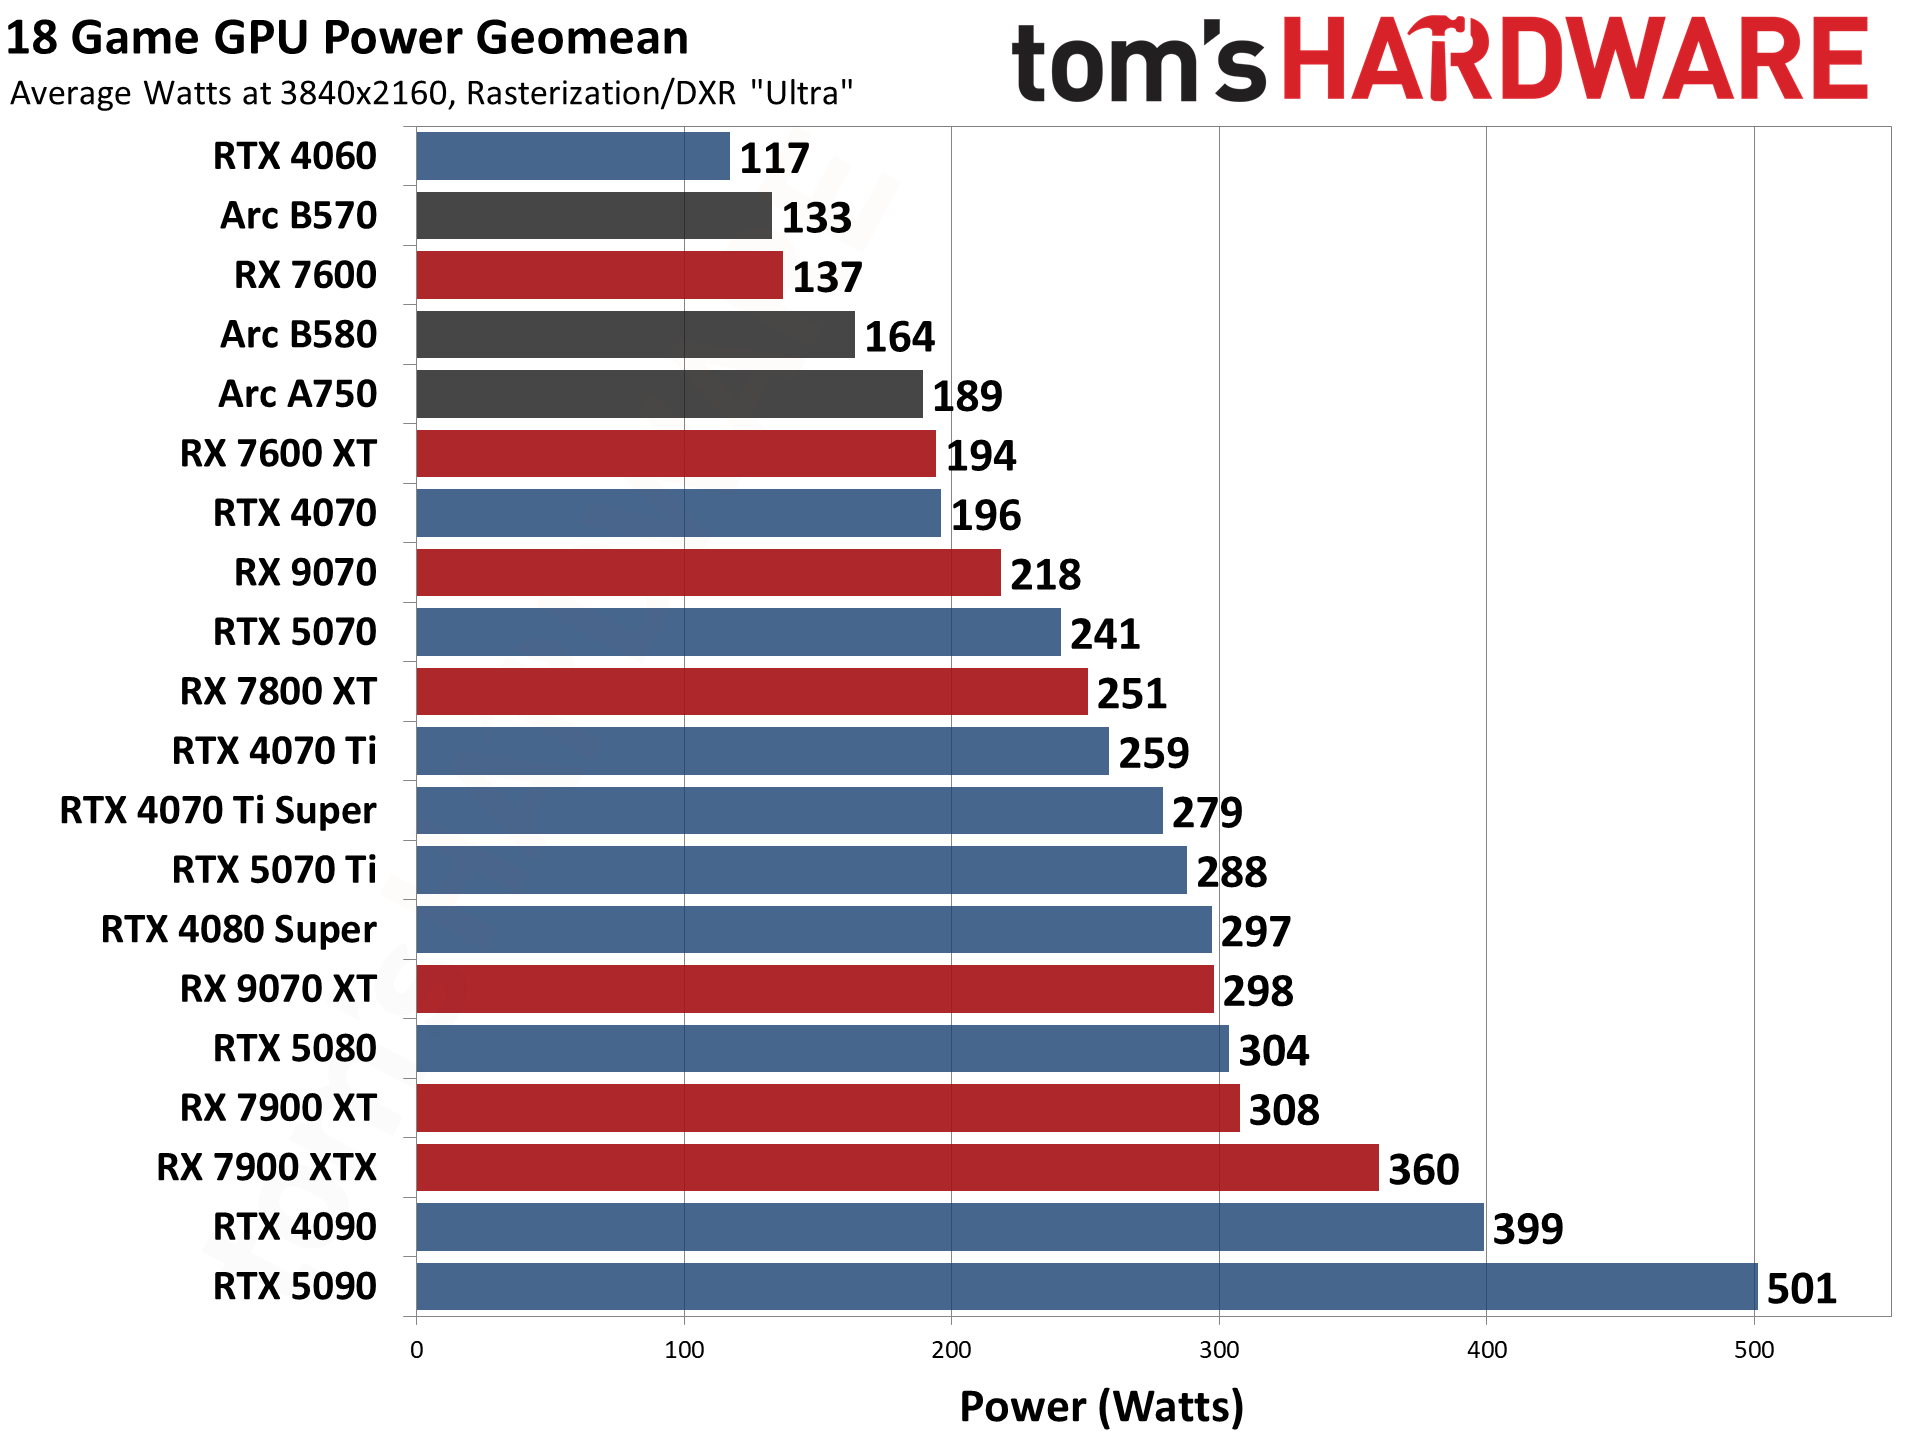
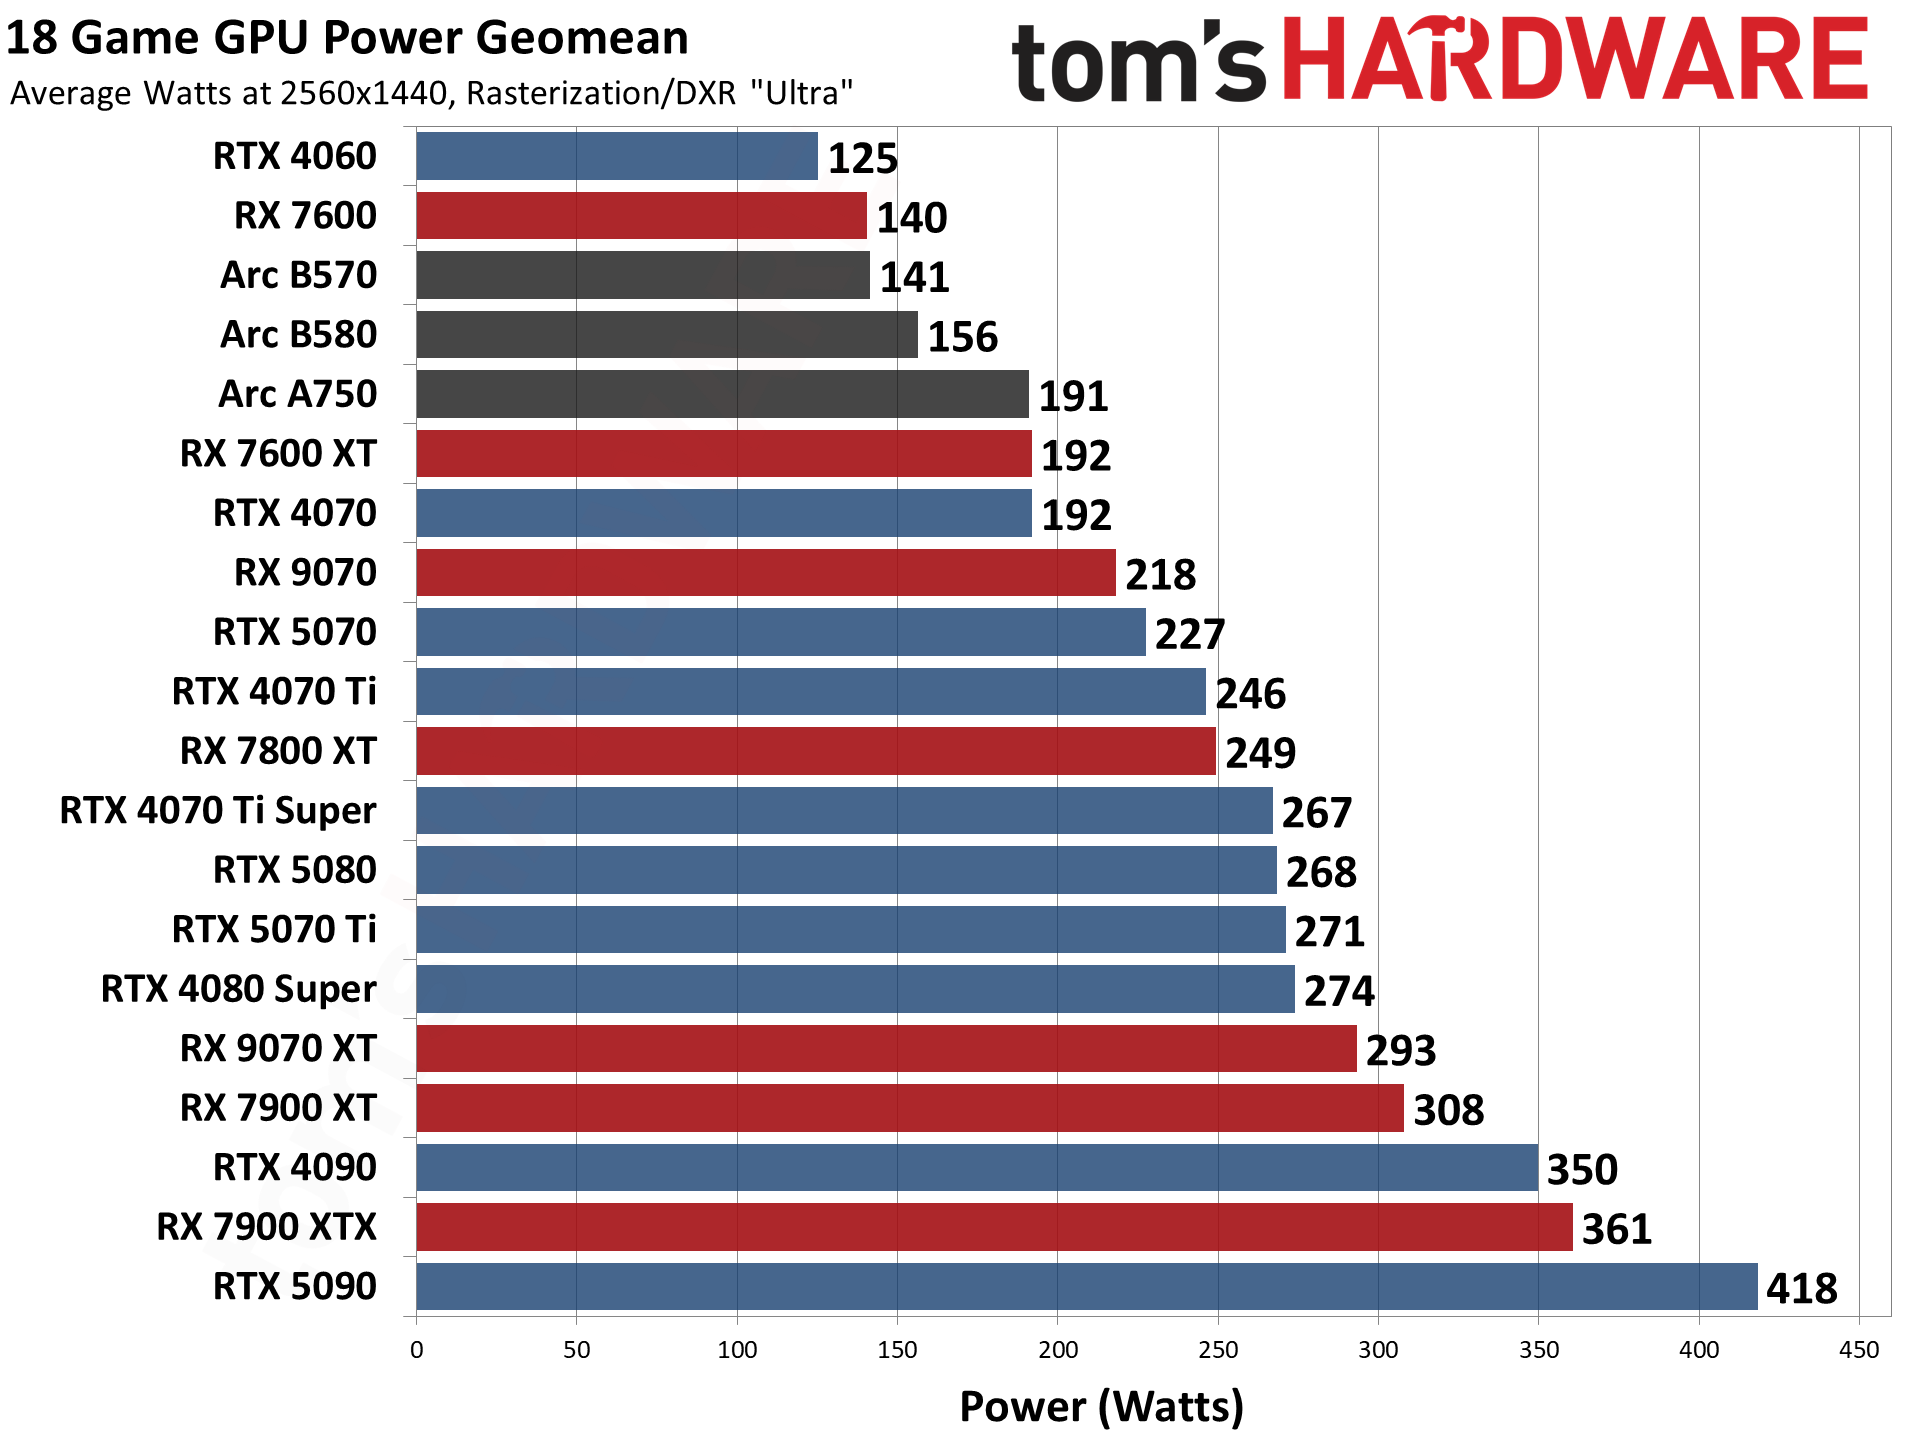
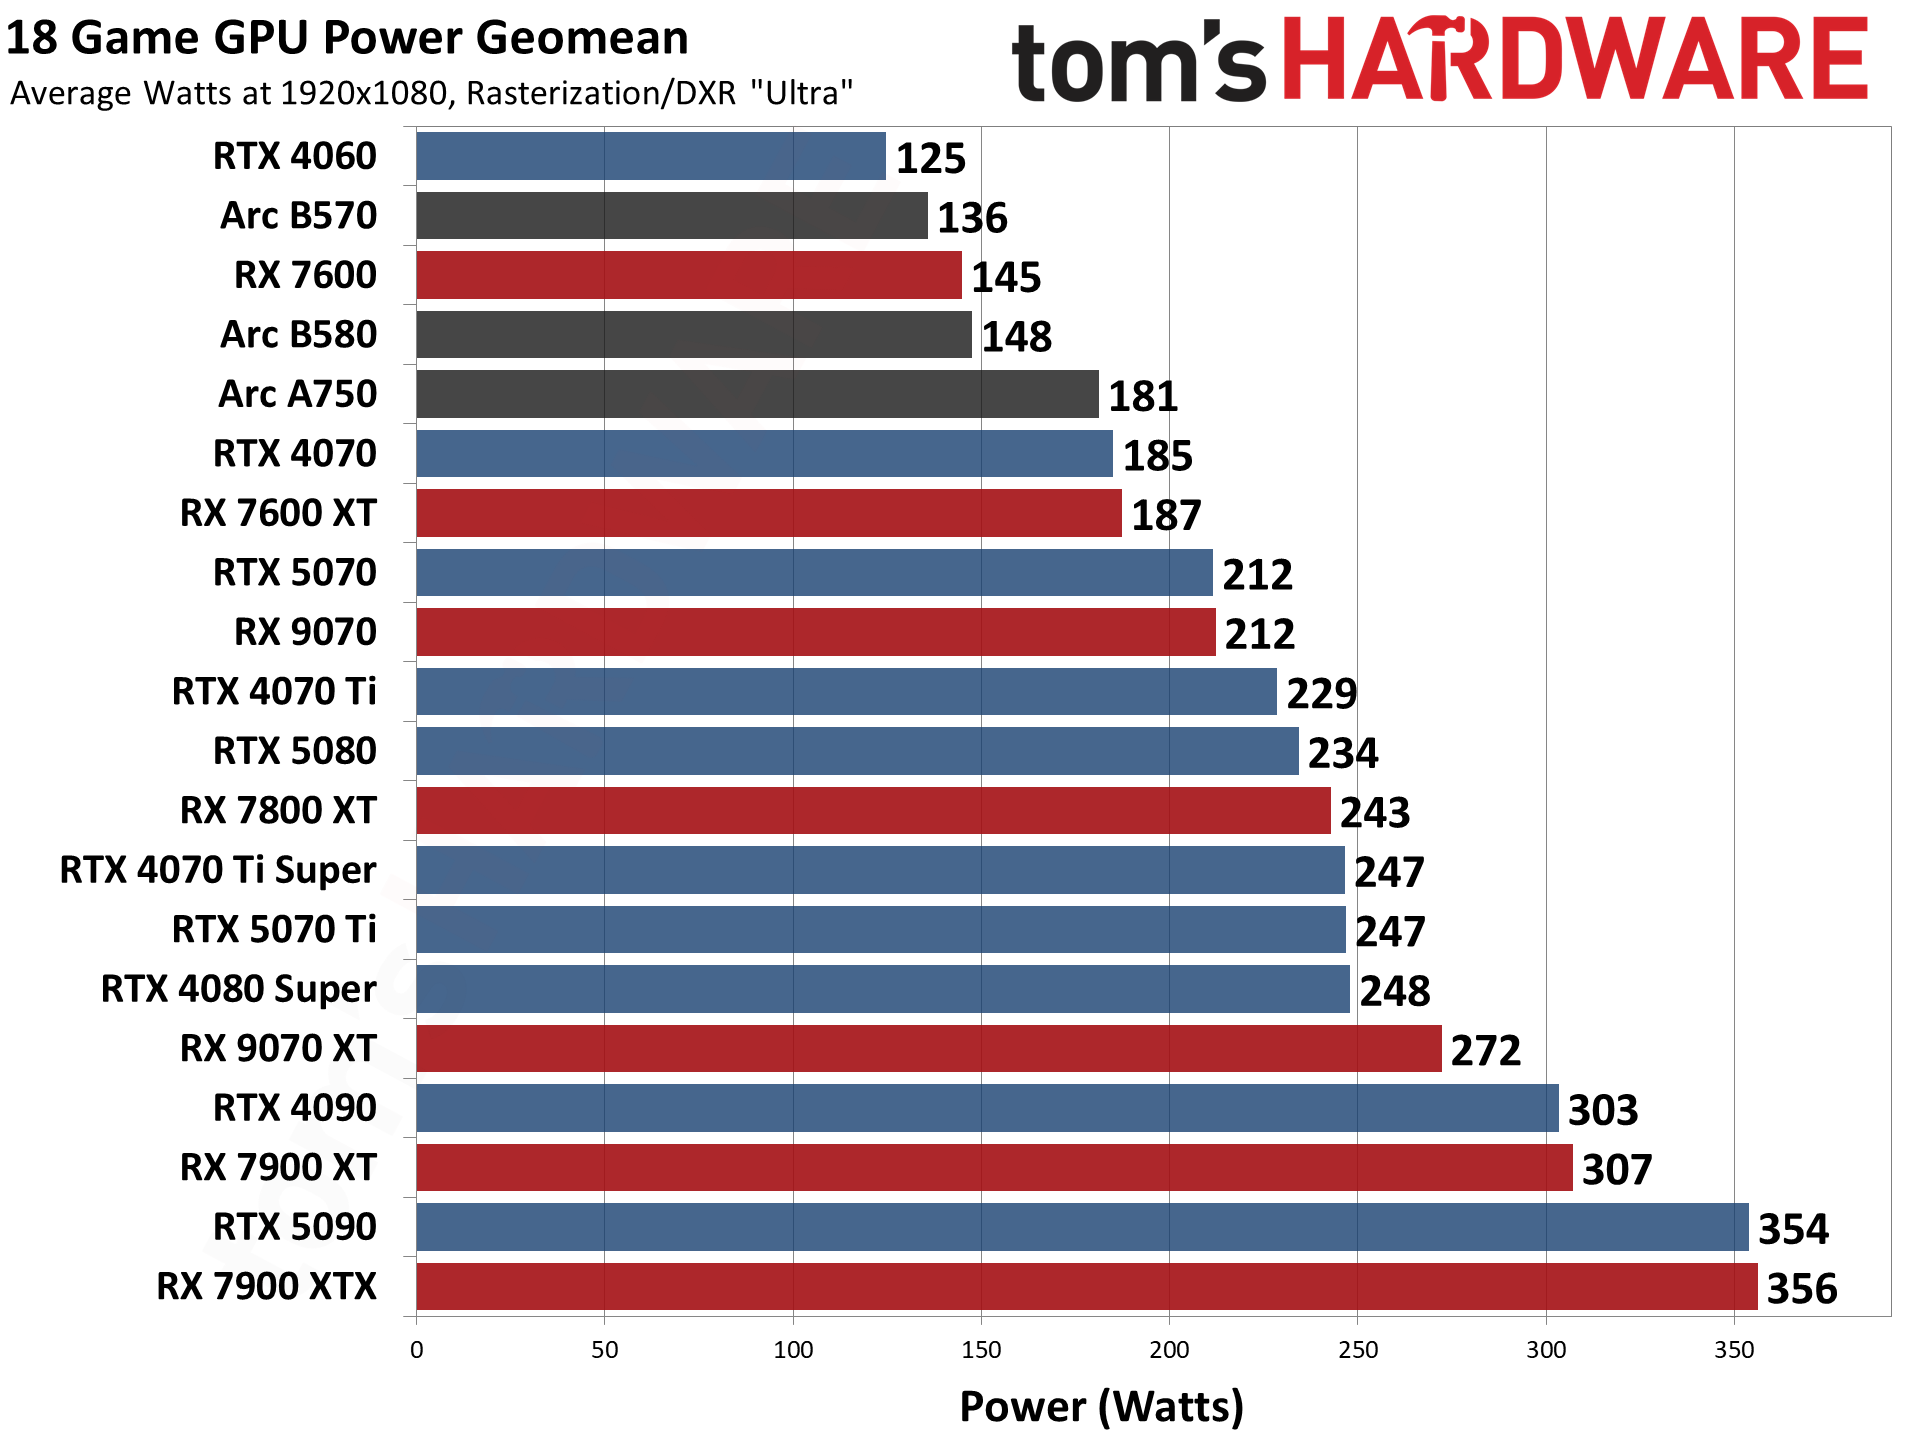
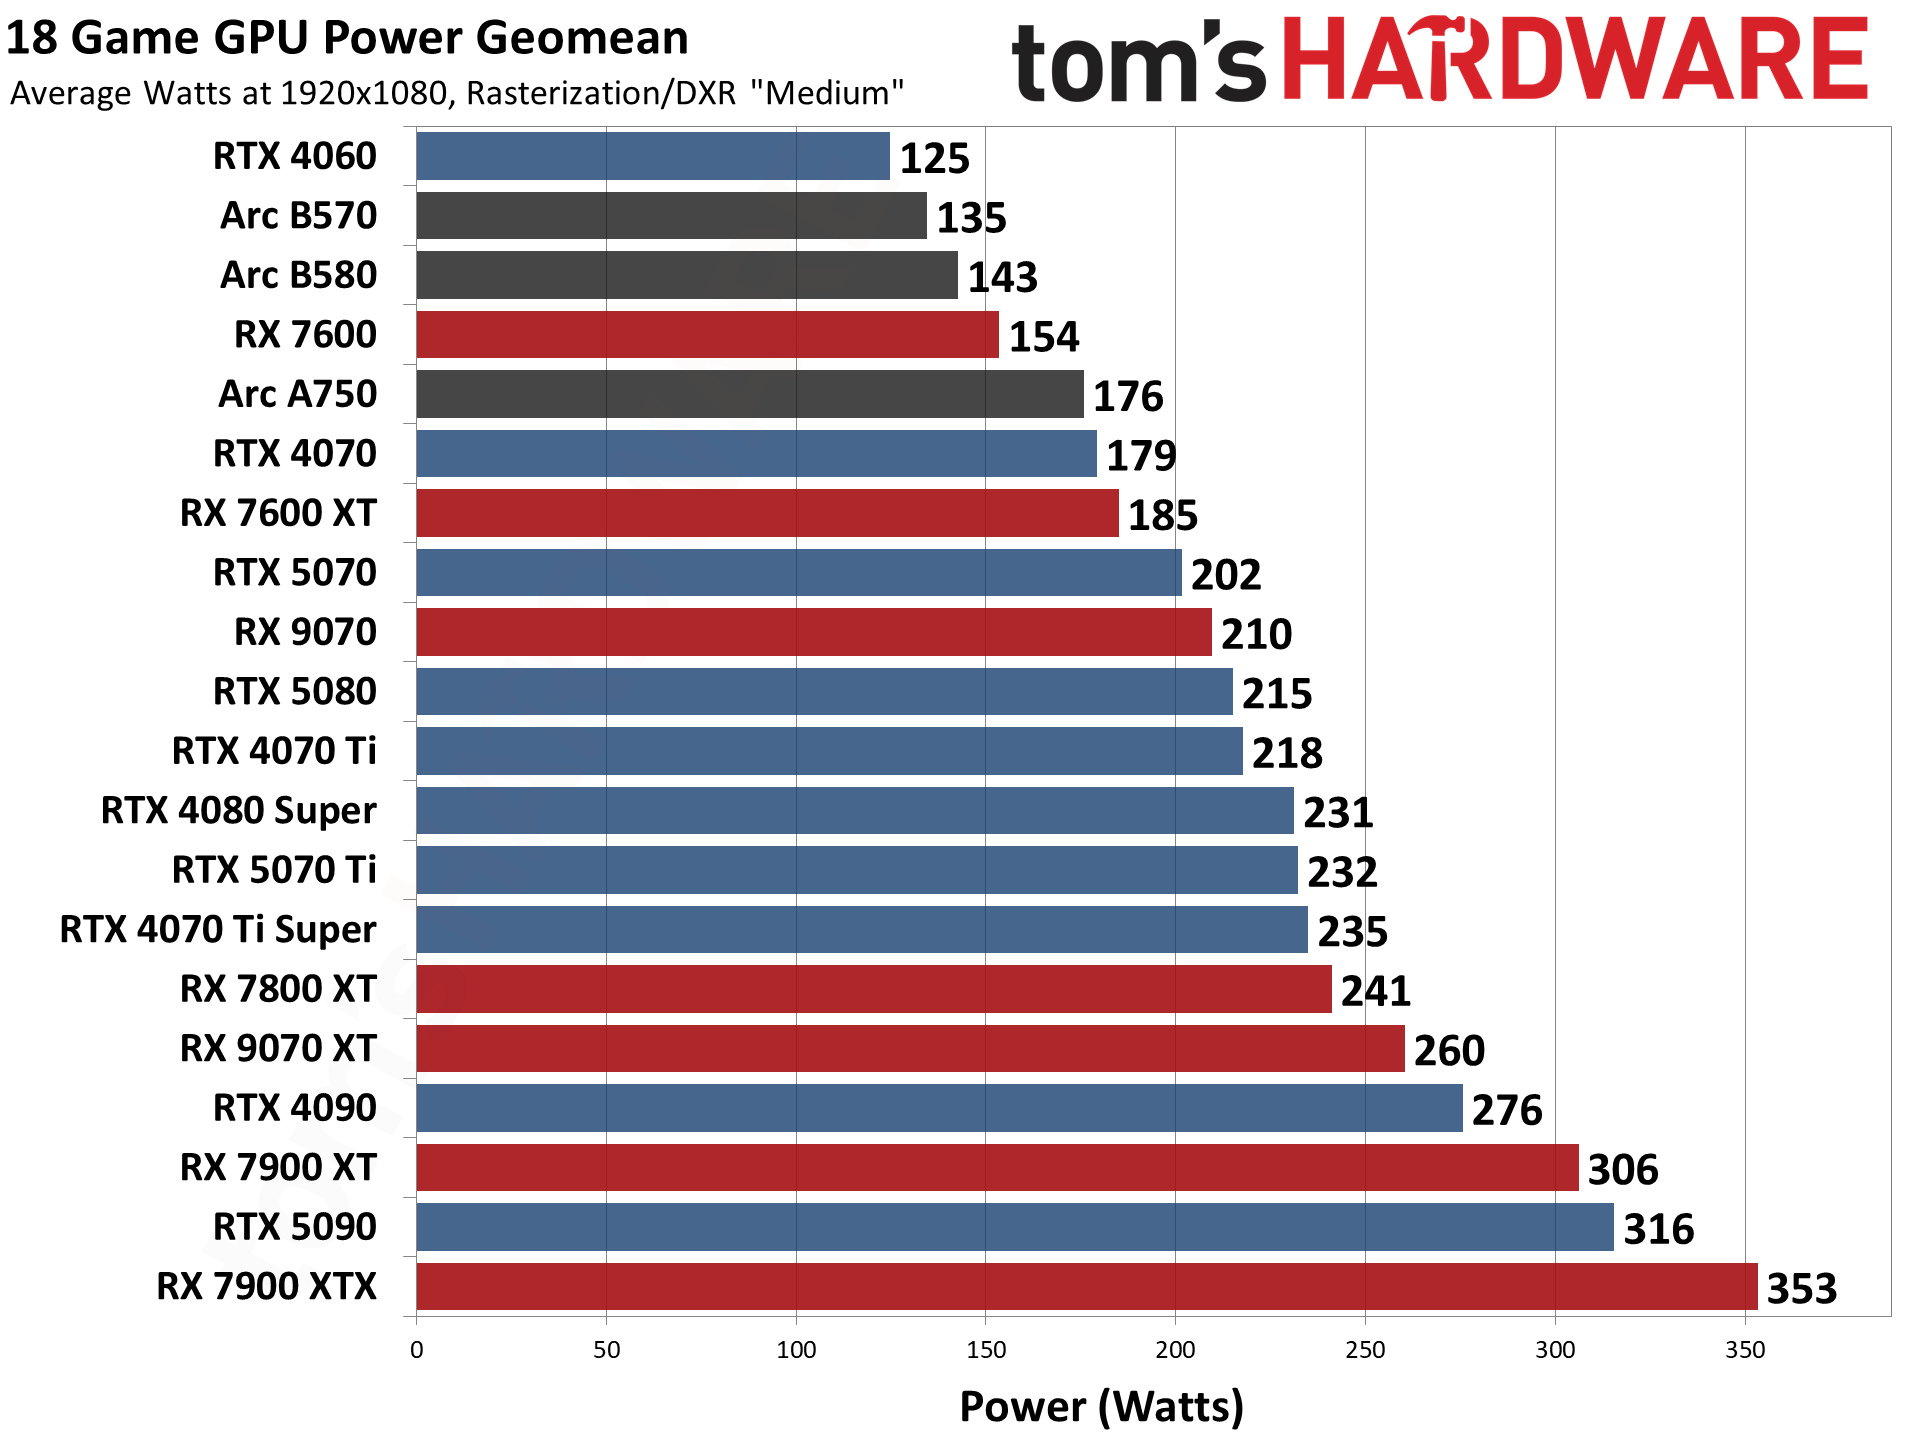
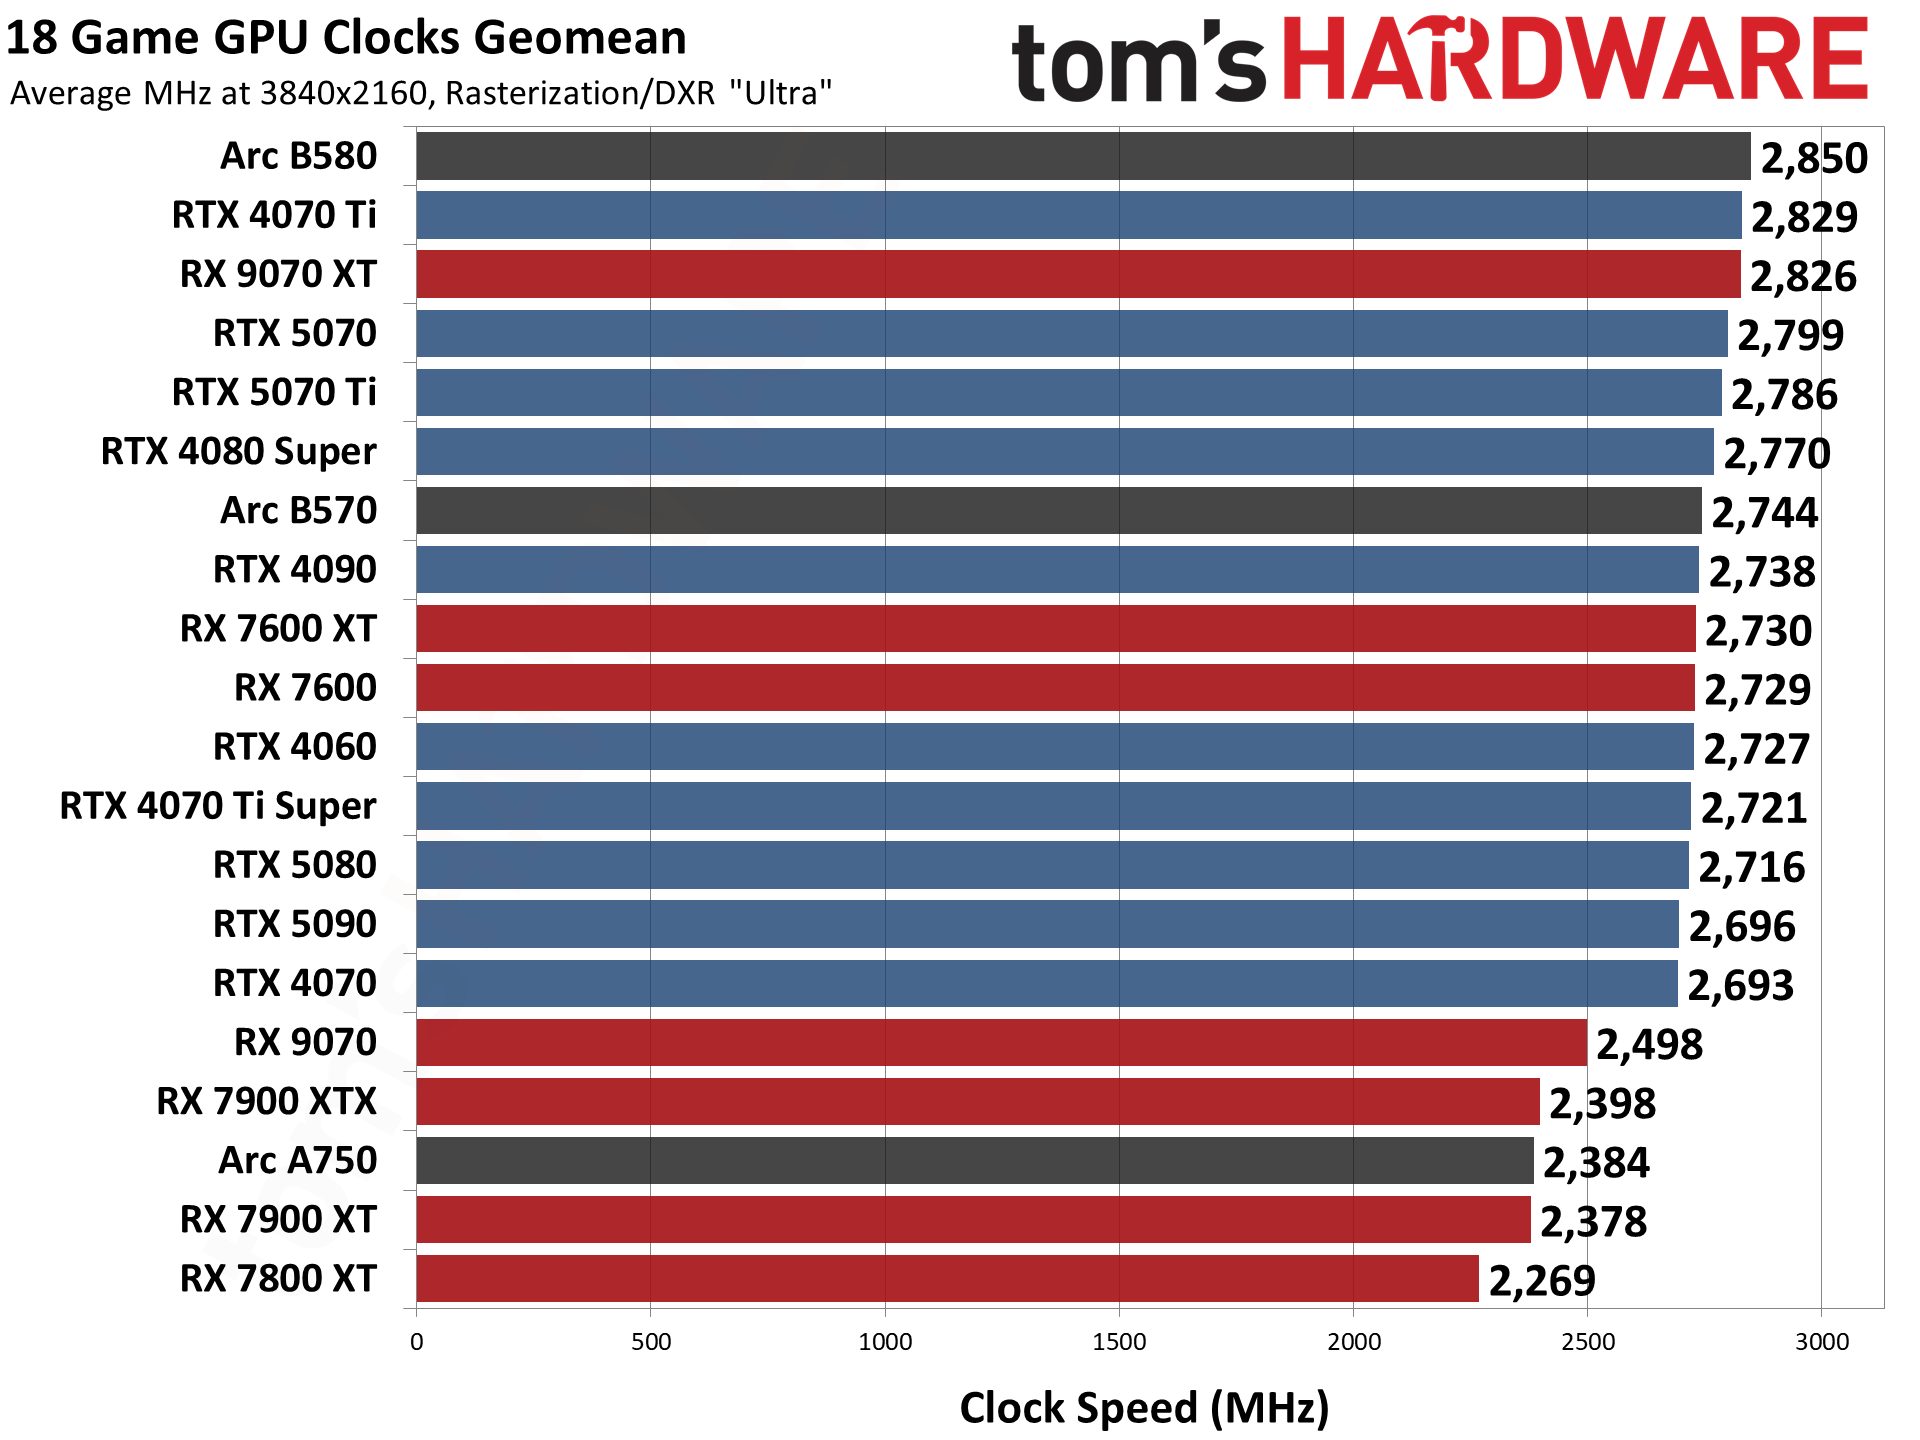
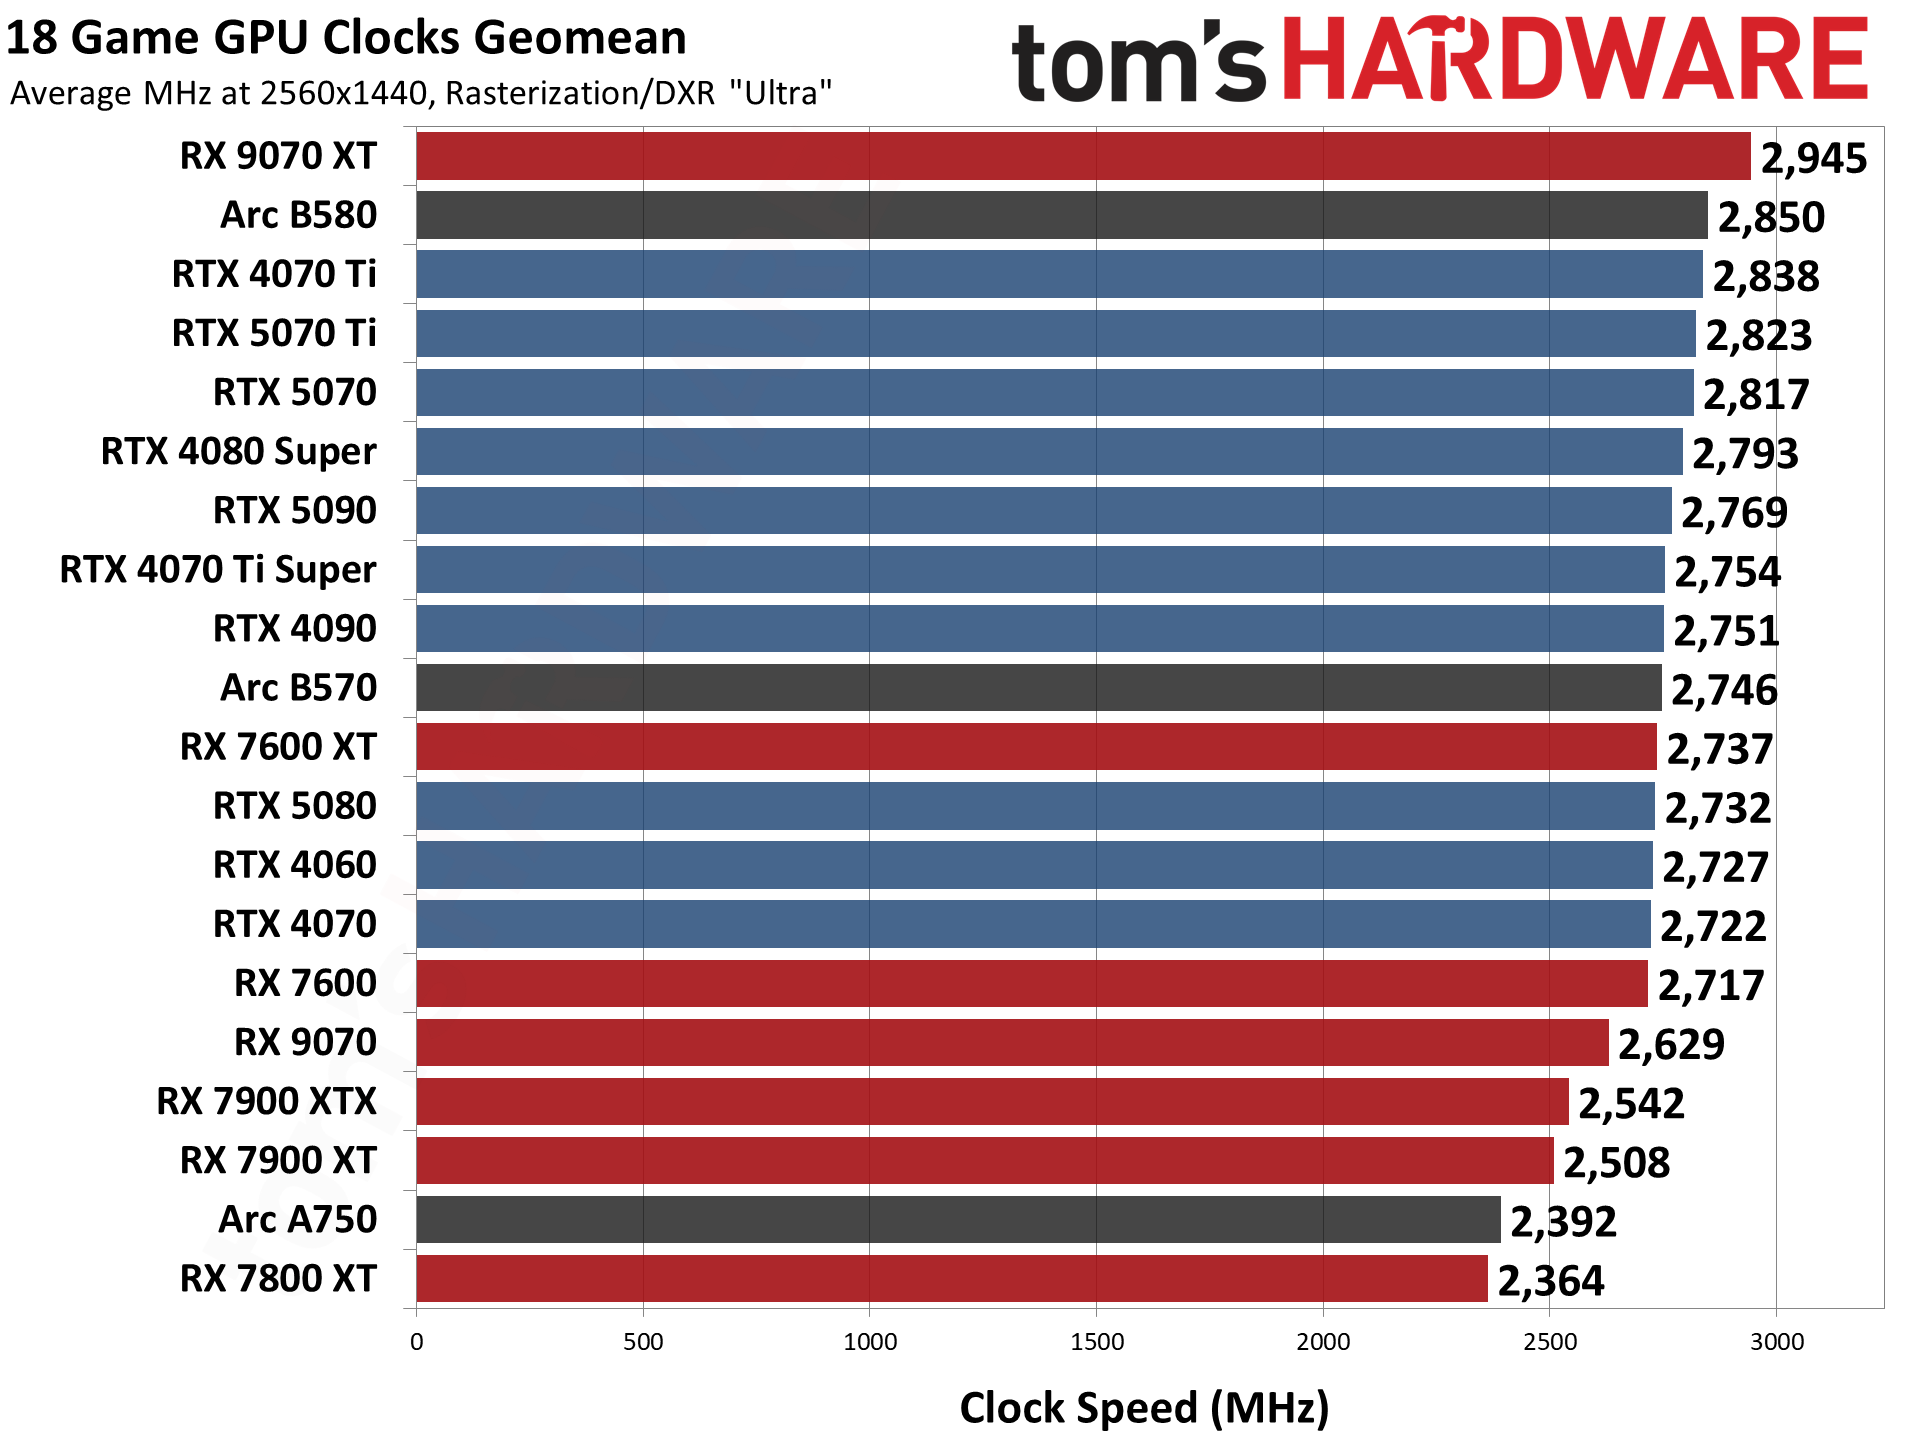
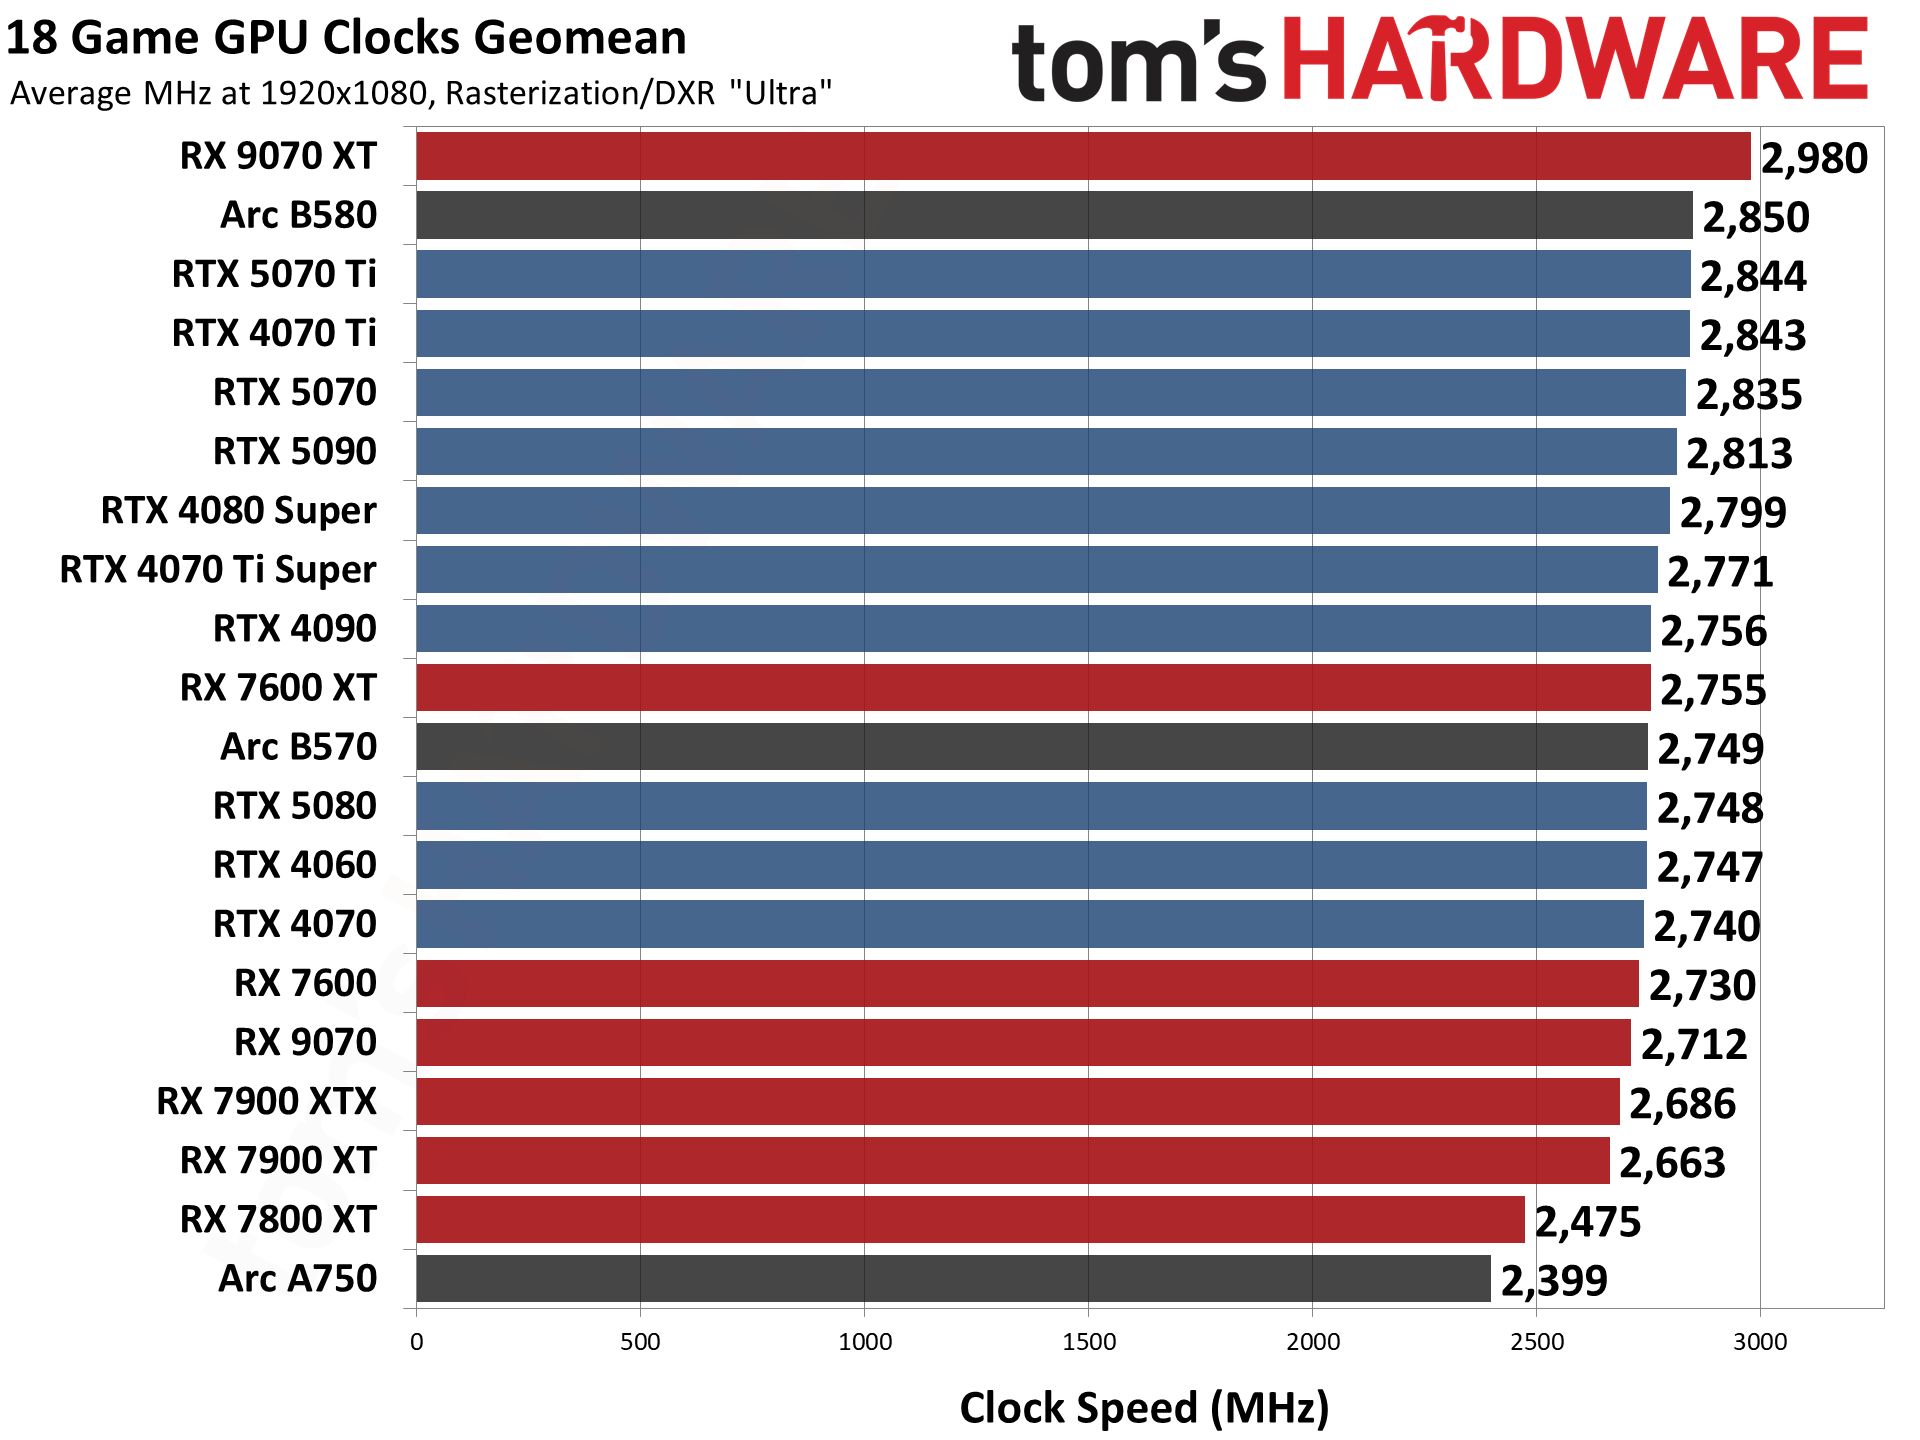
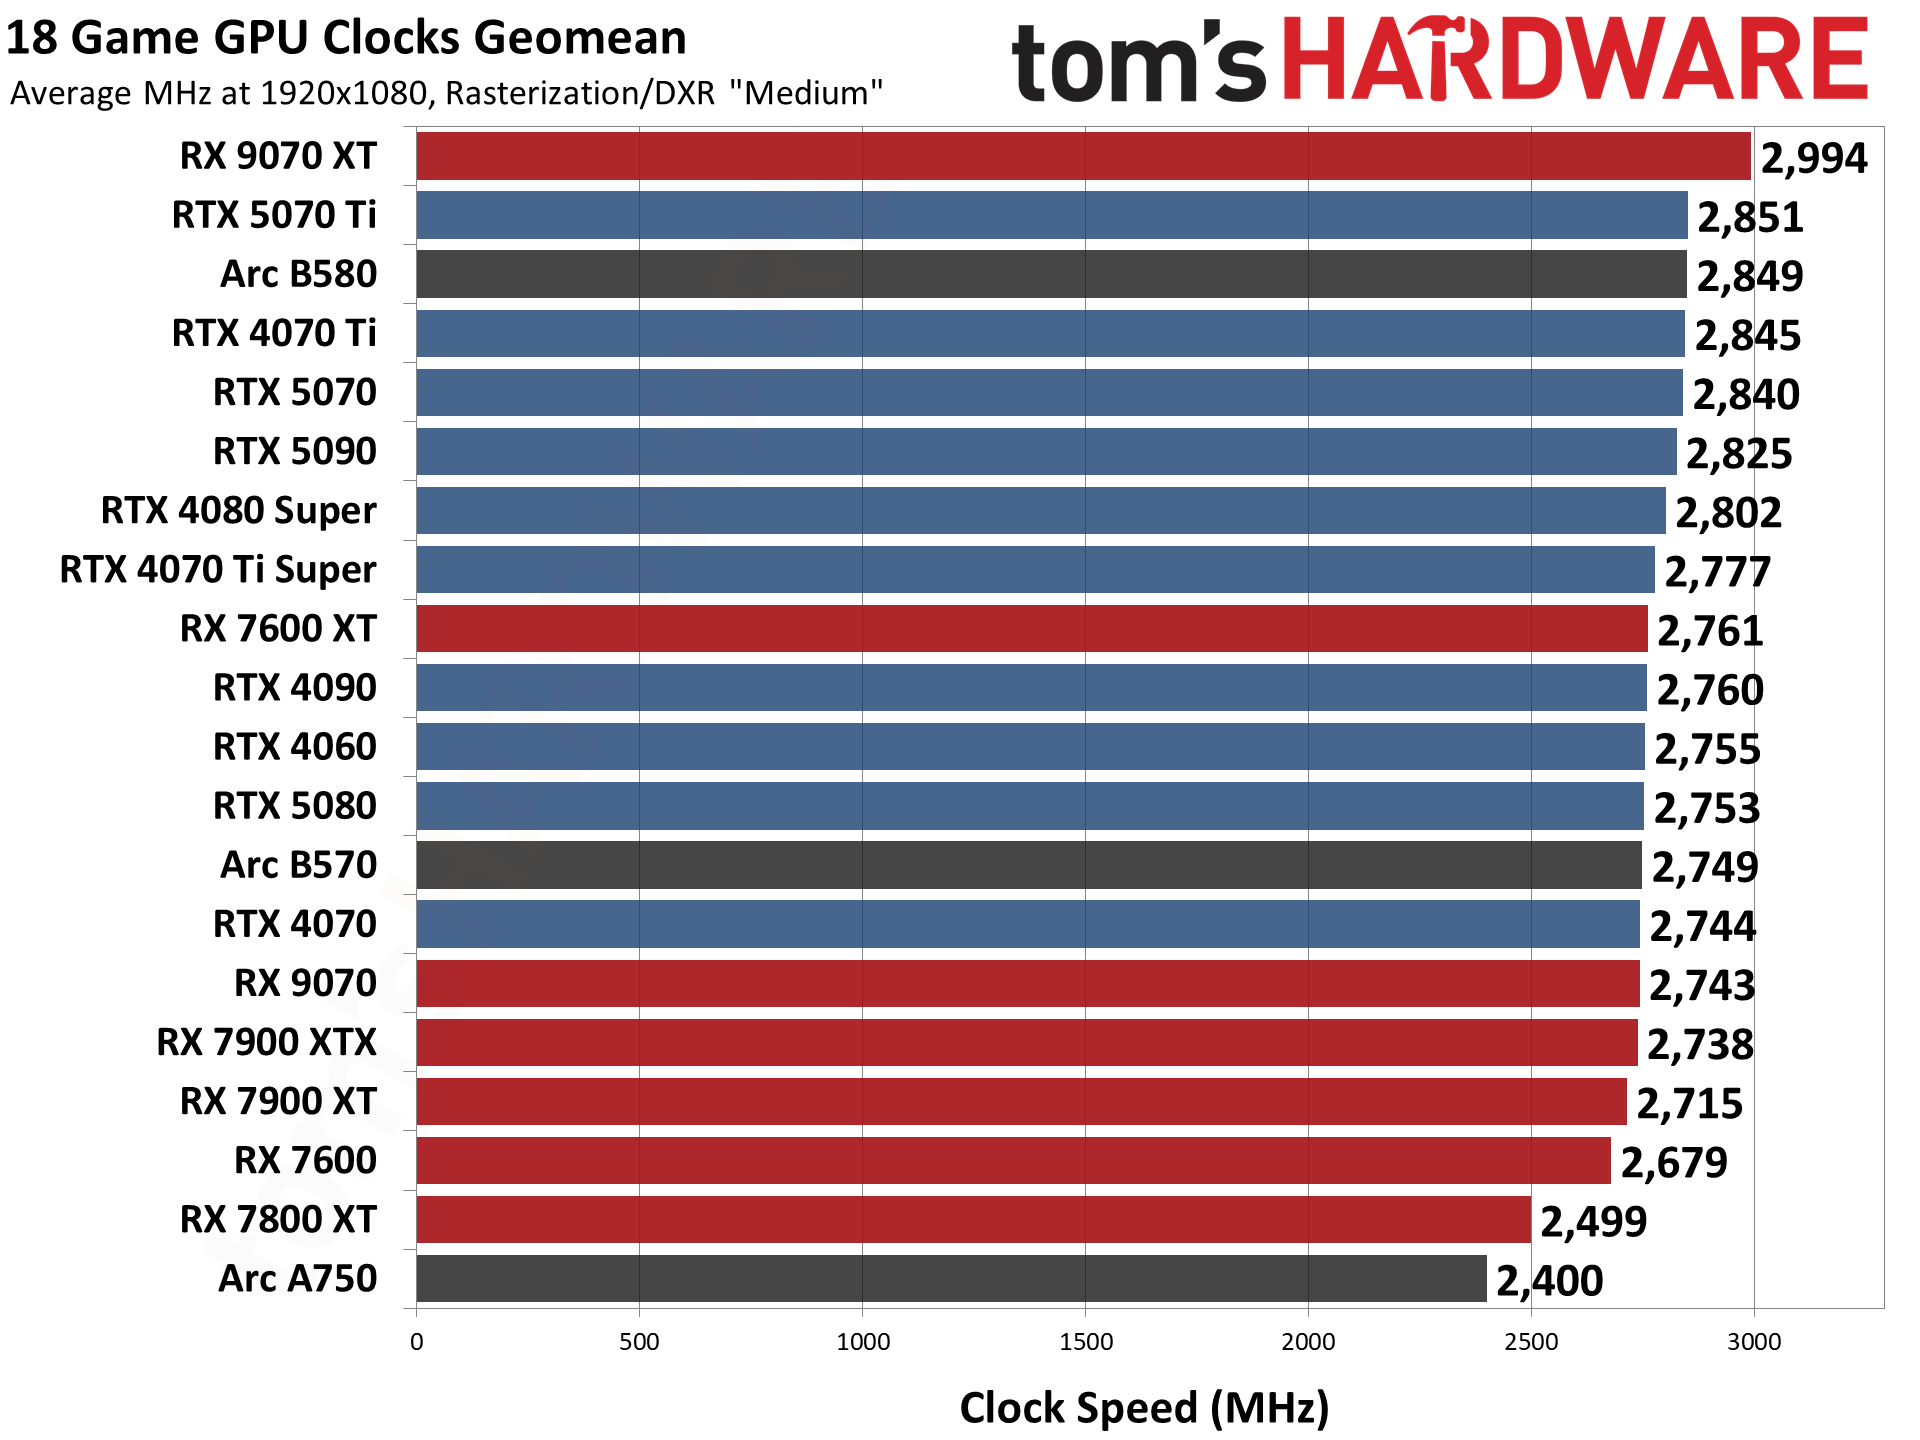
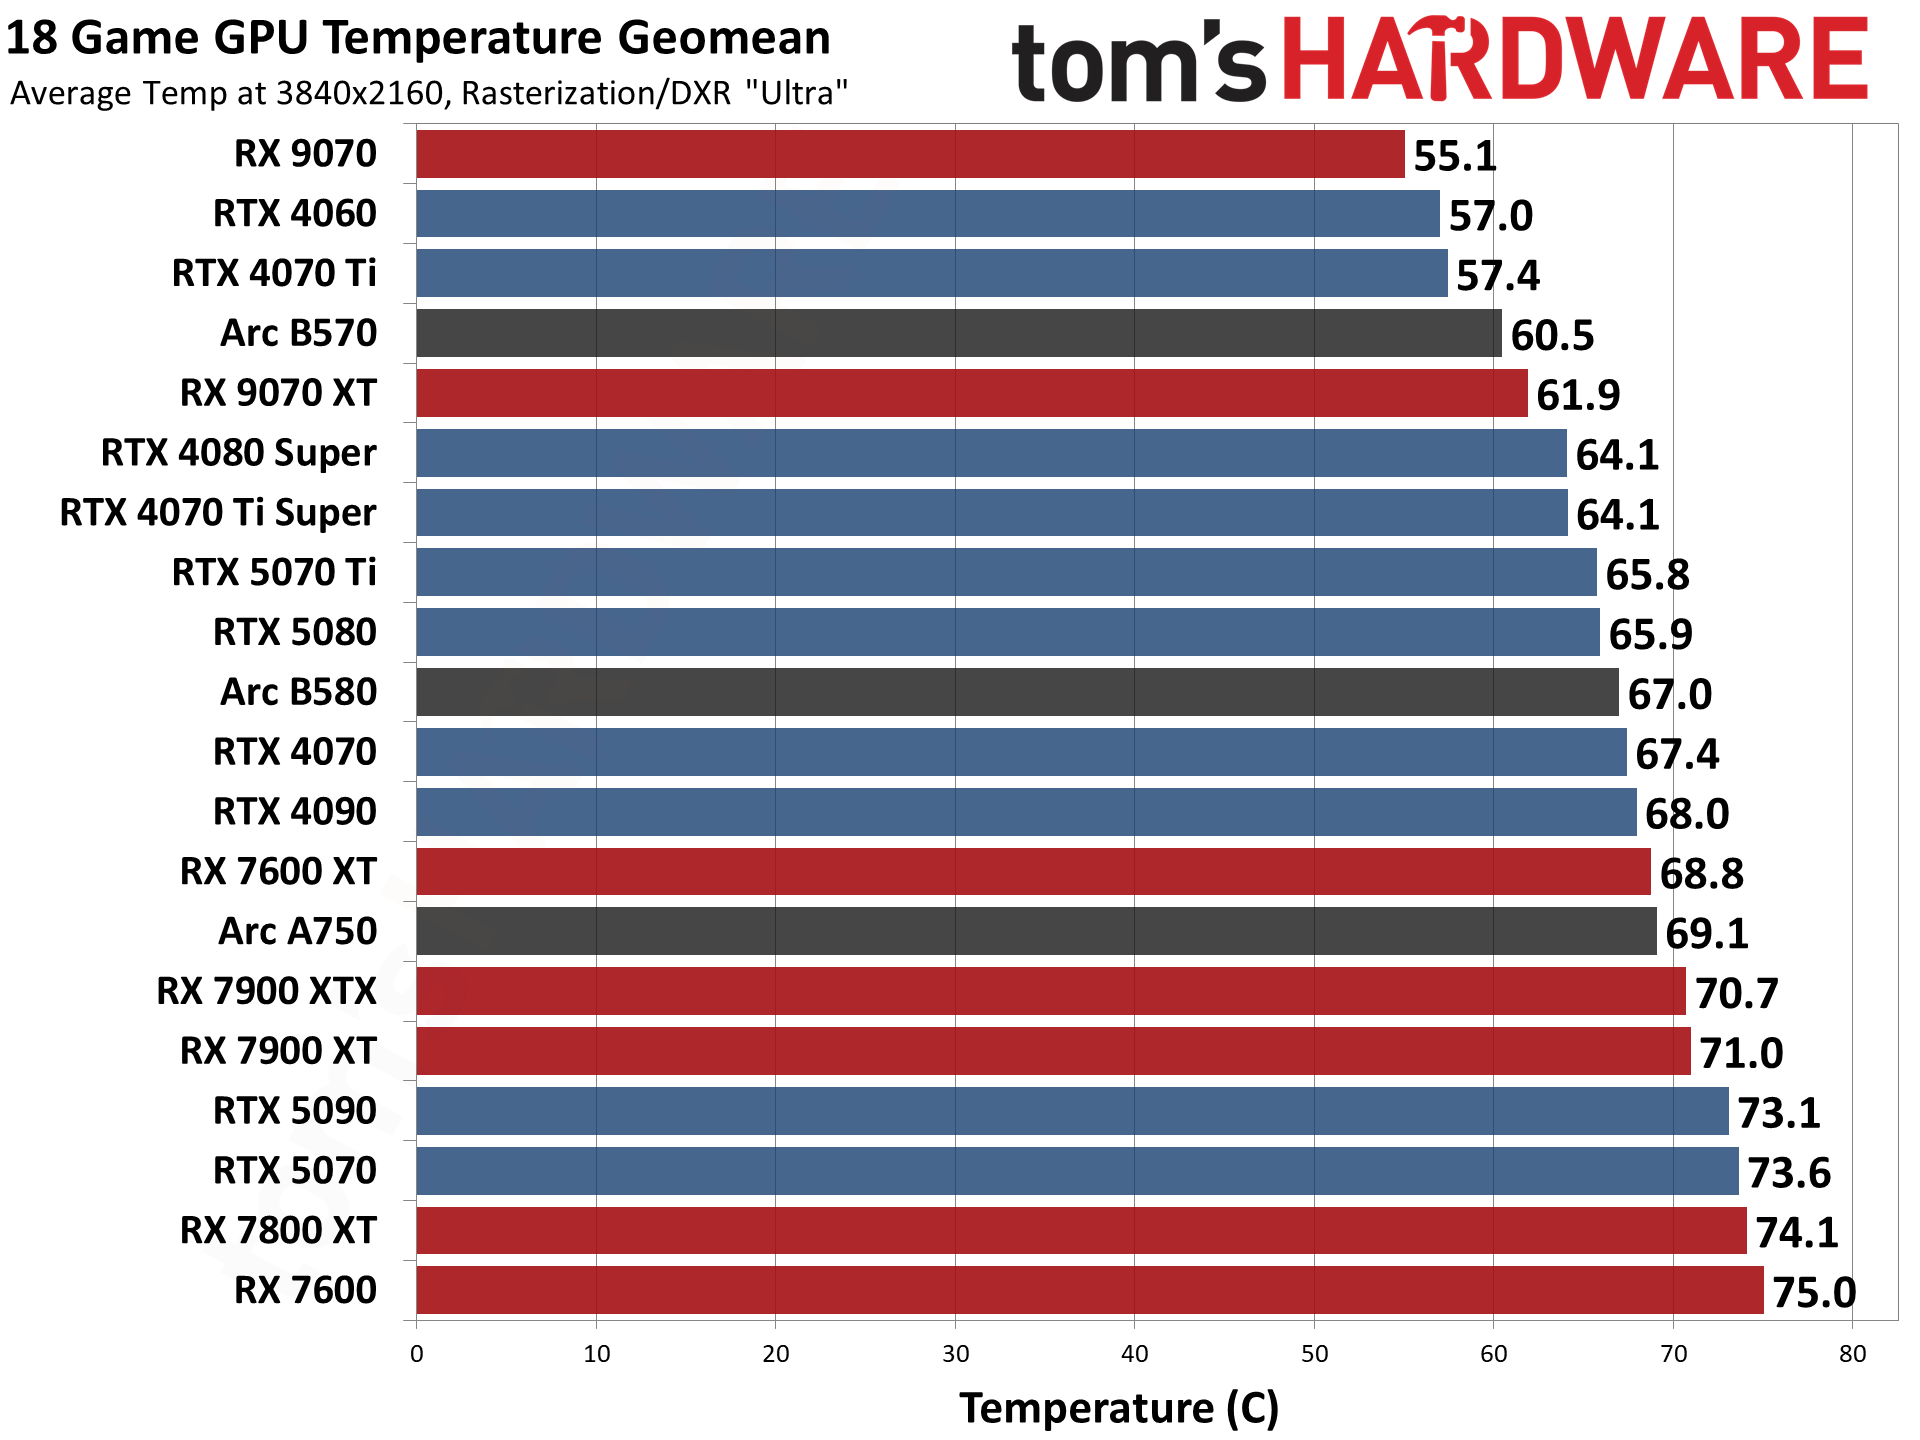
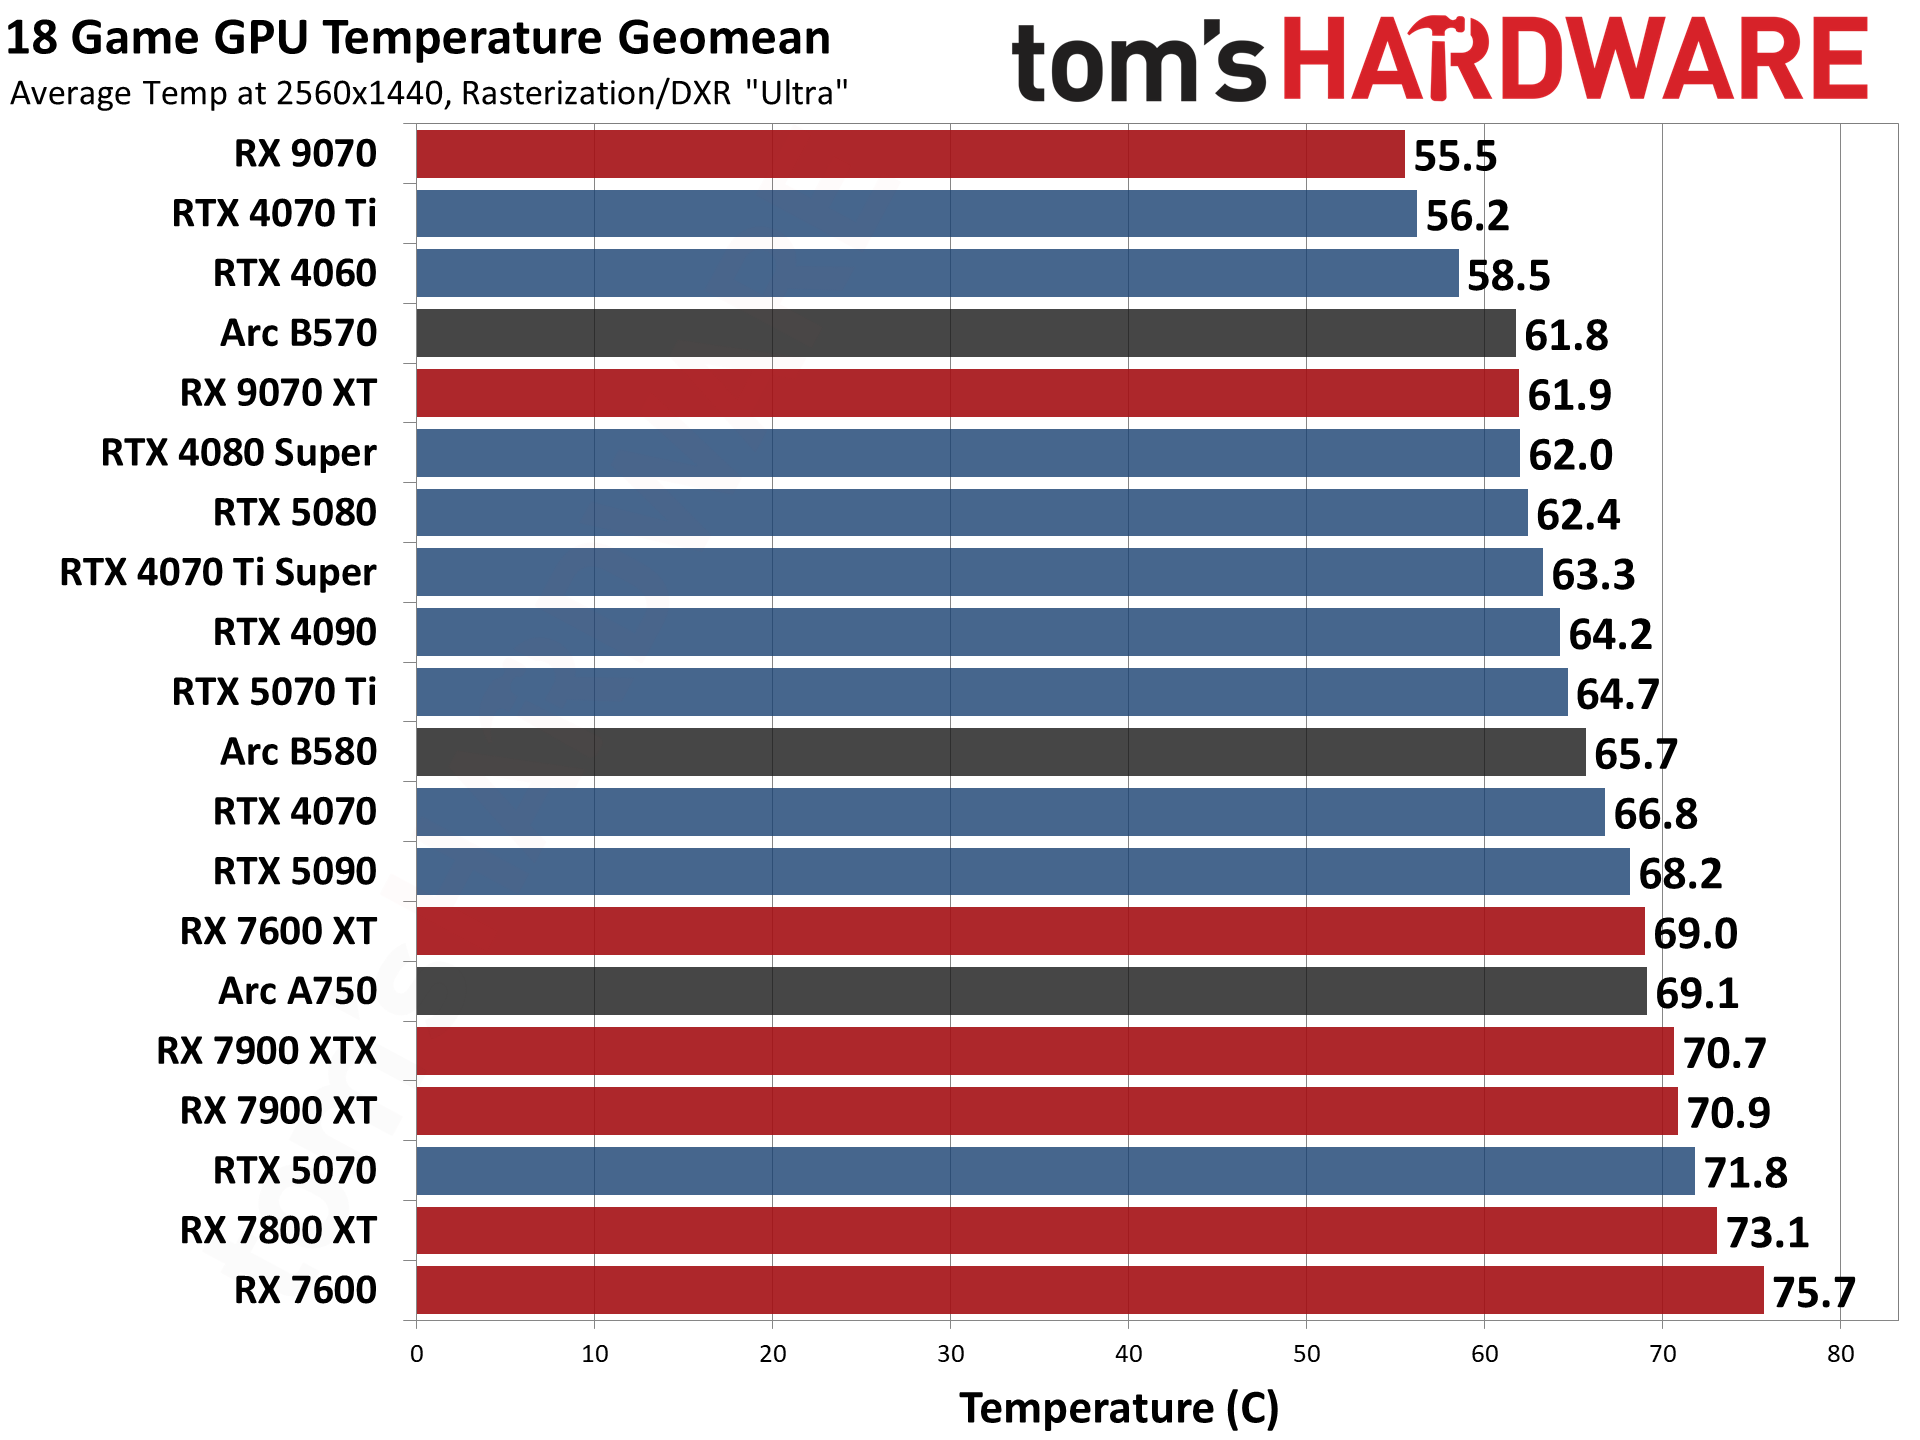
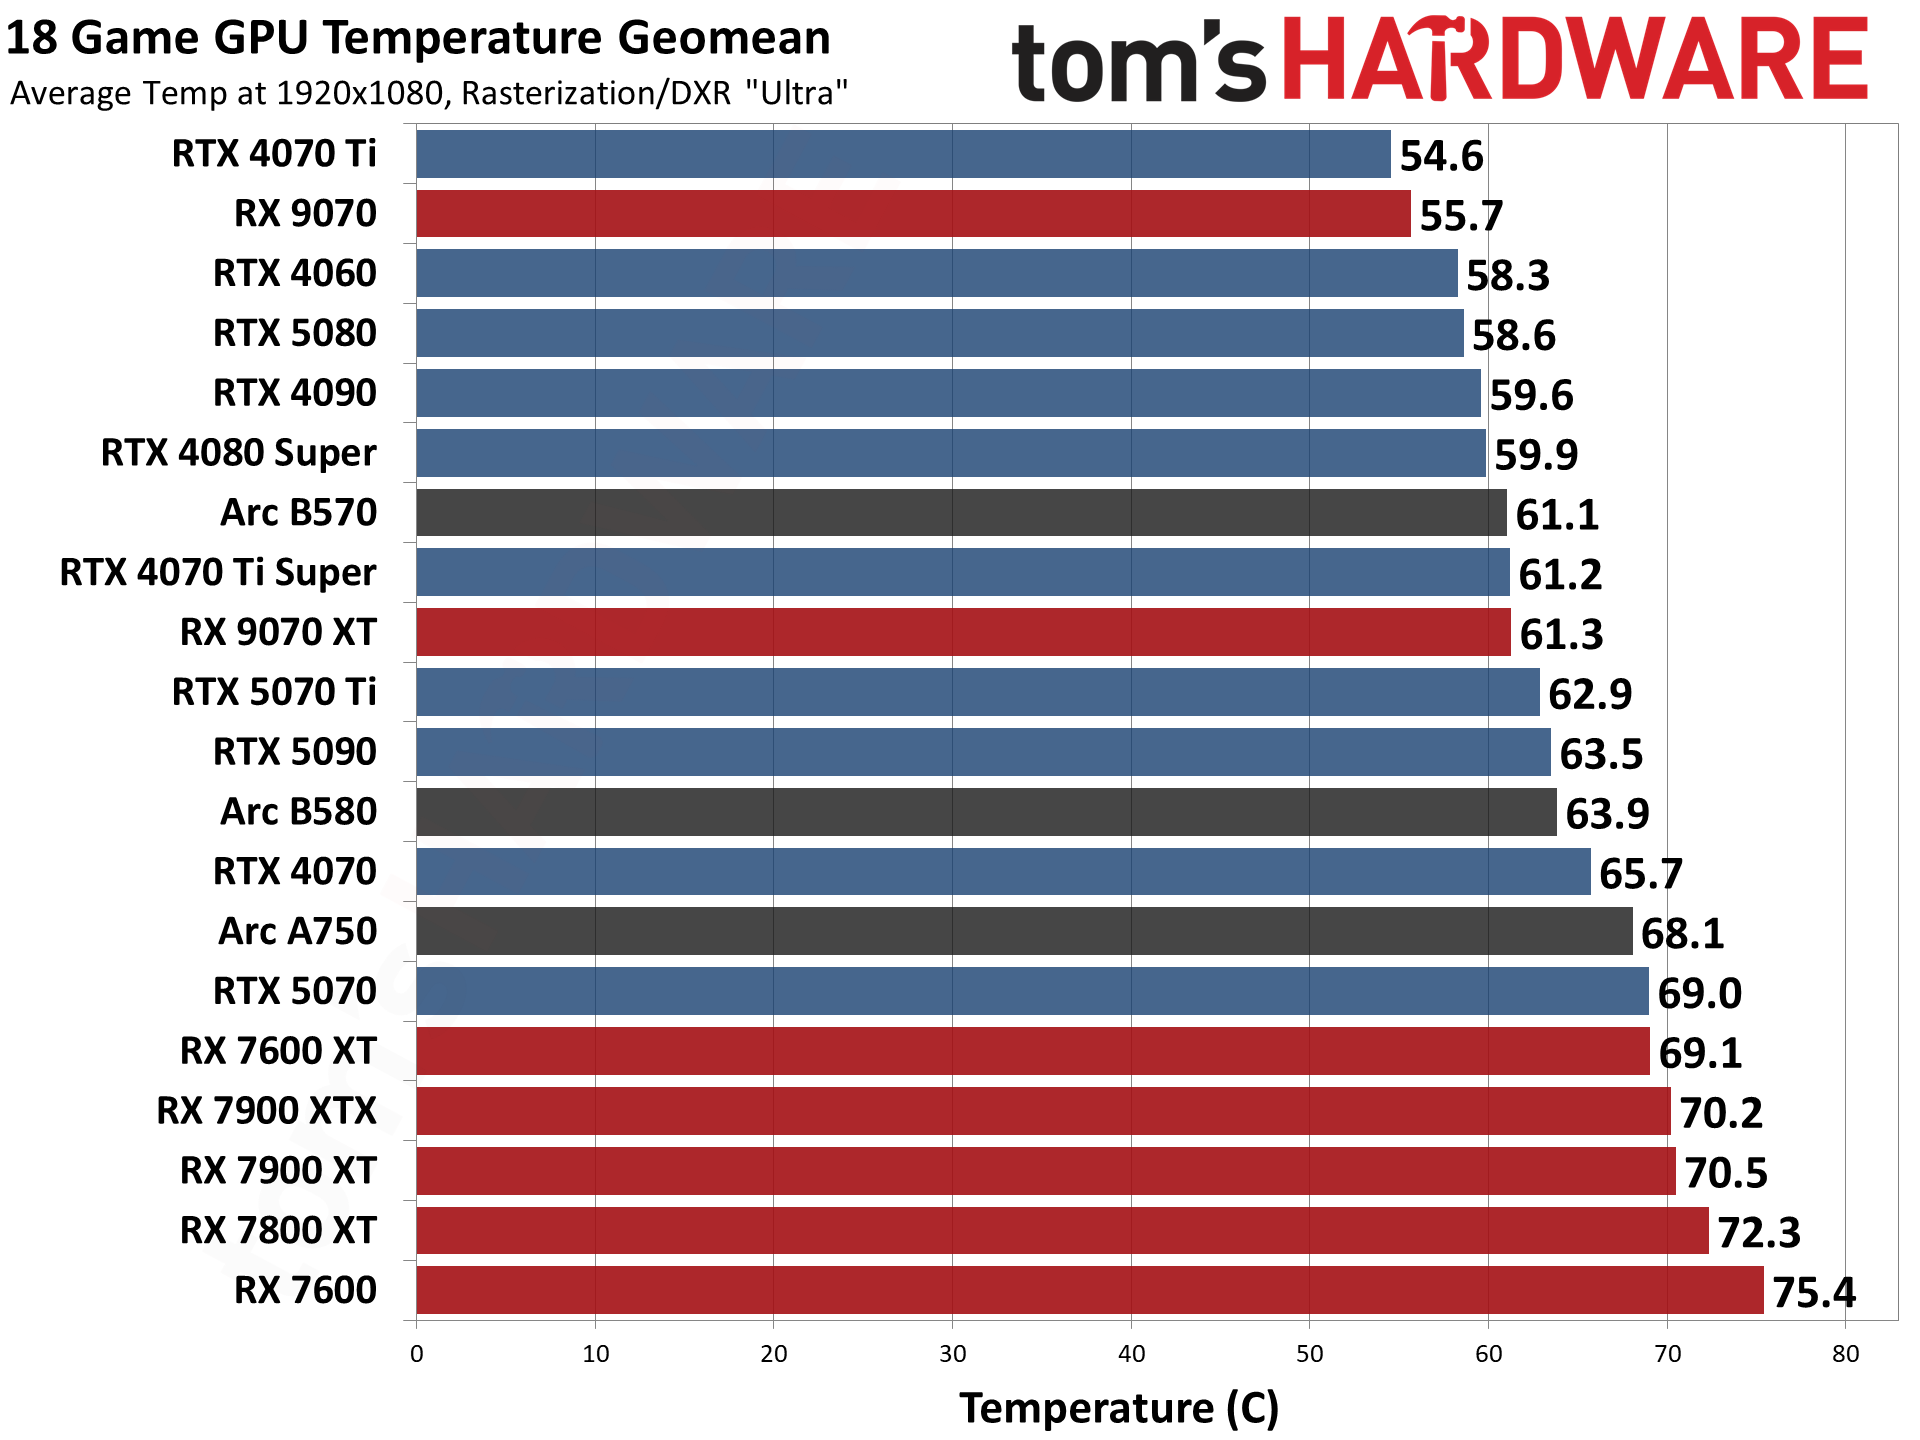
Most of our discussion has focused on performance, but for those interested in power and other aspects of the GPUs, here are the appropriate charts. We’ll run these from highest to lowest settings, as 4K ultra tends to be the most strenuous workload on most of these GPUs.
If you’re looking for the legacy GPU hierarchy, head over to page two! We moved it to a separate page to help improve load times in our CMS as well as for the main website. And if you’re looking to comment on the GPU benchmarks hierarchy, head over to our forums and join the discussion!
Choosing a Graphics Card
Which graphics card do you need? To help you decide, we created this GPU benchmarks hierarchy consisting of dozens of GPUs from the past four generations of hardware. Not surprisingly, the fastest cards are using the latest GPU architectures, though they’re not always a major upgrade over the prior generation.
Of course it’s not just about playing games. Many applications use the GPU for other work, and we cover professional GPU benchmarks in our full GPU reviews. But a good graphics card for gaming will typically do equally well in complex GPU computational workloads. Buy one of the top cards and you can run games at high resolutions and frame rates with the effects turned all the way up, and you’ll be able to do content creation work as needed. Drop down to the middle and lower portions of the list and you’ll need to start dialing down the settings to get acceptable performance in regular game play and GPU benchmarks.
If your main goal is gaming, you can’t forget about the CPU. Getting the best possible gaming GPU won’t help you much if your CPU is underpowered and/or out of date. So be sure to check out the Best CPUs for gaming page, as well as our CPU Benchmarks Hierarchy to make sure you have the right CPU for the level of gaming you’re looking to achieve.
منبع: https://www.tomshardware.com/reviews/gpu-hierarchy,4388.html
تحریریه مجله اچ پی